
A social media report can boast millions of views and thousands of likes while failing to answer whether your marketing actually drove business results. Vanity metrics look impressive on a dashboard, but they rarely reveal if you reached qualified buyers or generated real revenue.
To prove value, modern marketers must track specific social media metrics that guide strategic decisions—such as optimizing ad spend, fixing campaign bottlenecks, and scaling high-performing content. Whether your goal is brand awareness or direct conversions, the right measurement framework maps the exact journey from exposure to financial return. Here are the 10 essential social media metrics that matter and how to track them.
What Social Media Dashboards Often Hide
Social platforms do not use one shared measurement standard. Meta treats reach as an estimated count and distinguishes it from impressions, which can include repeated exposure. LinkedIn’s native Page engagement rate includes clicks, reactions, comments, and shares. TikTok Ads Manager counts a video view when playback starts, while LinkedIn applies a viewing-time threshold to post video views.
That makes direct cross-platform comparisons unreliable. A 5% engagement rate on LinkedIn may represent a different set of actions from a 5% rate calculated manually for Instagram. Two videos with the same reported view count may also have held attention for very different lengths of time.
First-party dashboards and website analytics will not always agree either. A platform can record a click as soon as it happens, while a web analytics session depends on the destination loading far enough for the tracking tag to fire. Attribution settings, reporting windows, and event configuration introduce further differences.
Every recurring report should document four things:
- Where the data came from
- Which actions were included
- What denominator was used
- Which attribution setting or window applied
This is dull administrative work, but it prevents an accurate number from turning into a misleading conclusion.
10 Social Media Metrics That Matter From Attention to Business Return

These metrics follow the path from initial exposure to measurable business value. Some reveal whether content reached the right audience or held attention; others show whether that attention produced traffic, conversions, and financial return. Use the measures that match the campaign objective rather than forcing posts into the same template.
1. Qualified Reach
Reach estimates how many distinct people or accounts saw the content. Qualified reach goes one step further by examining whether those people resemble the intended audience. It is usually not a separate button inside an analytics dashboard. It is an editorial and analytical layer applied to reach data using whatever audience information the platform provides.
Consider a home-services company operating in three cities. Reaching 50,000 accounts may look better than reaching 8,000, but not if most of those 50,000 people live outside the service area. A B2B software company may similarly prefer a smaller audience of relevant operations leaders to a much larger audience with no connection to the product.
Review reach alongside location, industry, seniority, follower status, and organic versus paid distribution where those breakdowns are available. Access varies by platform, account type, content format, and audience size. Some demographic data may also be withheld when the audience is too small to report without compromising user privacy.
Qualified reach is useful for awareness and audience expansion. It remains a measure of possible exposure, not proof that people paid close attention.
2. Consistently Calculated Engagement Rate
Raw engagement totals favor posts that received wider distribution. A rate makes it easier to compare audience response across posts with different levels of reach.
For organic content, a team might calculate:
Engagement rate by reach = selected interactions ÷ reach × 100
The selected interactions could include reactions, comments, shares, and saves. There is no universal formula, so consistency matters more than pretending one version is definitive.
Do not compare a manually calculated rate with a platform’s native rate without checking the definitions. LinkedIn’s Page engagement rate, for example, uses impressions as its denominator and includes clicks in its interaction total.
The number also needs a human check. A post filled with complaints, corrections, or hostile replies may produce a strong engagement rate. Before describing an unusually active post as successful, read the conversation and identify what prompted it.
3. Save Rate
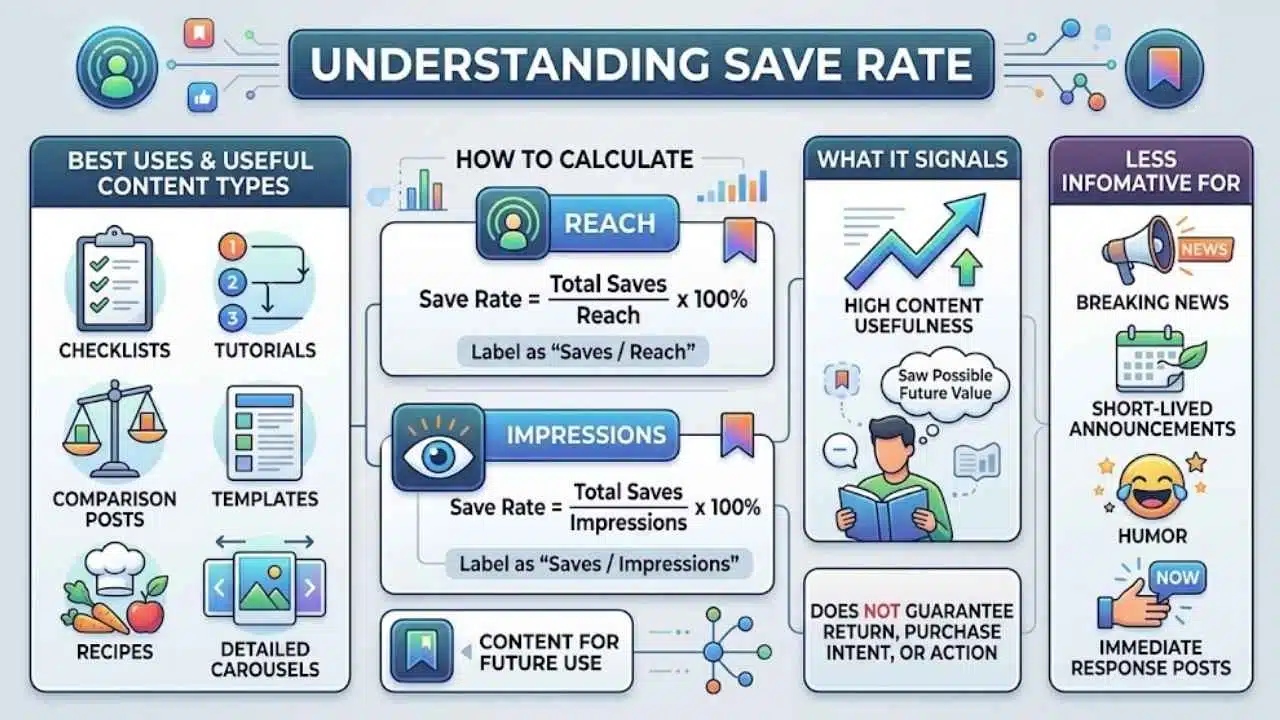
Saves are particularly useful for content designed to be revisited: checklists, tutorials, comparison posts, templates, recipes, and detailed carousels. Where saves are reported, calculate the rate against reach. If only impressions are available, use them and label the denominator.
A strong save rate suggests that people saw possible future value in the post. It does not prove they returned, followed the advice, or bought anything. Treat saves as a content-usefulness signal rather than disguised purchase intent.
This metric is much less informative for breaking news, short-lived announcements, humor, or posts meant to provoke an immediate response.
Shares show how often people chose to extend the content’s distribution. Some platforms also report private sends, which can be relevant when users pass a post to a colleague or friend without commenting publicly.
The calculation is simple:
Share rate = reported shares or sends ÷ reach × 100
The interpretation is not. People share content because it is helpful, entertaining, surprising, controversial, or inaccurate. A high share rate is a reason to inspect the post, not automatic evidence of approval.
Look at the comments, referral traffic, audience reached, and surrounding conversation. That extra check separates useful word of mouth from criticism or curiosity.
5. Audience Retention
A raw video view says little about how much of the video was watched. Retention shows where attention held and where it disappeared. Useful measures include average watch time, average percentage viewed, completion rate, and the retention curve. Compare videos of similar length and format. A 20-second product demonstration and a six-minute tutorial should not be held to the same completion standard.
A steep early decline often points to one of two problems: the opening took too long, or the video did not deliver what its caption, title, or thumbnail promised. Later dips may reveal a repetitive explanation, a misplaced promotion, or a section that could be removed.
Spikes require care too. YouTube notes that they can appear when viewers rewatch or share a section. They can also appear when an explanation is confusing enough to require another viewing.
Retention data identifies the moment worth reviewing. It does not explain the cause automatically.
6. Outbound Click-Through Rate
Outbound click-through rate measures whether social content persuaded people to visit the intended destination.
Outbound CTR = destination clicks ÷ impressions × 100
Use destination or landing-page clicks rather than a broad “all clicks” total. Depending on the network, the broader figure may include profile visits, reactions, comments, image expansions, or other interface activity. Meta’s “clicks all,” for example, can include social interactions as well as link clicks.
CTR is valuable when the post is supposed to drive article reads, product visits, registrations, downloads, or event bookings. It should carry less weight when the content was built strictly for on-platform awareness.
If CTR is weak, check the offer, call to action, and connection between the post and its destination. If platform CTR is strong but recorded website traffic is unexpectedly low, inspect the link, page speed, redirects, and analytics tag before blaming the creative.
7. Engaged-Session Rate From Social
Getting people to click is only half the job. The next question is whether the visit had enough substance to justify the traffic.
Google Analytics 4 currently treats a session as engaged if it lasts longer than 10 seconds, contains a key event, or includes at least two page or screen views. Segment this rate by social source, campaign, landing page, and content variation.
Consistent UTM parameters are essential. At minimum, establish clear naming rules for source, medium, and campaign. UTM values are case-sensitive, so instagram, Instagram, and ig can split one source across several rows. This is a common reporting mistake, and it is avoidable.
Engaged-session rate is still a diagnostic measure. A visitor can meet GA4’s threshold without becoming a customer. Judge it alongside the outcome the landing page was built to produce.
A viral post that sends 4,000 poorly matched visitors may contribute less than a targeted post that brings 300 readers who subscribe, request a demonstration, or explore relevant product pages.
8. Conversion Rate
This is where social reporting should become stricter. Teams often use “conversion” for everything from a page view to a completed sale, which makes the final rate look more meaningful than it is.
A primary conversion should represent a real outcome: a purchase, confirmed subscription, booked appointment, completed registration, or properly qualified enquiry. Product views, button clicks, form starts, and scroll depth can help diagnose the journey, but they belong in a separate group of supporting events.
For session-based reporting, calculate:
Session conversion rate = social sessions containing the chosen key event ÷ total social sessions × 100
This avoids counting several occurrences during one visit as several converting sessions. A user-based or click-to-conversion rate can also be useful, but the denominator must be stated.
Lead-generation teams need another layer of scrutiny. Form submissions may include spam, sales pitches, job applications, existing customers, and people who do not meet the buying criteria. Connecting campaign data to CRM qualification produces a more honest measure than celebrating every submitted form equally.
9. Cost per Qualified Result
Ad platforms calculate cost per result based on the campaign objective. That result might be a click, video view, install, lead, or purchase. The platform’s chosen result is not necessarily the outcome the business values most.
For internal reporting, use:
Cost per qualified result = relevant campaign cost ÷ qualified outcomes
An ecommerce company may use cost per completed purchase. A B2B business may care more about cost per sales-qualified lead or accepted meeting than cost per form submission. Recruitment campaigns should distinguish eligible applications from total applications.
The definition of cost also depends on the decision being made. Media spend may be enough when comparing two ad sets. A broader channel review should include relevant creative production, contractors, software, and staff time. Organic publishing is not free simply because it has no media budget.
Small samples can make this metric unstable. If a campaign produces only four sales, one additional purchase can sharply change the apparent acquisition cost. Look for a trend before making a major budget decision.
10. ROAS and Social Media ROI
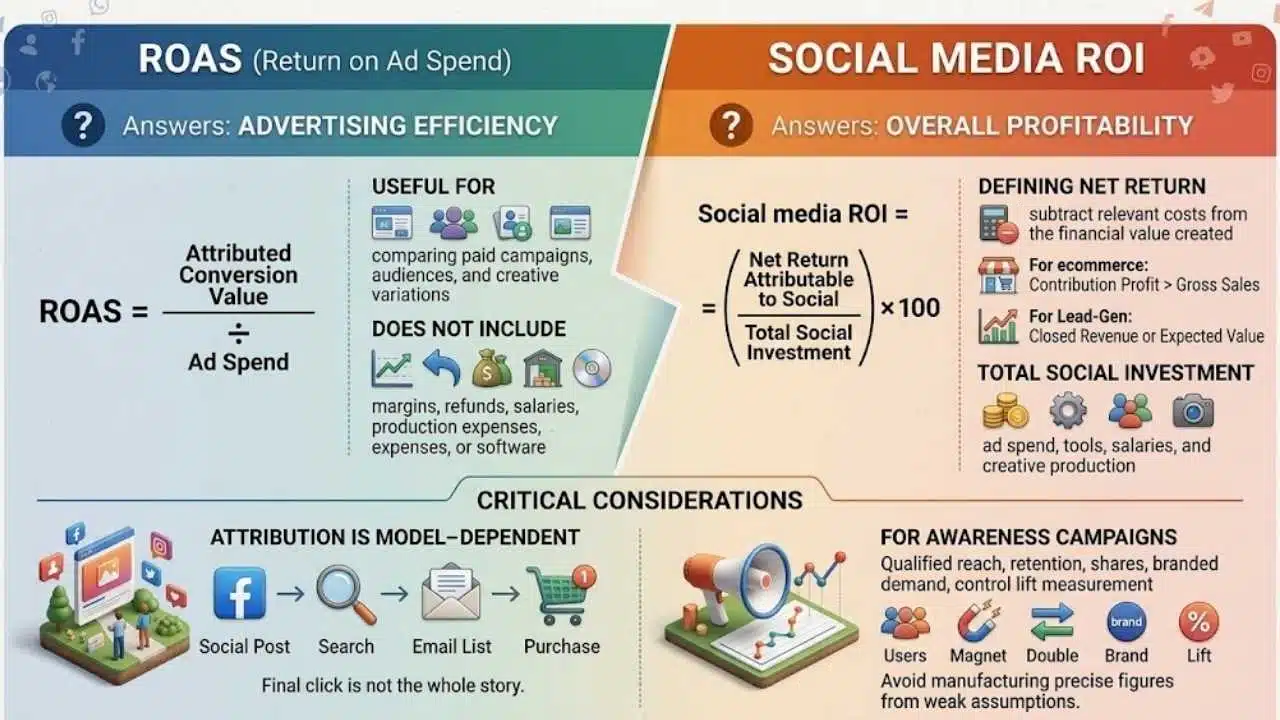
ROAS and ROI are often treated as interchangeable, but they answer different questions.
ROAS = attributed conversion value ÷ ad spend
ROAS shows how much conversion value, often revenue, was attributed to each unit of advertising spend. It is useful for comparing paid campaigns, audiences, and creative variations. It does not automatically account for margins, refunds, salaries, production expenses, or software.
A broader social media ROI calculation is:
Social media ROI = net return attributable to social ÷ total social investment × 100
Net return should subtract relevant costs from the financial value created. For ecommerce, contribution profit is usually more informative than gross sales. Lead-generation teams should use closed revenue or a carefully calculated expected value rather than assuming every lead will become a customer.
Attribution is model-dependent. Someone may discover a company through a social post, return through search, subscribe to an email list, and purchase later. Review attribution paths and settings rather than assuming the final click tells the entire story.
For awareness campaigns, avoid manufacturing a precise ROI figure from weak assumptions. Qualified reach, retention, shares, branded demand, or controlled lift measurement may be more defensible until a clearer financial connection can be established.
The Practical Takeaway
A useful social media report does not need dozens of charts. Start with one primary business outcome, two or three indicators that help explain it, and one guardrail that prevents misleading conclusions.
An ecommerce campaign might track purchase value as the main outcome, with outbound CTR and conversion rate as diagnostic metrics and refund rate as a guardrail. A thought-leadership program may focus on qualified reach, saves, shares, and relevant enquiries.
The social media metrics that matter are not necessarily the largest numbers in the dashboard. They are the measurements that connect content to audience behavior, expose weak points in the journey, and lead to a sensible next action.
Frequently Asked Questions
There is no single metric that suits every objective. For sales campaigns, conversion value and acquisition cost usually carry more weight than engagement. For awareness campaigns, qualified reach and audience retention may be more appropriate. Choose the business outcome first, then select the metric.
Are likes a vanity metric?
Likes become a vanity metric when they are reported without context or treated as proof of commercial success. They can still help compare audience response to similar posts, especially when paired with shares, saves, comments, and downstream actions.
A universal benchmark is rarely helpful because platforms, industries, audience sizes, formats, and formulas differ. Establish a rolling baseline from the account’s own comparable posts. Compare video with video, paid with paid, and similar audience sizes wherever possible.
Campaign teams may need daily checks for spending problems, broken links, or tracking failures. Weekly reviews are better for content adjustments, while monthly or quarterly reporting provides a clearer view of trends, revenue, and strategic progress. Avoid rewriting the strategy after one unusually strong or weak post.