
Many small business owners feel like they read tea leaves when they check profit margin or cash flow ratio. Gross profit margin measures how well you use labor and supplies to make goods or run services.
This guide shows you profit margins, cash flow ratio, return on investment and how to track them in Excel or on a dashboard. Keep reading.
Key Takeaways
- Gross profit margin shows core costs versus sales. Calculate (net revenue – cost of goods sold) ÷ net revenue. A high margin means you run lean. Use a spreadsheet or Profit Margin Calculator to track trends.
- Net profit margin shows profit you keep from each sales dollar. Calculate (net income ÷ sales) × 100%. Aim for at least a 10% margin. Use QuickBooks, a spreadsheet, or a dashboard to compare months and industry benchmarks.
- Return on investment (ROI) shows profit versus cost. Calculate (net income ÷ investment) × 100%. A 200% ROI means you earn twice your money. Track it in a spreadsheet or return analysis tool.
- Cash flow ratio checks liquidity. Calculate operating cash flow ÷ current liabilities. A value above 1 means you can cover short‐term debts. A drop below 1 warns of a cash crunch.
- Debt‐to‐equity ratio = total liabilities ÷ shareholder equity. Mike’s bakery example: $60,000 ÷ $40,000 = 1.5. Ratios above 2 may signal high leverage. Also track operating efficiency (operating expenses ÷ net sales; lower is better) and CAC (marketing spend + sales fees ÷ new customers).
Gross Profit Margin
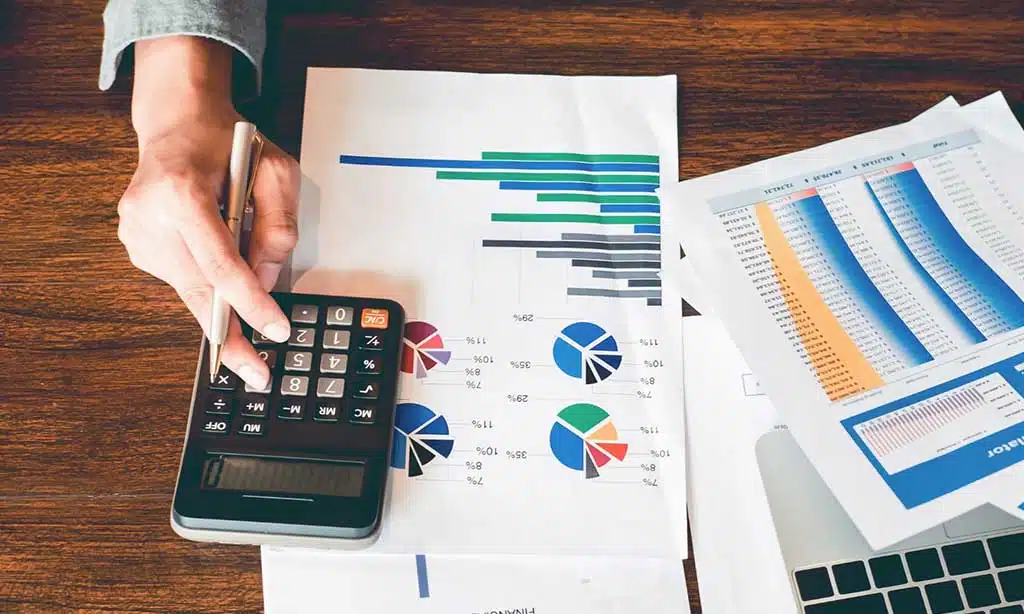
Gross profit margin shows how well you turn sales into profit, after you pay for labor and supplies. It sits on the Income Statement. The formula takes net revenue minus cost of goods sold, and then divides by net revenue.
This metric ranks high among financial metrics, it gives a quick check on core costs versus sales.
High gross margin often means you run lean operations, you pinch each penny and stay in the black. You can plug your figures into a Profit Margin Calculator or a basic workbook, then track trends.
This view helps you shape pricing, control spending, and boost business performance.
Net Profit Margin
Your net profit margin shows how much profit you keep from each dollar of sales. You divide net income by sales and multiply by 100 to get a percent. This percentage reflects profit after you subtract operating expenses, taxes, and interest.
It gives you a clear view of cost control and profit levels.
Most accountants use a spreadsheet or a financial dashboard to track net profit margin. QuickBooks and accounting software can calculate this ratio in seconds. Aim for at least a 10 percent net profit margin to boost financial stability.
You can compare it across months or against industry benchmarks.
Return on Investment (ROI)
ROI measures profit against cost. An ROI of 200% means you earn twice your financial investment. You divide net income by outlays. Then you multiply by 100 to get a percent. Tools like a spreadsheet or a return analysis tool speed this step.
You can use ROI to compare funding options or track return on capital. A figure above 100% signals that gains exceed spending. Shareholder equity often ties to this ratio. Dashboards can track these numbers in real time.
Cash Flow Ratio
Cash flow ratio tracks operating cash flow against current liabilities. It acts like a pulse check for liquidity. It shows if you can cover short-term debts with cash on hand or working capital.
It pulls data from accounts receivable, accounts payable, and current assets. Businesses sense their fiscal health fast.
You can build this metric in a spreadsheet program or an online accounting tool. A reading above one signals solid operational strength. A result below one warns of a cash crunch. Companies then tweak budgets or chase overdue invoices.
This key metric drives smarter cost management.
Debt-to-Equity Ratio
Mike runs a bakery. He calculates his debt-to-equity ratio. First, he finds total liabilities and shareholder equity on his financial statement. He divides 60,000 by 40,000. The result is 1.5.
Mike has $1.50 of debt for each dollar of equity.
A ratio above two may signal high leverage. Lenders and investors watch that number. Spreadsheet tools and accounting software like QuickBooks can help. Bank officers add this metric to loan applications.
Lower ratios hint at stronger financial stability.
Operating Efficiency Ratio
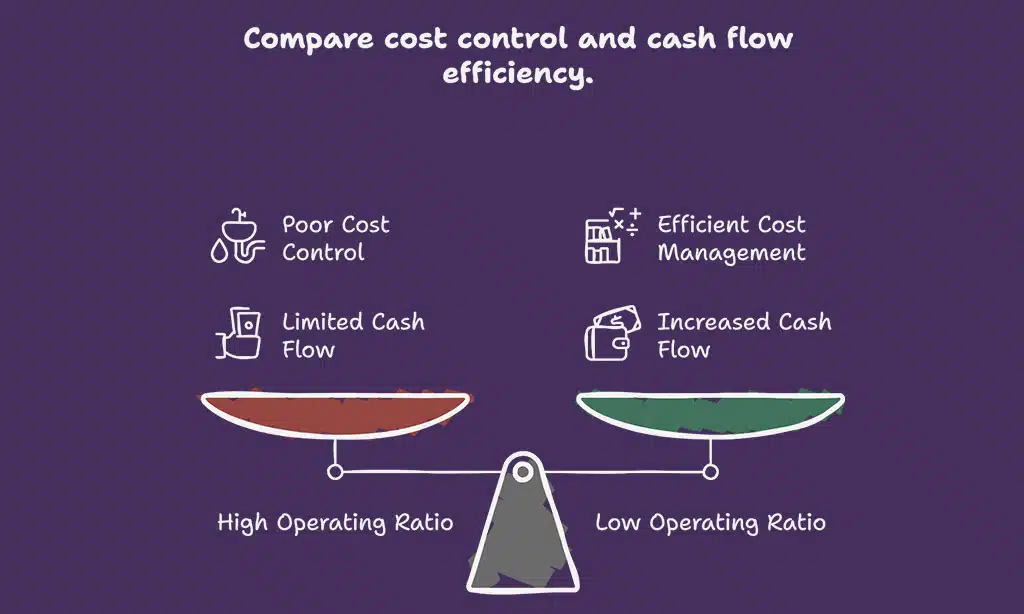
Open spreadsheet software on your computer. Plug in total operating expenses and net sales. Divide expenses by sales. The result shows cost control in action.
A low ratio means your firm runs like a tight ship. It frees up cash on hand. You track it in ratio analysis for financial health. It improves your operating cash flow view.
Customer Acquisition Cost (CAC)
Getting a new customer costs real money. You add marketing spend to sales fees. Then you divide that sum by the number of customers you win. The answer shows your customer acquisition cost, or CAC.
Use tools like Google Analytics or Excel to track this metric.
If that figure climbs, your wallet might feel the pinch. A rising CAC in a CRM report signals a need for cost control. Aim to keep CAC below your customer lifetime value to protect cash flow and boost your bottom line.
How to Regularly Monitor These Metrics
Weekly checks reveal cash flow gaps. Regular reviews lead to 1% quarterly gains.
- A weekly check with spreadsheet software captures cash on hand, accounts receivable, current assets, and helps calculate current ratio.
- Pull data from accounting software on gross profit margin and net profit margin for clear cost control.
- Track your debt-to-equity ratio alongside current liabilities to flag any debt service coverage risks.
- Analyze customer acquisition cost next to sales revenue figures in a dashboard, so you spot cost spikes quickly.
- Meet with your team every quarter to review your operating efficiency ratio and set a fresh 1% improvement goal.
- Monitor your cash flow ratio each week to catch dips, real-time insight keeps you agile.
- Generate a report on return on investment and net income, then use it to guide upcoming spend.
- Send financial statements by the 10th of each month to keep your records up to date.
- Audit your overhead expenses, payables, and recurring revenue each quarter to trim spending.
Tools and Resources for Financial Tracking
Spreadsheet tools and SaaS platforms deliver cost control and streamlined reporting. Cloud-based platforms, like Talentia, automate data entry. They scale with startups and nonprofits.
Teams track current assets, cash on hand and operating cash flow. Your team watches accounts receivable in real time to gauge key financial metrics.
Platforms support GAAP standards for net profit margin and debt-to-equity ratio. Dashboards send alerts as cash flow dips or debt service coverage ratio slips. Automation frees you from manual bookwork and boosts business performance.
You use secure links for enhanced financial communication across your team.
Takeaways
Tracking these key metrics gives you a map and a compass. Spot trouble early. Boost gross profit margin, tweak operating efficiency, guard the cash flow ratio. A handle on debt to equity and ROI drives smart calls.
Launch accounting software or a spreadsheet app each week. Watch numbers with care. This habit fuels steady growth.
FAQs on Key Metrics to Measure Your Financial Health
1. What are the 7 key metrics to measure your financial health?
You look at cash flow, operating cash flow, current ratio, gross profit margin, net profit margin, debt to equity ratio, and customer acquisition cost. Think of these metrics as a health check for your wallet.
2. How do I measure cash flow and operating cash flow?
Cash flow tracks all money in and out. Operating cash flow covers money from daily business operations. Use cash accounting for real flow, and accrual accounting to track owed money.
3. Why track gross profit margin and net profit margin?
Gross profit margin shows how much you earn after you pay cost of goods sold and overhead costs. Net profit margin tells you what stays after all operating expenses and tax deductions.
4. What does debt to equity ratio tell me?
Debt to equity ratio shows if you rely too much on lending and debt. It values your debts against your equity. A high ratio can hurt your financial stability.
5. How do current ratio and invoice balances affect liquidity?
Current ratio uses current assets and current liabilities to test liquidity. It tells you if you can pay short term bills. You should also watch invoice balances, for example unpaid customer invoices, to see if money will come in soon.
6. Why is customer acquisition cost key to business performance?
It tracks money you spend to get each new client. Compare it to your contribution margin, or subscriptions revenue, to see if you spend too much. Watching customer acquisition costs helps you control marketing budgets and hit better rates of return.