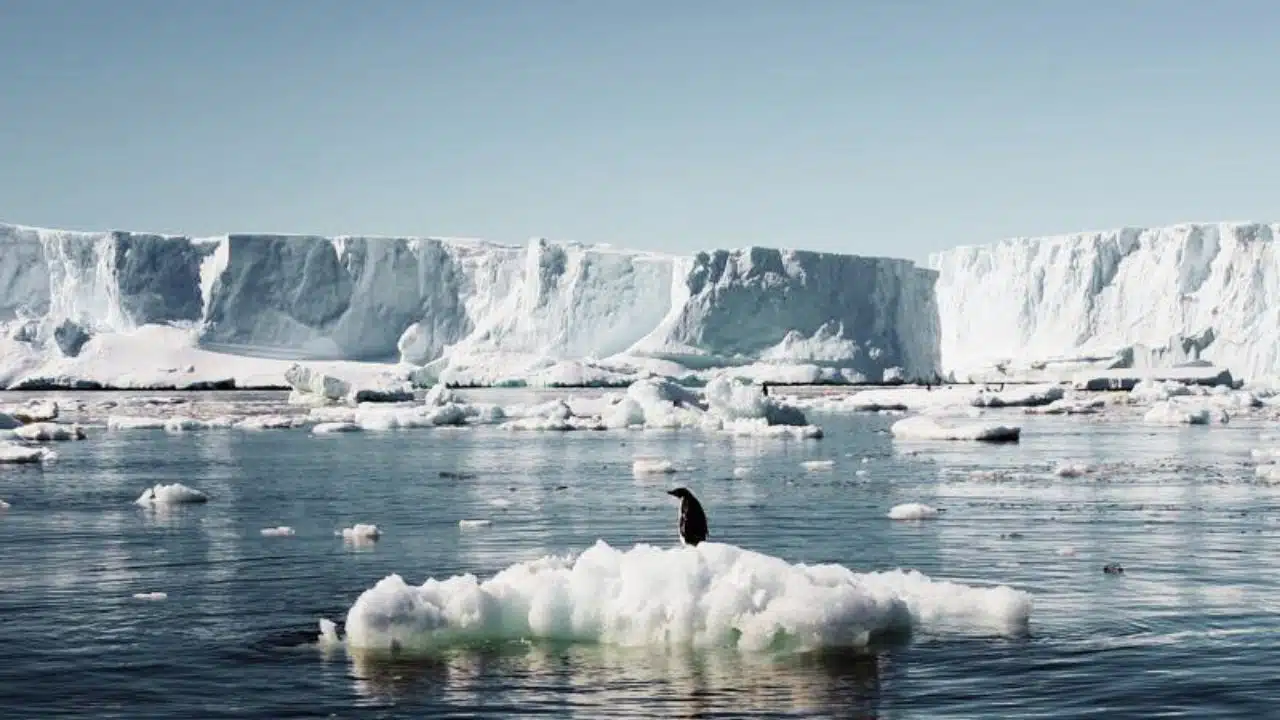
New climate simulations warn that unchecked Antarctic ice melt could raise global sea levels by around 10 feet (over 3 meters) by 2200 in a very high‑emissions world, dramatically reshaping coastlines worldwide. Scientists say the window to avoid the worst outcomes depends on how fast governments cut planet‑warming pollution over the next few decades.
Stark new projections
The latest modeling work couples advanced ice‑sheet physics with ocean and atmosphere models to explore how Antarctica responds if greenhouse gas emissions remain extremely high. In that scenario, Antarctica alone adds more than 3 meters—roughly 10 feet—to global sea level by 2200, far above previous central estimates for the ice sheet.
Researchers find that the contribution from Antarctica stays relatively modest through 2100, then accelerates sharply in the 22nd century as major ice basins destabilize and retreat. Once large‑scale collapse starts in West Antarctica, the simulations indicate that the process becomes effectively unstoppable on human timescales.
Why Antarctica matters
Antarctica holds enough frozen water to raise global seas by about 65 meters if it were ever fully melted, making it the single largest long‑term threat to coastal communities. Until recently, many projections suggested its biggest impacts would unfold over millennia, but newer work shows major increases are possible within a few centuries if warming continues.
The West Antarctic Ice Sheet, which rests largely on bedrock below sea level, is particularly vulnerable to warm ocean water undercutting glaciers from below. Several studies now show that, under strong warming, this region enters a phase of rapid, self‑sustaining retreat that feeds directly into global sea‑level rise.
Uneven impact on coasts
Sea level does not rise evenly around the world, and new research maps where Antarctic meltwater would hit hardest. Because of gravitational and Earth‑rotation effects, some tropical and subtropical regions could see sea‑level rise from Antarctic melt that is significantly higher than the global average.
Low‑lying island nations and densely populated deltas are among the most exposed, with critical infrastructure, farmland, and freshwater supplies all at risk. By 2060, more than a billion people could be living in areas less than 10 meters above sea level, magnifying the danger as Antarctic contributions ramp up later in the century and beyond.
Timeline: slow start, then surge
Across many independent modeling efforts, a consistent pattern emerges: Antarctic‑driven sea‑level rise is limited through 2100 but grows rapidly afterward if emissions remain high. Some simulations show a rise of around 5 to 5.5 feet by 2200 from West Antarctica alone under current emissions trajectories, with larger totals when East Antarctica begins to lose mass.
Other studies that include additional physical processes—such as subglacial water lubricating ice flow—find that these feedbacks can amplify sea‑level contributions further over the 22nd and 23rd centuries. Together, they paint a picture in which “after 2100, all bets are off” unless emissions are sharply curtailed.
What scientists say must happen now
Climate scientists stress that these dire 10‑foot outcomes are tied to very high‑emissions futures, not an unavoidable destiny. In lower‑emissions scenarios where warming is limited and ice‑shelf buttressing is partly preserved, Antarctica’s contribution to sea‑level rise by 2200 is substantially smaller, though still significant.
Researchers argue that rapid, deep cuts to fossil‑fuel use—combined with stronger coastal planning and defenses—are essential to reduce the odds of catastrophic Antarctic retreat. Without such action, today’s children and grandchildren could inherit coastlines reshaped by a sea that has risen several meters, forcing mass relocation from some of the world’s largest cities.