
Ever watched an AI feature look cheap in a demo and then expensive on the monthly bill? That is exactly why I use AI showback and chargeback to allocate AI spend before costs start chewing through margin.
In the 2025 Mavvrik and Benchmarkit report, 84% of surveyed companies said AI delivery costs cut product gross margin by more than 6 percentage points. That is a big enough hit to change pricing, roadmap choices, and staffing plans.
I am going to walk you through the setup I would use: first show teams what they consume, then tighten the cost allocation model, and only then move money across budgets. Keep reading.
Understanding AI Showback and Chargeback
I keep these two ideas simple. Showback gives teams cost visibility, and chargeback adds financial accountability. For AI, that difference matters even more because token use, cached prompts, retries, and GPU time can grow quietly until the invoice lands.
Definition of Showback
Showback is the low-friction way to make AI spend visible before anyone argues about who has to pay.
Showback reports usage and cost to the team that created it, but it does not post that cost into the team’s official budget. In the latest Microsoft FinOps guidance, the recommended starting point for most organizations is showback, so each team can see the charges it is responsible for before chargeback starts.
I like showback because it lets me test the model in public. If tags are messy, shared GPU costs are unclear, or one workflow spans three vendors, I can fix the reporting logic without creating a budget fight.
- Best first use: new AI features with unclear ownership.
- Best metric set: input tokens, output tokens, cached tokens, request count, and GPU hours.
- Best audience: engineering, product, finance, and team leads.
- Best outcome: teams start changing usage patterns before money moves.
A strong showback report should answer three questions fast: who spent the money, what changed, and what action should happen next.
Definition of Chargeback
Chargeback uses the same underlying usage data, but it goes one step further and sends costs to official budgets, cost centers, or profit and loss lines. The FinOps Foundation draws the line there: the big difference is the formality of posting expenses to accounting budgets.
I do not treat chargeback as the “advanced” version of showback. The same FinOps guidance says neither model is more mature by default, and chargeback depends on your accounting policy.
That is why I only move to chargeback when four things are true:
- Ownership is clear at the team, product, or tenant level,
- Shared costs have a written allocation rule,
- Finance agrees with the journal-entry process,
- Teams have had time to challenge the numbers during showback.
Once those pieces are in place, chargeback stops being a spreadsheet exercise and becomes a reliable management tool.
Key Differences Between Showback and Chargeback
When I explain showback vs chargeback, I frame it as visibility first, accountability second. Both help with cost allocation, but they solve different problems.
Visibility vs Financial Accountability
Visibility changes conversations. Accountability changes behavior. Showback gives each business unit a clear picture of cloud cost, AI workload spend, and usage patterns. Chargeback ties those same numbers to budget ownership, which is why it usually drives faster action.
| Category | Showback | Chargeback |
| Primary goal | Cost visibility | Financial accountability |
| Budget impact | No direct budget deduction | Posted to team or cost center budgets |
| Best time to use | Early rollout, weak tags, new AI services | Stable ownership, approved allocation model |
| Shared cost handling | Can be estimated while the model matures | Needs a documented rule teams can defend |
| Behavior signal | Awareness | Budget pressure and prioritization |
Google’s shared-services FinOps guidance is useful here because it ties showback to awareness and chargeback to accountability. That is the practical split I use too.
Reporting vs Budget Deduction
Reporting is about explaining spend. Budget deduction is about moving spend. Azure’s cost allocation guidance makes this very clear: reallocating shared costs inside the platform does not change the billing invoice. It helps you show and distribute costs, but the actual chargeback process still happens inside your organization.
- Showback report: “Your team used 14 million output tokens and 220 GPU hours last month.”
- Chargeback entry: “Those charges are now assigned to your cost center for close.”
- Showback action: review model choice, prompt size, retries, and cache hit rate.
- Chargeback action: revise budget, forecast, product pricing, or customer entitlements.
I warn teams not to rush this step. If a team cannot control the driver, like shared platform overhead with no usage signal, charging them for it will weaken trust in the whole cloud chargeback model.
Steps to Implement Showback for AI Spend
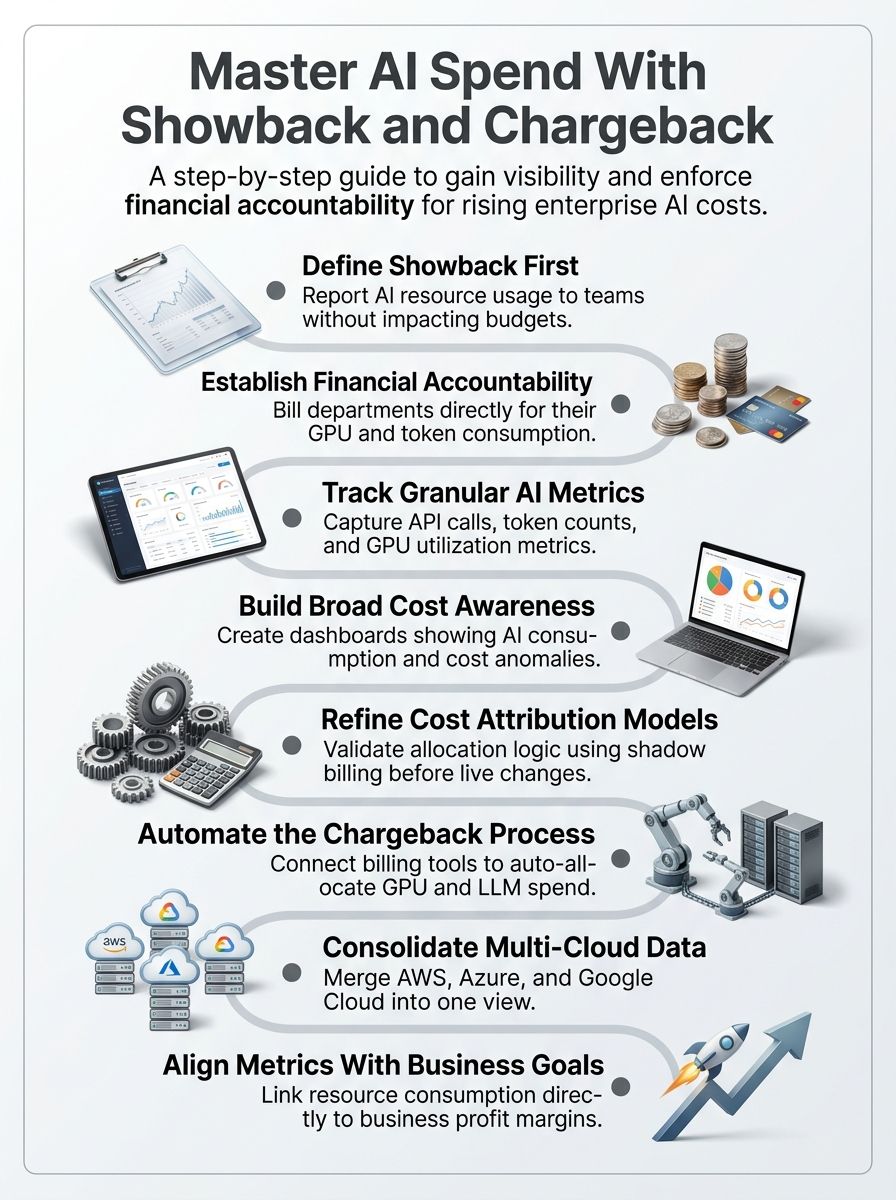
I start with observability that finance can read and engineering can trust. The goal is simple: see the cost clearly enough that you can allocate costs with confidence.
Track AI consumption metrics
For AI, request count alone is too shallow. I want the bill broken into the units that actually drive cost: input tokens, output tokens, cached input, model version, provider, tenant, workflow, and GPU time.
Kong Konnect Metering and Billing helps here because its current documentation includes cost analytics, dimensional filtering, and a built-in LLM cost database. If you are routing traffic through Kong AI Gateway, the metering plugin can capture AI token usage directly, which makes showback reporting much easier to automate.
According to July 2026, official pricing pages show why that detail matters. OpenAI lists GPT-4.1 at $2 per million input tokens and $8 per million output tokens, while Anthropic lists Claude Sonnet 4.5 at $3 per million input tokens and $15 per million output tokens. Output-heavy workflows can get expensive fast, so I always meter input and output separately.
| Metric | Why I track it | What decision it supports |
| Input tokens | Shows prompt volume and context size | Prompt compression and caching |
| Output tokens | Usually the more expensive side of inference | Response limits and model selection |
| Model version | Costs and quality can shift by model | Routing and fallback rules |
| GPU hours | Captures self-hosted or fine-tuned workload cost | Cluster planning and chargeback by team |
| Workflow or agent ID | Maps spend to a business action | Cost per workflow and product pricing |
If your AI workloads run on shared Kubernetes clusters, AWS gives you a strong extra layer of detail. Its split cost allocation data can add pod-level CPU, memory, and accelerator records for Amazon EKS, along with tags such as cluster name, namespace, workload name, and workload type. That is the kind of detail I want before I try to allocate GPU-backed AI workload spend.
- Tag every call with business unit, product, feature, and environment.
- Separate input, output, and cached tokens.
- Record provider and model version so price changes do not blur together.
- Capture workflow, tenant, or customer IDs for unit economics later.
Once that data is clean, cost visibility gets much better and the move from showback to chargeback becomes far less risky.
Build cost awareness across teams
A dashboard alone will not create cost awareness. Teams need a reporting habit they can act on.
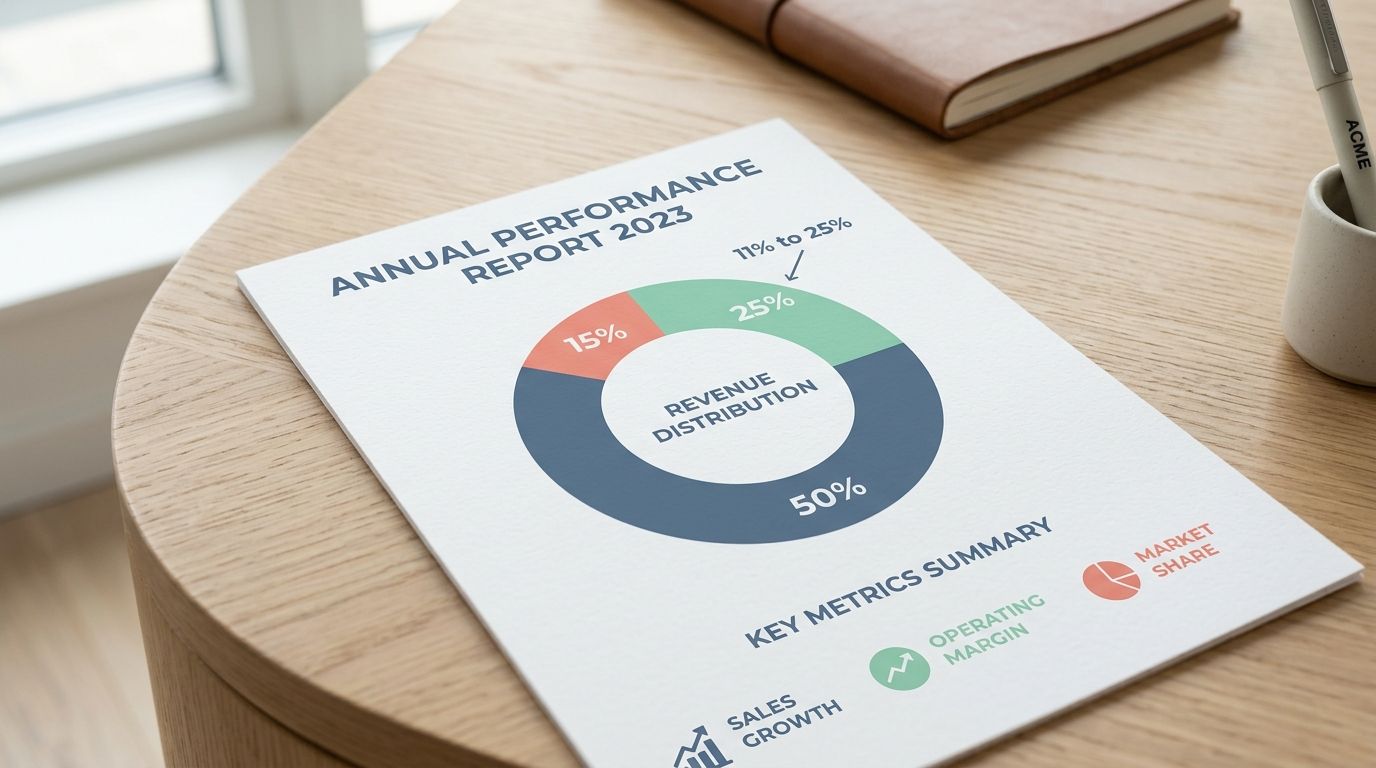
The 2025 Mavvrik and Benchmarkit research found that only 15% of companies forecast AI costs within plus or minus 10%. A majority missed by 11% to 25%, and nearly one in four missed by more than 50%. That tells me monthly showback is too slow unless I also add alerts and weekly review points.
- Send a short monthly showback packet to product, engineering, and finance.
- Include cost per request, cost per workflow, and top spend drivers.
- Flag anomalies tied to a release date, new model, or prompt change.
- Track tag coverage so missing ownership stands out right away.
- Ask product owners to review AI spend during roadmap planning, not after launch.
A useful showback report should feel like a decision memo, not a billing dump. I also like a simple operating cadence: daily alerts for spikes, weekly reviews for trend changes, and a monthly close packet for finance. That rhythm helps teams see the cost before it turns into a budget problem.
Transitioning from Showback to Chargeback
The move from showback to chargeback should feel boring. If it feels dramatic, the model is probably still too weak.
Refine cost attribution models
I start with direct costs, then layer in shared costs only after ownership is credible. That means one team owns a dedicated workload, while multi-tenant platforms get allocated by actual tenant or workload consumption.
Google Cloud’s chargeback guidance gives a rule I like: allocate usage in the same way the service is billed. That keeps the model easier to explain, and it keeps incentives aligned. If storage is billed as storage, access, and network, I do not mash those into one fuzzy number.
For multi-cloud programs, I also pay attention to FOCUS, the FinOps Open Cost and Usage Specification. Version 1.4 was ratified on June 4, 2026, and it is useful because it normalizes billing data across technology vendors. If you are stitching together AWS, Azure, SaaS, and AI provider data, a FOCUS-aligned dataset can save a lot of cleanup work.
- Start with direct costs that map cleanly to one owner.
- Define a written rule for shared cost, such as percentage split, tenant usage, or reserved capacity consumption.
- Test a shadow chargeback cycle before posting live charges.
- Review disputes and fix the model before finance close depends on it.
The most overlooked step, in my experience, is documenting what stays centralized. Some costs should remain visible through showback even when direct AI usage moves into chargeback.
Automate chargeback processes
Manual chargeback breaks down once AI traffic spans more than one cloud account, more than one provider, or more than one billing system.
AWS Billing Conductor is worth knowing if you need internal cloud chargeback on AWS. It creates a second, pro forma view of cost data, which lets teams forecast and report against pricing rules that match your internal financial structure instead of raw provider billing alone.
| Tool or capability | What it helps me do | Best use case |
| AWS Billing Conductor | Create pro forma cost views, budgets, and reports for internal billing groups | AWS-heavy chargeback programs |
| Azure cost allocation | Reassign shared costs across subscriptions, resource groups, or tags | Azure shared-service showback before finance posting |
| Kong Konnect Metering and Billing | Meter token usage and compute cost with dimensional breakdowns | API and LLM usage-based allocation |
I automate three outputs together: the engineering dashboard, the finance-ready chargeback file, and the exception list. If one of those stays manual, month-end turns into a cleanup project.
- Run one or two shadow cycles first.
- Freeze the pricing inputs for the close window.
- Export a chargeback file by cost center, business unit, or tenant.
- Route disputes into a small review queue with clear SLA ownership.
- Post live charges only after the dispute pattern becomes predictable.
That is how I keep the chargeback process accurate without slowing down the close.
Best Practices for Allocating AI Spend
The best cost allocation model is the one teams understand well enough to trust and improve. Fancy logic loses value if nobody can explain the result.
Use FinOps tools for cost tracking
I use FinOps tools that can join cloud cost, AI provider usage, and shared platform overhead in one view. That matters because the FinOps Foundation now treats modern FinOps as broader than public cloud alone, spanning SaaS, licensing, data centers, and other technology spend.
For multi-source environments, I like normalizing the data structure early. FOCUS is helpful here because it gives a common language for cost and usage fields instead of forcing every team to decode each vendor’s export from scratch.
- Standardize fields like owner, product, environment, model, provider, and tenant.
- Keep tag values short and consistent so Finance and Engineering read the same labels.
- Store both raw provider data and normalized reporting data.
- Track unallocated cost as a visible bucket instead of hiding it in averages.
If I cannot group the bill by owner and use case, I do not yet have workable chargeback reporting. Tools should shorten the path from raw usage data to a decision. If they only produce prettier charts, they are not helping enough.
Align allocation models with business goals
I never build a chargeback model in isolation from pricing, margin, or product strategy. AI spend needs to connect to business value.
That is why I like unit-economics metrics such as cost per inference, cost per workflow, and cost to serve. They tell me whether a feature is healthy, which customers are expensive to support, and where I need entitlement limits or model routing changes.
| Allocation method | Best fit | Common mistake |
| Direct attribution by tag | Dedicated workloads owned by one team | Missing tags create silent central-cost buckets |
| Tenant or workload consumption | Shared AI platforms and internal gateways | Using headcount instead of actual usage |
| Fixed shared-cost split | Support overhead and platform operations | Applying it to variable inference costs teams can control |
When the allocation method matches the way the service is consumed, teams make better design choices. That is the real point of accountability.
Benefits of Using Showback and Chargeback
I like showback because it makes cost visible early. I like chargeback because it gives that visibility enough weight to change behavior.
Increased cost transparency
Better transparency means more than seeing a bigger dashboard. It means I can explain spend by business unit, product, feature, customer, model, and workflow without guessing.
The FinOps Foundation now includes the Allocation Accuracy Index, or AAI, as a KPI for how much infrastructure cost is directly and accurately attributed to the right owner. That is a smart target because better allocation accuracy improves budgeting, forecasting, and trust in both showback and chargeback.
- Which team drove the spike?
- Which model made the feature expensive?
- Which tenant or customer segment costs the most to serve?
- Which shared services still sit in an unallocated bucket?
When I can answer those questions quickly, cost management stops being reactive and starts becoming operational.
Improved accountability for AI resource use
Accountability matters most when AI usage is volatile. A 2026 study from researchers at Stanford and MIT found that agentic tasks can consume 1000 times more tokens than code chat, and the same task can vary by as much as 30 times in total token use from one run to another.
That finding is a strong reason to set budget guardrails at the workflow level, not just the monthly team level. If a single agent run can swing that much, I want caps, routing rules, and retry controls before the bill gets posted.
Accountability is not punishment. It is a clear line between a model decision and a budget outcome. Once teams can see those swings in a showback report and feel them in a chargeback model, wasteful prompts, oversized models, and endless retries usually get cleaned up much faster.
Wrapping Up
AI bills do not behave like old software bills. Input tokens, output tokens, cache behavior, retries, and GPU time all move differently, so rough averages stop working fast.
That is why I keep showback and chargeback practical. I tag every AI call, separate the true cost drivers, and push the numbers into reports people can act on.
Showback comes first. It gives teams visibility, exposes gaps in the allocation model, and helps finance and engineering agree on ownership before the close depends on it.
Then I move to chargeback, but only after the rules are stable, shared costs are documented, and the reporting is automated enough to survive month-end. If you do that well, AI spend becomes measurable, defensible, and much easier to control.
Frequently Asked Questions on AI Showback and Chargeback
1. What are showback and chargeback for AI spend?
Showback reports AI costs to teams. Chargeback bills teams for the resources they use. Both rely on a Dashboard (computing) and Tag (metadata), to give Visibility and drive Transparency (behavior).
2. How do I tag AI costs for fair allocation?
Add Tag (metadata) to projects, AI models, data stores, and compute. Use those tags in billing so costs map to the right team.
3. Where do I view AI spend and trends?
On a Dashboard (computing) that shows cost by tag, team, and project.
4. Will showback or chargeback change team behavior?
Yes, Visibility and Transparency (behavior) make costs real, and teams cut waste. Think of it like a mirror, it helps find leaks so people can fix them.