
Maybe you quit at one boss, or a game got oddly easy after you died a few times. Now you wonder if the game is quietly adjusting to you. The plain answer starts with game difficulty balancing: studios track where players win, fail, retry, and quit, and then they make levels easier or harder.
Some games change the challenge live, while you play, based on how you are doing. Others stay fixed for everyone, and the studio ships changes only after it tests two versions on two groups of players. That second kind uses data from many players, so the game is not reacting to you alone.
This guide follows that data from start to finish. You will learn the main numbers studios watch and how they turn into real changes. You will also see measured results and decide for yourself whether this is fair to players.
Why Game Difficulty Balancing Matters to Studios
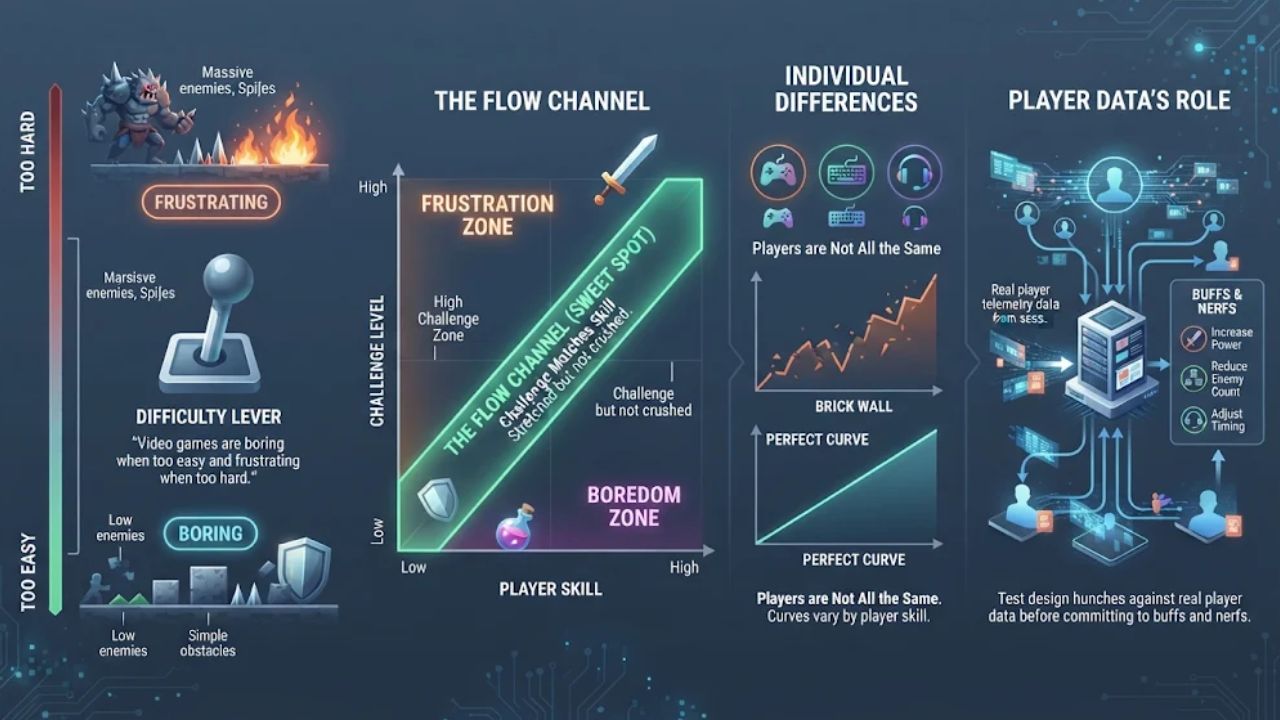
One early research paper on this topic put the problem in one line: “Video games are boring when they are too easy and frustrating when they are too hard.” Every studio fights that problem, whether it makes a huge action game or a small puzzle app.
Researchers at Columbia Business School call difficulty one of the biggest levers a studio has. They say it “regulates the user’s ability to progress within the game.” In plain words, difficulty decides how far you get and how fast.
Designers have a name for the sweet spot. They call it the flow channel. In the flow channel, the challenge matches your skill, so you feel stretched but not crushed.
Games like Dark Souls, Celeste, and Hades all chase this feeling in their own way. The hard part is that players are not all the same. A curve that feels perfect to one player can feel like a brick wall to another.
Player data helps here. It lets studios test their design hunches against what real players do before they commit to buffs and nerfs.
What Player Data Do Game Studios Collect?
The data starts simply. Studios log each time a player starts a stage and how it ends: a win, a loss, or a quit. That record shows how real players behave and how they react when difficulty changes.
Mobile publisher SayGames lists the numbers it watches most: “fail rate, churn, number of attempts, booster usage, rewarded ad views.” Other guides add progression data, purchase trends, and session length.
Each number is a clue, not a final answer. Here is what each one can hint at, and the kind of change it might lead to.
| Metric | What It Can Hint At | Common Change It Leads To |
| Fail rate | The share of tries that end in a loss. A sudden jump may point to a wall, but it could also point to a bug or an unclear rule. | Look closer, then nerf the level, add help, or move it in the curve |
| Win rate | The share of tries that end in a win. A very high rate can mean a level is too easy to feel fun. | Buff the challenge, or keep it as a breather between hard levels |
| Number of attempts | How many tries players need to clear it. Many retries can mean healthy challenge or real frustration. | Smooth out the hardest part, or add a checkpoint or hint |
| Churn (quits) | Where players stop playing. A cluster of quits on one level is a warning sign worth checking. | Look closely at that level and the ones around it |
| Booster usage | How often players use a power-up. Heavy use may mean a level is tough, or players may just like boosters or have spare ones. | Check other numbers first, then ease the level or keep the booster as part of the plan |
| Rewarded ad views | How often players watch an ad for an extra move or life. It can show where players feel stuck enough to trade time for help. | Adjust the level, or place the ad offer where it truly helps |
| Session length and progression | How long players stay and how far they get. | Change the pace of the difficulty curve |
| Purchase trends | Where players spend money. | Should be handled with care (see the fairness section below) |
Why Churn Can Fool You
Churn sounds like the scariest number on the list. But SayGames warns: “What looks like churn can simply be a pause.” A player who stops for a week may come back tomorrow.
So a dip in play is not always a quit. If a studio nerfs a level every time churn ticks up, it can wreck a good level for no reason. Smart teams check whether players return before they react.
How Many Levels Studios Test
Mobile publishers usually launch with 100 levels. They double that to 200 when they check whether players stick around to day 14 and beyond (D14+ retention).
That matters for tuning. You can only learn how a long difficulty curve feels if enough levels exist to test it. Studios also watch day one, day seven, and day thirty retention to see if players keep coming back.
Some general health numbers, like crash rates, also affect whether players stay. Those numbers point to bugs, not to difficulty, so designers keep them separate.
How Studios Turn Player Data Into Difficulty Changes
Numbers alone do not fix a level. Here is how a studio gets from a spreadsheet to a real buff or nerf.
- Start with a guess, then test it. A designer might think a level is too hard. SayGames says “Every hypothesis must go through data – A/B tests, experiments, analytics.”
Its team puts it even more bluntly: “Nobody knows anything. Only testing gives you answers.” - Ship early and collect real play. Instead of polishing a level in secret, the studio puts it in front of players fast. Then it watches fail rate, attempts, churn, booster use, and ad views.
- Find the spike. The team looks for levels where the numbers jump. For example, say most players clear a level in a few tries.
But the next level suddenly causes far more fails and quits. That jump marks a spot to study. It does not tell you the cause yet. - Find the reason. The numbers say where players struggle, not why. So the team watches playtests, reads feedback, and checks for bugs before it picks a fix.
- Pick the lever. Difficulty is more than enemy health. Robin Hunicke’s research system, Hamlet, worked by adjusting “the supply and demand of game inventory.”
That means it changed how many items like health and ammo the player had, and how much the game demanded from them. Designers can tune enemy count, item drops, time limits, or move limits in the same way. - Aim for a close win. Many studios do not want every level to be easy. They want some levels to end in a “close win,” which SayGames says “Strengthens the feeling of reward” and “Makes the experience more dramatic.”
A level you barely beat often feels better than one you crush. - Compare against a control group. The new version goes to one group of players, and the old version goes to another. If the new version keeps more players without hurting the fun, it wins. Still, a better retention number alone does not prove a level is more fun. Teams pair it with player feedback.
- Decide: live or fixed. Some changes go out as a fixed update that everyone gets. Others become rules that react to each player in real time.
That second path is called DDA, which means the game adjusts difficulty on the fly.
A Worked Example
Here is a made-up case to show the full loop. Say one boss level has far more fails, more retries, and more players who never come back than the levels around it.
The team runs playtests and sees that players miss the boss’s big attack. The warning sign is too quick and hard to read. So the studio tests a longer warning against the original.
Then it checks how many players finish the level, how many return the next day, and what they say about the fight. If all three improve, the longer warning ships to everyone.
Live Adjustment vs. Fixed Tuning
This is the key split to understand. In fixed tuning, the studio studies data from many players, then ships one new version of the level. Everyone gets the same game, and it does not change based on how you alone play.
In DDA, the game watches you and shifts as you play. In Resident Evil 4, “Missing shots and repeatedly dying will lower your difficulty rank.” In Left 4 Dead, an AI called the Director “spawns items and enemies based on your team’s performance.”
DDA systems come in two main types. Some follow set rules that designers write. Others use machine learning to learn from player actions and make more personal changes.
One more note. Some games, like The Witcher 3 and Skyrim, scale enemies to your character level. That follows your level number, not how well you play, so it is not the same as DDA.
Real Examples: What Happened When Studios Tuned Difficulty With Data
Here are five real cases. Some change the game live, while others use data to ship better fixed levels. This table compares how each system works.
| Case | Type | What It Watched | What It Changed |
| Columbia Business School study | Live, personal adjustment tested against a random holdout group | Player behavior, to spot players at risk of leaving | Made the game easier for at-risk players |
| SayGames puzzle games | Fixed tuning backed by A/B tests | Fail rate, churn, attempts, booster use, ad views | Level difficulty and level order |
| Hamlet (research) | Live DDA | The player’s need for items like health and ammo | The supply and demand of game inventory |
| Resident Evil 4 | Live DDA, hidden rank | Missed shots and deaths | A hidden difficulty rank |
| Left 4 Dead | Live DDA, the AI Director | The team’s performance | Which items and enemies spawn |
Columbia’s 300,000-Player Test
This is the clearest measured result we have. Researchers tracked over 300,000 players for 12 weeks. They changed the game’s difficulty on purpose and compared the results to a fully random holdout group.
Making the game easier for at-risk players raised playtime, retention, and spending. Revenue rose by up to 79% from purchases and 21% from ads.
These numbers come from one study. They do not promise that every game will see the same gains. Still, the lesson is clear: players who are about to quit often do not need a harder game, but a way past the wall.
SayGames’ Level Tuning
SayGames makes hybrid puzzle games. It ships levels early, watches real play, and runs tests before it changes anything.
The company’s in-app purchase revenue grew 140% over two years, from $3.53M to $8.49M. Growth was 75.4% from May 2024 to May 2025 and 37.2% from May 2025 to May 2026.
A fair warning: those numbers cover the whole business. They cannot show that difficulty tuning caused any of that growth. The useful part here is the process, not the revenue.
Hamlet: An Early DDA Research System
Hamlet was a DDA system that Robin Hunicke built on Valve’s Half-Life engine. Her 2005 paper is a key early study of difficulty that adapts to the player.
The big idea was to manage the inventory, not just make enemies weaker. Hamlet adjusted “the supply and demand of game inventory” to control how hard the game felt. If you were running low on health, the game could quietly help, and if you had plenty, it could raise the stakes.
Resident Evil 4’s Hidden Rank
Resident Evil 4 may be the most famous case of adaptive difficulty in a game. It keeps a hidden rank that you never see on screen.
“Missing shots and repeatedly dying will lower your difficulty rank.” So if you struggle, the game eases off behind the scenes. The rank is an inside setting, so you feel its effect in play rather than seeing a number.
Left 4 Dead’s AI Director
Left 4 Dead uses The Director, “an artificial intelligence that spawns items and enemies based on your team’s performance.” It is a co-op version of the same idea.
Because it controls spawns, it can shape both pressure and recovery. More enemies raise the pressure, while well-timed supplies give a team room to recover. Each run can feel different because the Director keeps reading the team.
What Players and Studios Gain From Data-Driven Difficulty
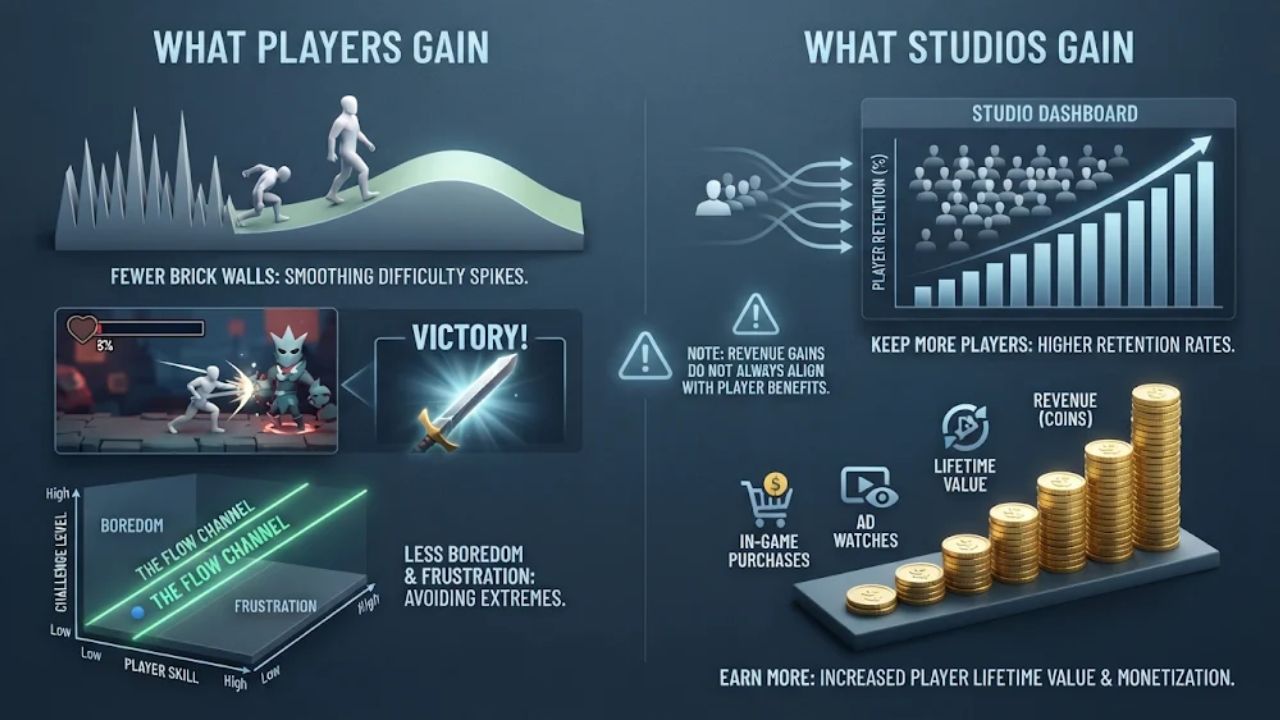
When it is done well, data-driven difficulty helps both sides. But the gains are not always equal.
What Players Gain
Fewer brick walls. Data shows where most players get stuck, so designers can find and smooth out spikes that nobody meant to put there.
Better moments, too. Tuning for a “close win” can make a level feel more rewarding and more dramatic. That is a goal that serves fun, not just numbers.
And less boredom. The core problem is that games are “boring when they are too easy and frustrating when they are too hard.” Good data helps designers avoid both.
What Studios Gain
Studios can keep more players and earn more, as the Columbia study showed. Players who stay longer have more chances to buy items or watch ads.
This is where the gains can split. What helps a studio’s revenue does not always help the player, which is why the next section matters.
Is Data-Driven Difficulty Fair? Privacy, Spending, and Over-Reliance
The hard question is simple: who is the tuning really for? Fairness has a few separate parts, so it helps to judge each one on its own.
- Pressure to spend. The Columbia results show that easier play for at-risk players raised spending. That alone does not prove anyone was tricked, since players may simply have enjoyed the game more.
But a studio could also tune a level to be just hard enough that boosters or ad views feel needed. At that point, difficulty serves revenue first and players second. - Control and disclosure. Resident Evil 4’s rank is hidden. Some players may like that because it feels smooth.
Others may feel let down when they learn the game was helping them. A fair game can still use hidden help, but telling players about it, or letting them switch it off, gives them more control. - A steady, promised challenge. Some players pick a game because it promises one fixed test of skill. Adaptive difficulty can be fair and still feel wrong to those players, so studios should be clear about what they offer.
- Privacy. Studios collect a lot of player data every day, and laws like GDPR and CCPA govern how they handle it. Fair studios explain what they collect and ask for real consent.
They also gather only what they need for balancing. - Misreading the numbers. Data can mislead. “What looks like churn can simply be a pause.” A team that trusts raw churn too much may nerf a great level for no reason.
- Over-reliance on systems. Data tells you what players do, not why. “Nobody knows anything. Only testing gives you answers.”
Good testing still needs real playtests and a designer’s judgment. - Fixed difficulty with player choice. Games like Cuphead and Hollow Knight show another path. They pair fixed difficulty curves with player choice instead of making constant system changes.
A win there is earned in a different way, not a better one. A player who beats an adaptive game earned that win too.
A Quick Fairness Check
As a player, ask a few questions. Does the game get easier only when a store pops up? Do the hardest levels sit right before a paid booster offer?
A yes is a reason to look closer, not proof of a trick. Bad timing can also come from plain design choices.
As a designer, ask the reverse. Would you make this change if it earned nothing? If the answer is yes, you are probably tuning for fun.
Final Thoughts
Game difficulty balancing comes down to following the data. Studios watch fail rate, churn, attempts, booster use, and rewarded ad views. Then they buff, nerf, or reorder levels, either in fixed updates or through live systems that react to each player.
The results can be real. In Columbia’s test, easing the game for at-risk players raised playtime, retention, and spending. Studios still have to decide whether those gains serve the player or mainly the business.
If you play, watch for the signs of tuning and judge whether they help you have fun. If you design, track the numbers, but test before you trust them. Keep in mind that a pause is not always a quit, and that a close win usually feels better than an easy one.
Frequently Asked Questions About Game Difficulty Balancing
1. How do game studios use player data to balance difficulty?
Studios track where players die, quit, or get stuck, then adjust those spots until the game feels fair. GDC’s annual State of the Game Industry report confirms this data-driven approach is now standard practice across studios of all sizes.
2. What kind of player data do studios collect?
Studios log deaths, playtime, retries, and in-game economy activity like how players earn and spend coins or gems. Some teams now use generative AI tools to process this data faster.
3. Do game developers talk about this at GDC?
Yes, GDC hosts talks on playtests, data, and difficulty design every year. The organization also publishes the State of the Game Industry report, which documents how studios approach game development today.
4. Which games show good difficulty design?
Super Mario Bros. is the classic example, introducing each new mechanic in a safe, low-stakes space before the player faces a real challenge with it. That “teach first, test second” structure is now a foundational principle in modern level design.
5. How does a metagame help players who struggle?
A metagame gives players goals that carry over between runs, so progress feels continuous even after a loss. In Rogue Legacy, you keep the gold from each run and spend it on upgrades that make future attempts easier.
6. Which experts write about game balance and fairness?
David Sirlin’s “Playing to Win” is one of the most cited texts on competitive balance and fairness in game design. His framework on optimal play has directly shaped how developers think about skill curves and difficulty tuning.