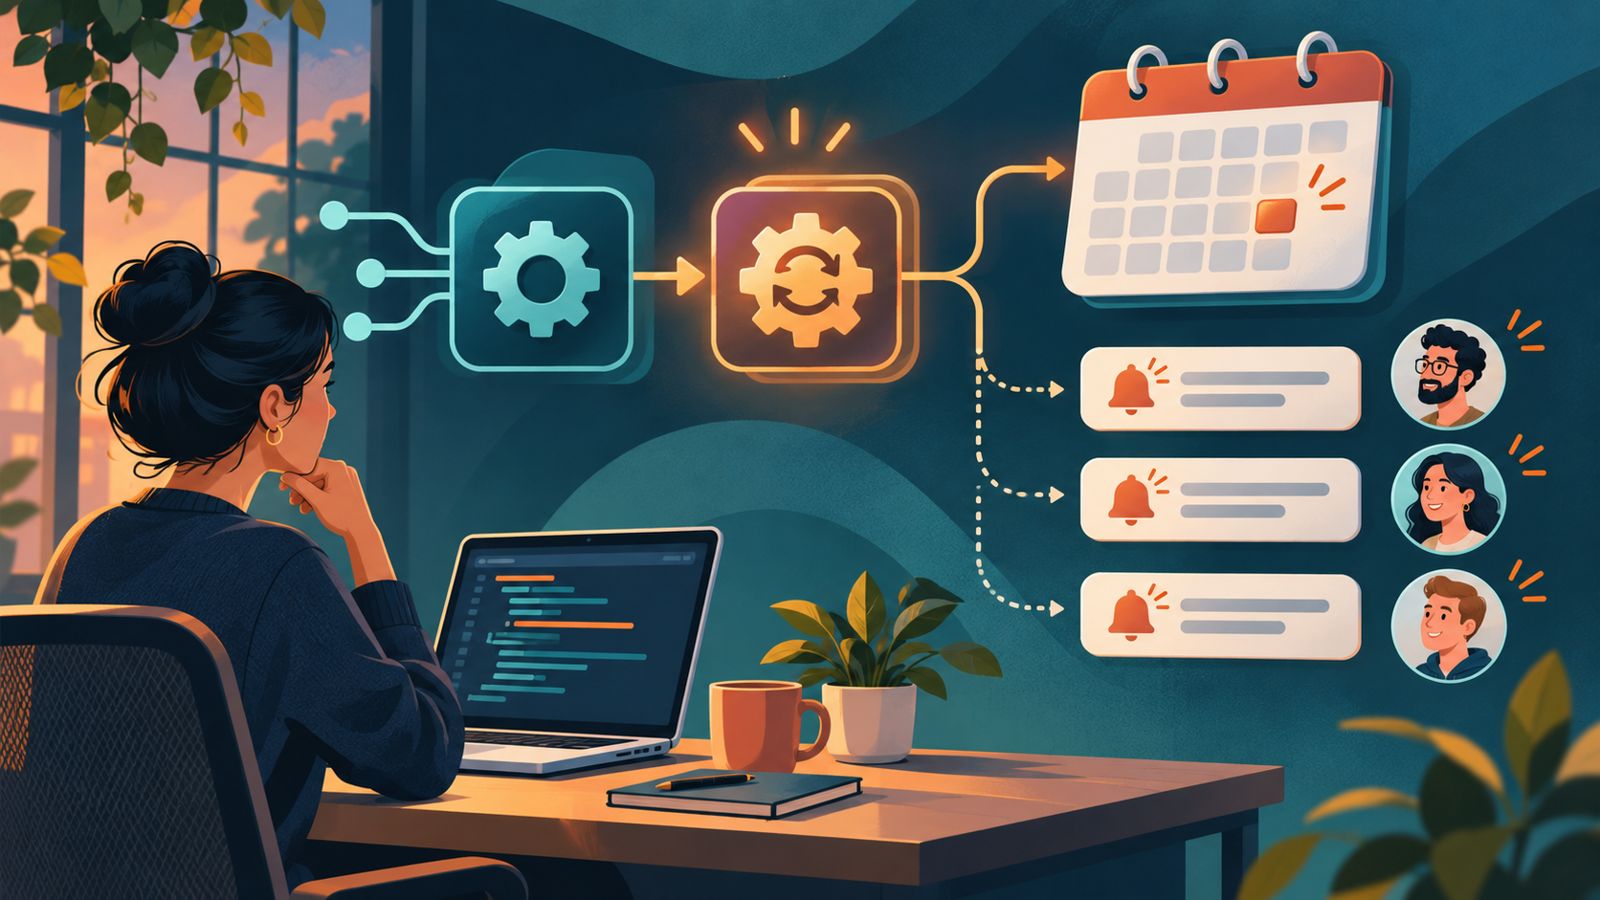

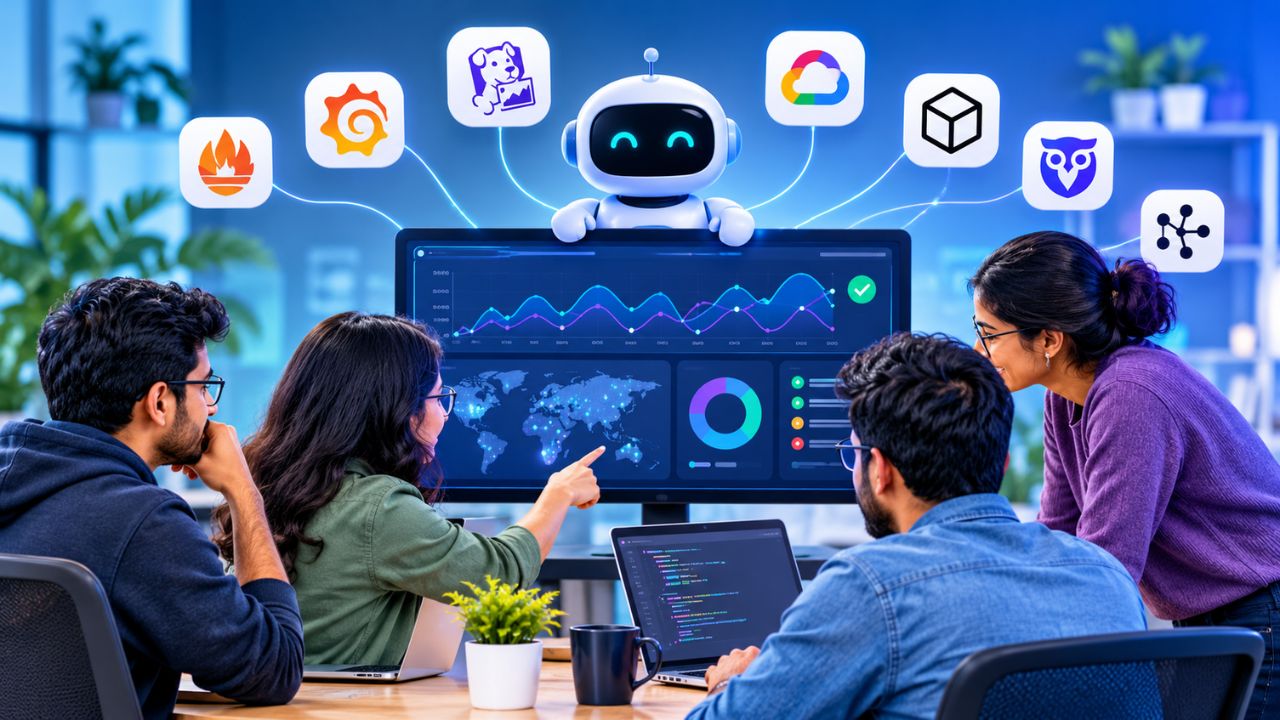
AI agent observability tools help a small SaaS engineering team see what happened between a customer request and an answer: which model ran, which tool was called, where time was spent and where an error appeared. A trace is a starting point for investigation, not proof that an answer is correct or that a customer’s task was completed.
This research-based comparison looks at documented tracing and related evaluation features, not hands-on testing or a ranking. The eight options serve different workflows, from AI-focused trace review to broader application monitoring. Instrumentation coverage, retention, privacy controls, deployment and charges depend on the configuration and plan; check them against your own workload before choosing.
AI agent observability tools compared
| Tool | Useful starting point | Decision that remains |
|---|---|---|
| LangSmith | Agent run tracing and evaluation | Confirm framework coverage and data handling |
| Langfuse | Observations, traces and sessions | Choose hosting and set capture limits |
| Arize Phoenix | OpenTelemetry and OpenInference tracing | Own deployment and instrumentation |
| Braintrust | Connected agent spans and evaluation workflows | Instrument custom steps and define scoring |
| Datadog | Agent traces alongside broader operations | Model usage and telemetry costs |
| Sentry | AI spans and errors in developer workflows | Verify your SDK’s agent coverage |
| Pydantic Logfire | Structured traces for instrumented applications | Check supported integrations and retention |
| Helicone | Observability around model requests | Check how non-model tool calls are captured |
1. LangSmith: trace runs and turn failures into tests
LangSmith documents tracing for agent applications and online evaluators that inspect production traces. For a team using LangChain or LangGraph, that makes it a useful place to follow a request through supported steps and select problematic runs for further review. It also supports evaluation workflows, so a failure found in production can inform a repeatable test.
Check what is captured by your actual framework and add instrumentation for application-specific steps. Decide which prompts, tool arguments and responses may be retained before enabling traces on real customer traffic. A model-based evaluator can help prioritize review, but its judgment needs calibration against human-labeled examples.
2. Langfuse: organize observations into traces and sessions
Langfuse describes individual observations grouped into traces, with traces optionally grouped into sessions. A small team can use that hierarchy to follow a single request and then inspect the surrounding conversation. It is a candidate when engineers want AI-oriented traces and a choice of operating arrangements.
Choose deliberately between a managed service and operating your own installation. Hosting, backups and upgrades take time even when software is available for self-hosting. Add the relevant business identifiers without recording secrets or unnecessary customer data, and check that a failed external tool call actually appears as a distinct observation.
3. Arize Phoenix: use OpenTelemetry-based instrumentation
Phoenix documents tracing using OpenTelemetry and OpenInference instrumentation. Teams already using those conventions can investigate spans from supported integrations and combine trace review with evaluation. It is worth examining when you want to control a self-managed observability environment and understand the instrumentation layer.
The product can only show what the application sends. Test the chosen framework integration and explicitly instrument custom business logic where necessary. Budget time for storage, access controls and maintenance rather than treating a self-hosted trace viewer as a zero-effort service.
4. Braintrust: connect trace inspection with evaluation
Braintrust describes agent traces as connected spans for model calls, tool invocations and other steps. A team can use a trace to isolate a bad tool response, then turn a representative example into an evaluation for a later version. That link between debugging and repeatable testing is useful when a team ships frequent agent changes.
Automatic instrumentation covers supported integrations, not every custom transformation. Check the boundaries of the trace and log a safe, structured result for application-specific steps. Reviewers must still decide what counts as an acceptable answer and whether an automated score matches the actual customer outcome.
5. Datadog: bring agent traces into a wider operations stack
Datadog Agent Observability represents requests as traces and documents spans for LLM calls, contextual operations and agent workflows. A team already using Datadog for services and infrastructure can investigate an agent issue alongside surrounding operational data, which may help distinguish a model problem from a slow downstream API.
Confirm the SDK and framework support for each part of the workflow and check data retention and ingestion costs for your traffic. A broad platform is not automatically the cheapest or simplest starting point for a small deployment. Make a representative usage estimate, including trace volume and any associated infrastructure telemetry.
6. Sentry: investigate AI activity beside application errors
Sentry documents AI conversation and trace data that can include tool spans, error information and token metrics. For a team already triaging application exceptions in Sentry, it is reasonable to evaluate whether AI traces can be connected to the same debugging process. Start with a failed request and inspect the surrounding recorded spans.
Support varies by SDK and instrumentation. Verify that your agent framework, tool calls and relevant context appear in a test trace rather than assuming the error tracker captures every step. An exception-free trace can still lead to an incorrect answer, so add task-specific evaluations where correctness matters.
7. Pydantic Logfire: instrument application and agent steps
Logfire is an observability product for instrumented applications, and Pydantic documents integrations for AI workflows. A team using Pydantic-based tooling can investigate how a request and its structured data move through a traced application, then correlate the relevant spans with other events.
Before committing, check the exact framework integration, supported language and data-retention terms for your deployment. Decide how to redact model inputs and tool outputs; a convenient trace view can otherwise retain information the team did not intend to collect. Consider the effort of adding custom spans to unsupported operations.
8. Helicone: inspect requests at the model boundary
Helicone is oriented toward observability for LLM requests and related usage. It is useful to investigate when the immediate question is which model calls a workflow made, their latency and token usage, or how requests vary across providers. For a small team, seeing the model boundary can be a practical first step before adding a more extensive trace.
A model-request log is not necessarily an end-to-end record of an agent. Test how your setup captures retrieval, tool calls, retries and downstream results; add instrumentation where those steps are missing. Check proxy or SDK configuration, data handling and supported provider behavior before routing production traffic through any integration.
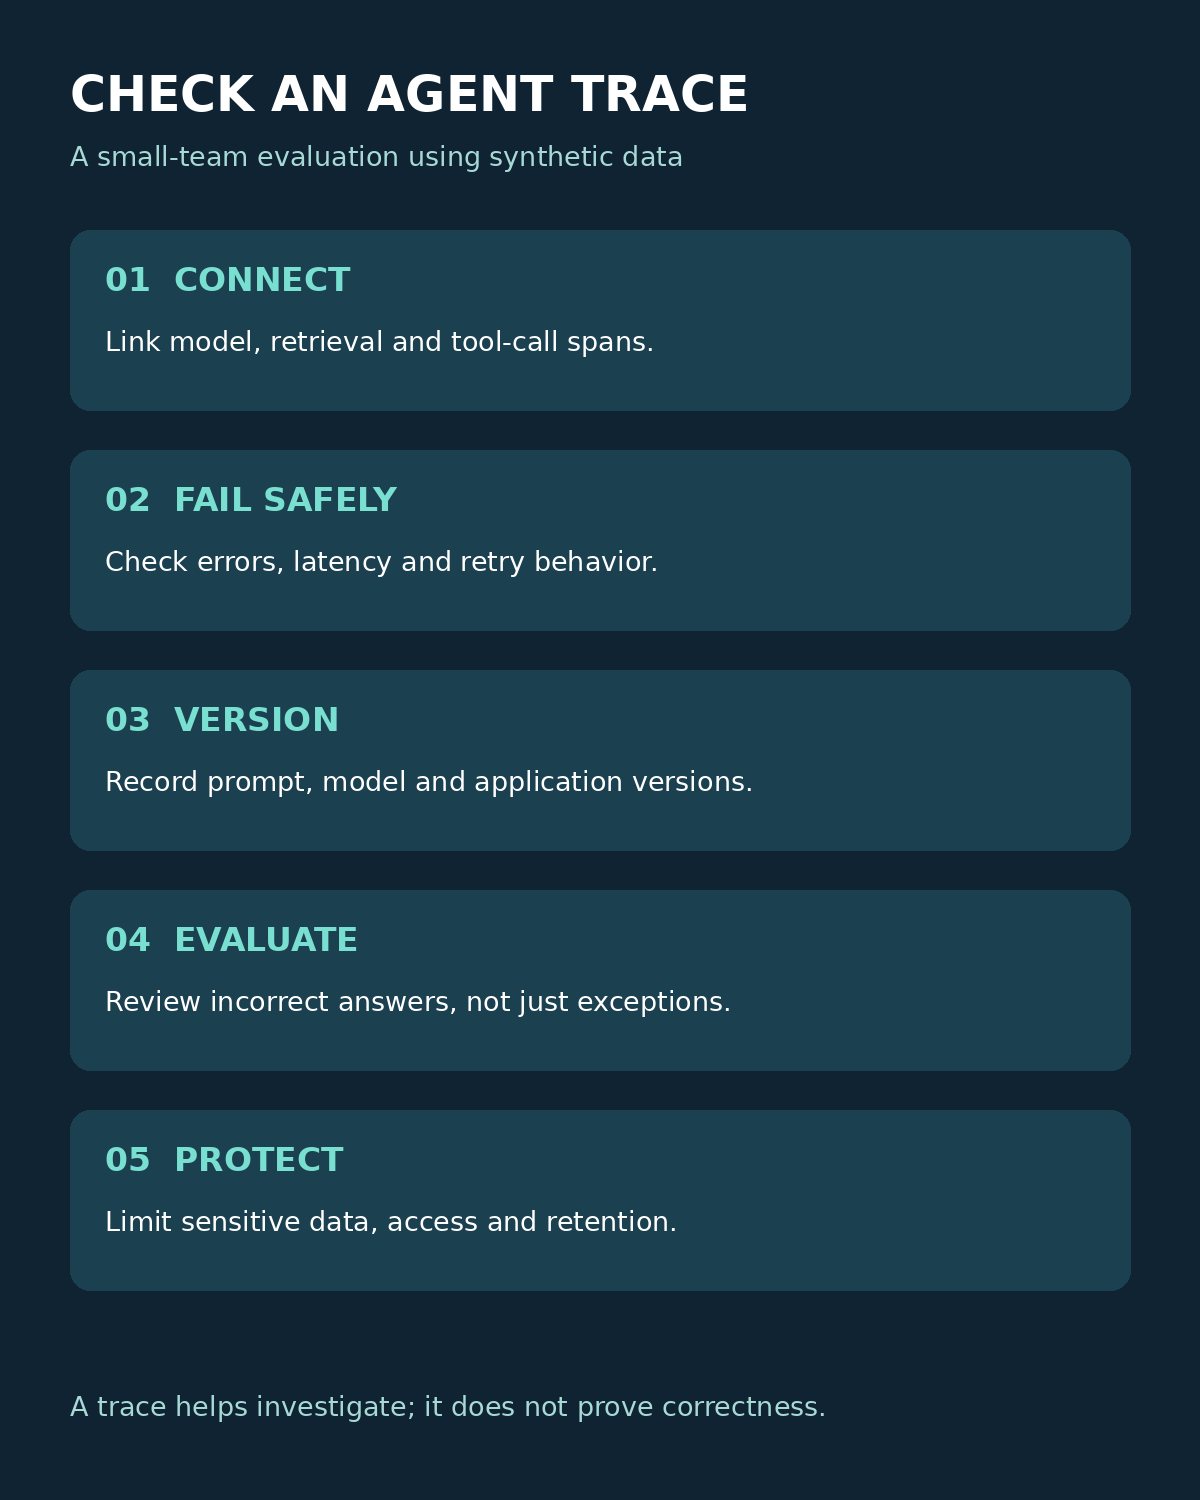
A test plan for AI agent observability tools
Use one representative workflow with synthetic data. For example, ask an agent to retrieve a policy, call a test API and return a summary. Then compare each platform against the same checks:
- Can the team see the model call, retrieval and API tool call as related steps?
- Does a deliberately failed tool call show the error and relevant duration without exposing credentials?
- Can reviewers see the version of the prompt, model and application used?
- Can the team capture an incorrect but successful-looking answer for a repeatable evaluation?
- What data is retained, who can access it and what will the expected volume cost?
Run the test with your own integrations before drawing conclusions; this is a proposed exercise, not a measured result. For a broader view of infrastructure, see Editorialge’s comparison of SaaS monitoring tools. Its discussion of system monitoring complements, rather than replaces, checks for agent behavior.
Choosing an approach
AI agent observability tools are most useful when their captured evidence leads to an owner, a reproducible test and a fix. Start with one instrumented workflow, restrict sensitive data, and choose the system your team can maintain. Expand to more telemetry only after you know which questions the first trace leaves unanswered.