

Most monitoring and observability tools for SaaS look the same in a demo. They all have dashboards, alerts, and a search bar. The real differences show up later: in the bill when traffic grows and in how fast you can find one bad request among millions.
I’m the chief technical advisor at ImagineLab Art, an AI creative platform. Our backend runs on NestJS microservices. Users pay with tokens, and we call several outside AI model providers. One Long Video Lab job moves through script, storyboard, voice-over, scenes, and stitching. When a step stalls, I need three answers fast: which service broke, which provider was slow, and whether the user was charged anyway.
That is the lens I used for this list.
How I Judged These Monitoring and Observability Tools for SaaS
I checked every price on the vendor’s own pricing page in October 2026. Then I scored each tool on five things that matter to a small SaaS team:
- OpenTelemetry support. If a tool accepts OpenTelemetry data, you can switch vendors later without rewriting your code.
- Pricing model. Per-host, per-GB, and per-user pricing behave very differently as you grow.
- A real free tier. Not a 14-day trial.
- AI and LLM tracing. If your product calls AI models, you need to see cost and delay per call.
- Setup time. How long before the first useful alert fires.
One honest note: our cohort and retention analysis at ImagineLab runs as SQL on our own tables, not inside a monitoring tool. Product analytics and system observability are different jobs. Churn and retention signals belong with your product data and your email tools for SaaS lifecycle marketing, not in an error dashboard.
The 9 Best Monitoring and Observability Tools for SaaS in 2026
1. Grafana Cloud: The Best Value in Monitoring and Observability Tools for SaaS
Grafana Cloud has the most useful free tier here. Each month you get 10k metric series, 50 GB of logs, and 50 GB of traces, kept for 14 days. The Pro plan starts at $19 a month plus usage and keeps metrics for 13 months.
It reads OpenTelemetry and Prometheus data natively. For NestJS microservices like ours, one standard library can feed metrics, logs, and traces into the same place. It now also has an Agent Observability product for LLM apps, with 30k generations free each month.
The weak spot is effort. Grafana gives you building blocks, not a finished product. Someone has to own the dashboards and alert rules, or they go stale within months.
2. Datadog: The Most Complete of the Monitoring and Observability Tools for SaaS
Datadog covers almost everything: hosts, APM, logs, real user monitoring, security, and LLM tracing.
The pricing is where teams get hurt. Infrastructure Pro is $15 per host per month on annual billing ($18 on demand). APM adds $31 per host. Logs cost $0.10 per GB to ingest, plus $1.70 per million events to index for 15 days. Ten hosts with APM already cost $460 a month before a single log line.
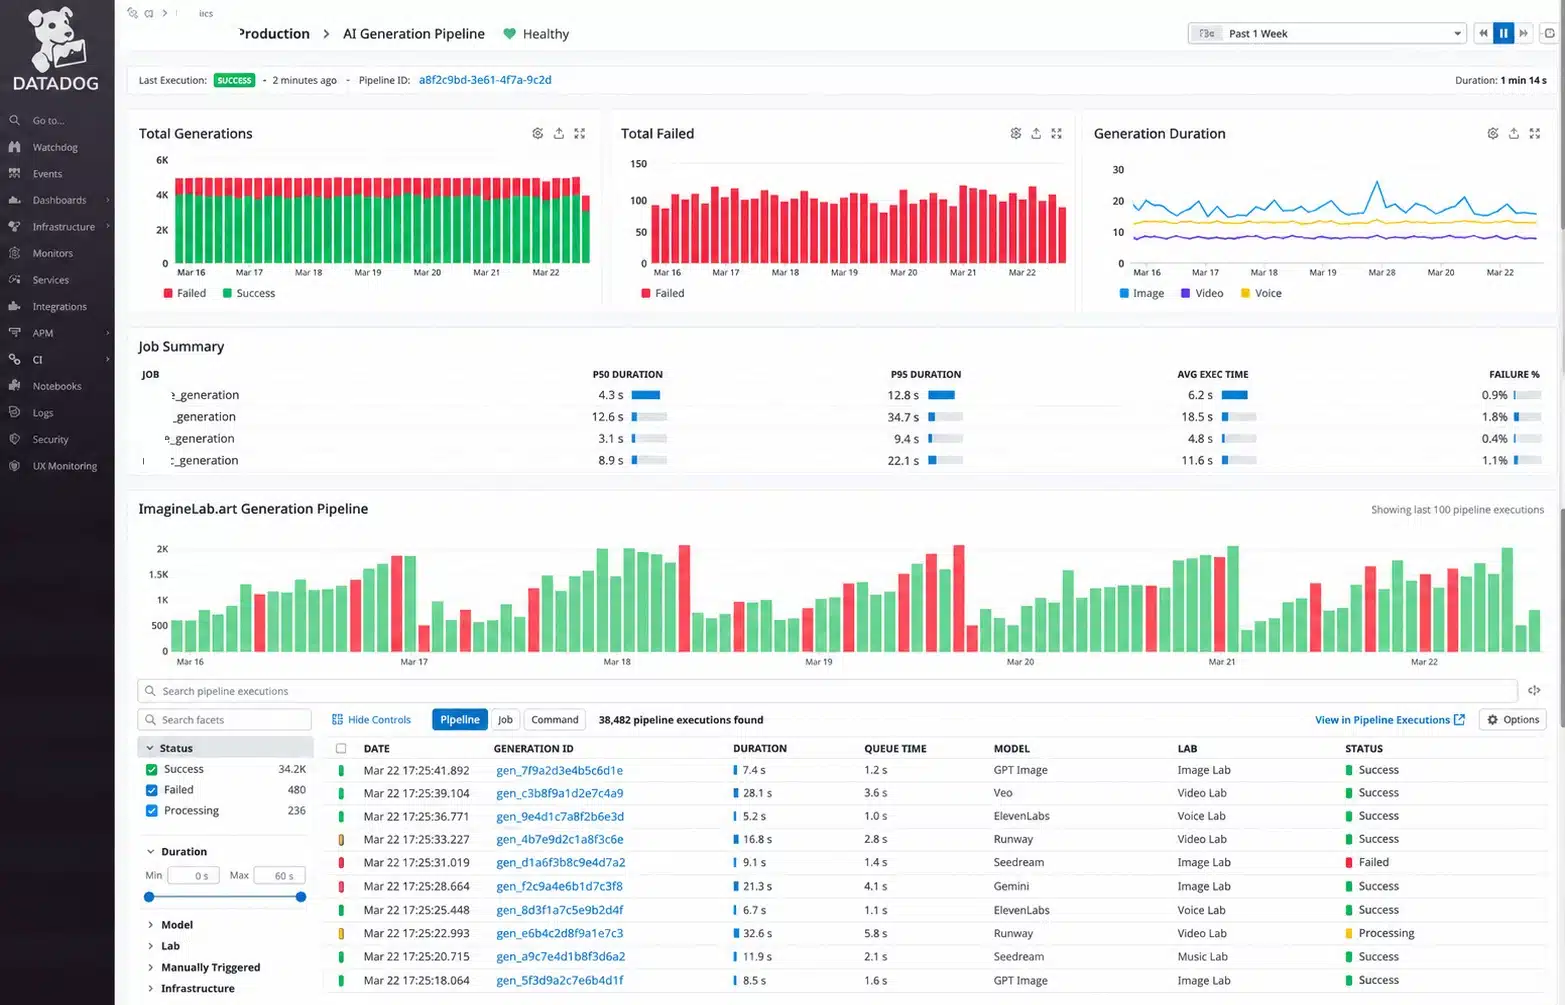
Pick Datadog when engineering time costs more than the bill. Set ingestion limits on day one.
3. Sentry: The Developer-First Choice Among Monitoring and Observability Tools for SaaS
Sentry starts from the error, not the server. It shows the stack trace, the release that caused it, and the user who hit it.
- Free Developer plan: 1 user, 5k errors, 5M spans
- Team: $26 a month billed annually, 50k errors, unlimited users
- Business: $80 a month billed annually
It also includes agent tracing for AI workflows. Sentry won’t watch your servers, though. Pair it with Grafana Cloud or Better Stack.
4. Better Stack: The Fastest Setup of All Monitoring and Observability Tools for SaaS
Better Stack is the tool I’d hand a two-person team. Uptime checks, phone-call alerts, on-call schedules, and a public status page all live in one account.
The free plan gives 10 monitors and heartbeats, one status page, 100k exceptions, and 3 GB of logs. Paid plans start at $29 per responder per month on annual billing. Telemetry bundles start at $25 a month (annual) for 40 GB each of logs, traces, and metrics.
Heartbeat checks matter for token-billed products. A silent failure in a scheduled billing job hurts more than a slow page. The free tier’s 3-day log retention is too short for real debugging.
5. New Relic: The Largest Free Data Allowance in Monitoring and Observability Tools for SaaS
New Relic gives 100 GB of free data ingestion every month, one free full platform user, and unlimited basic users. Beyond that, data costs $0.40 per GB. There is no per-host fee.
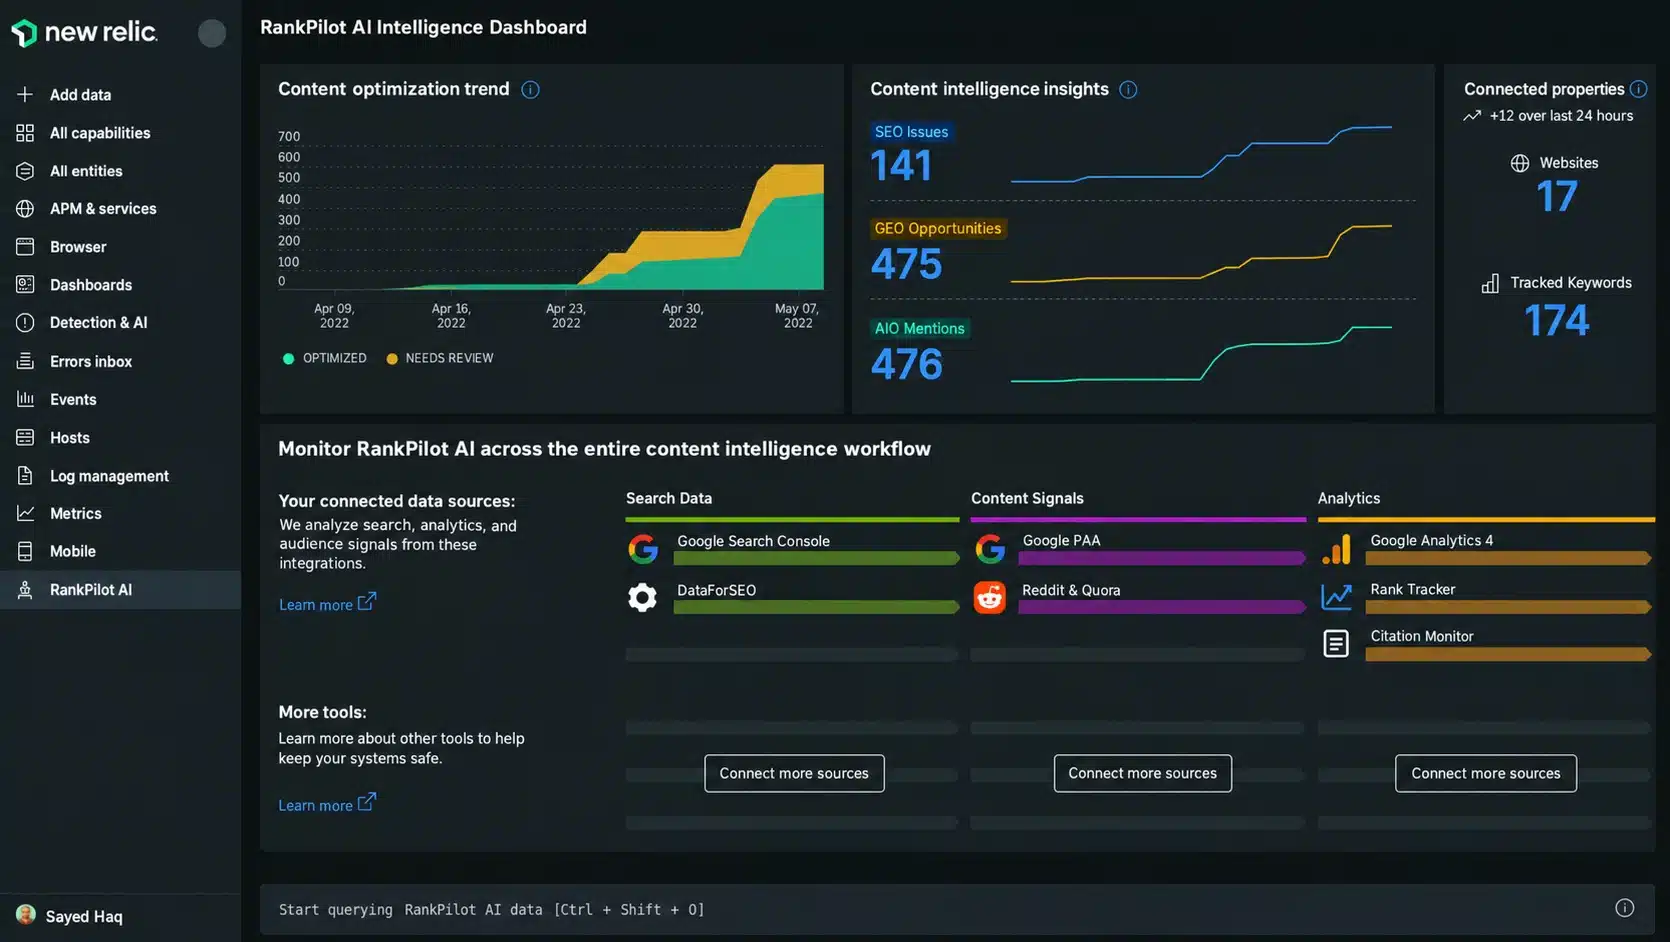
The cost moves to people. On Standard, the first full user is $10, and each extra is $99, capped at five. Pro full users cost $349 each on annual terms. On the free tier, data stops flowing once you pass 100 GB until next month.
6. SigNoz: The Open-Source Pick for Monitoring and Observability Tools for SaaS
SigNoz is built on OpenTelemetry from the ground up. You can self-host the community edition for free. SigNoz Cloud starts at $49 a month, which includes $49 of usage. After that, log and trace costs $0.30 per GB, and metrics cost $0.10 per million samples.
There is no per-user or per-host fee. Eligible startups pay $19 a month for the first year. Self-hosting is free with a license only. You still run, upgrade, and back up the storage yourself.
7. Honeycomb: Deep Debugging With Monitoring and Observability Tools for SaaS
Honeycomb is built for one question: why is this request slow? Its BubbleUp feature compares slow requests to normal ones and shows what is different.
That helps when your data has many unique values. In our case that means fields like model provider, lab name, and plan tier. The free plan covers 20M events a month. Pro starts at $150 a month, with unlimited seats and queries.
8. Langfuse: LLM-Focused Monitoring and Observability Tools for SaaS
Langfuse is not a general monitoring tool. It traces LLM calls: the prompt, the model, the tokens used, the cost, and the delay.
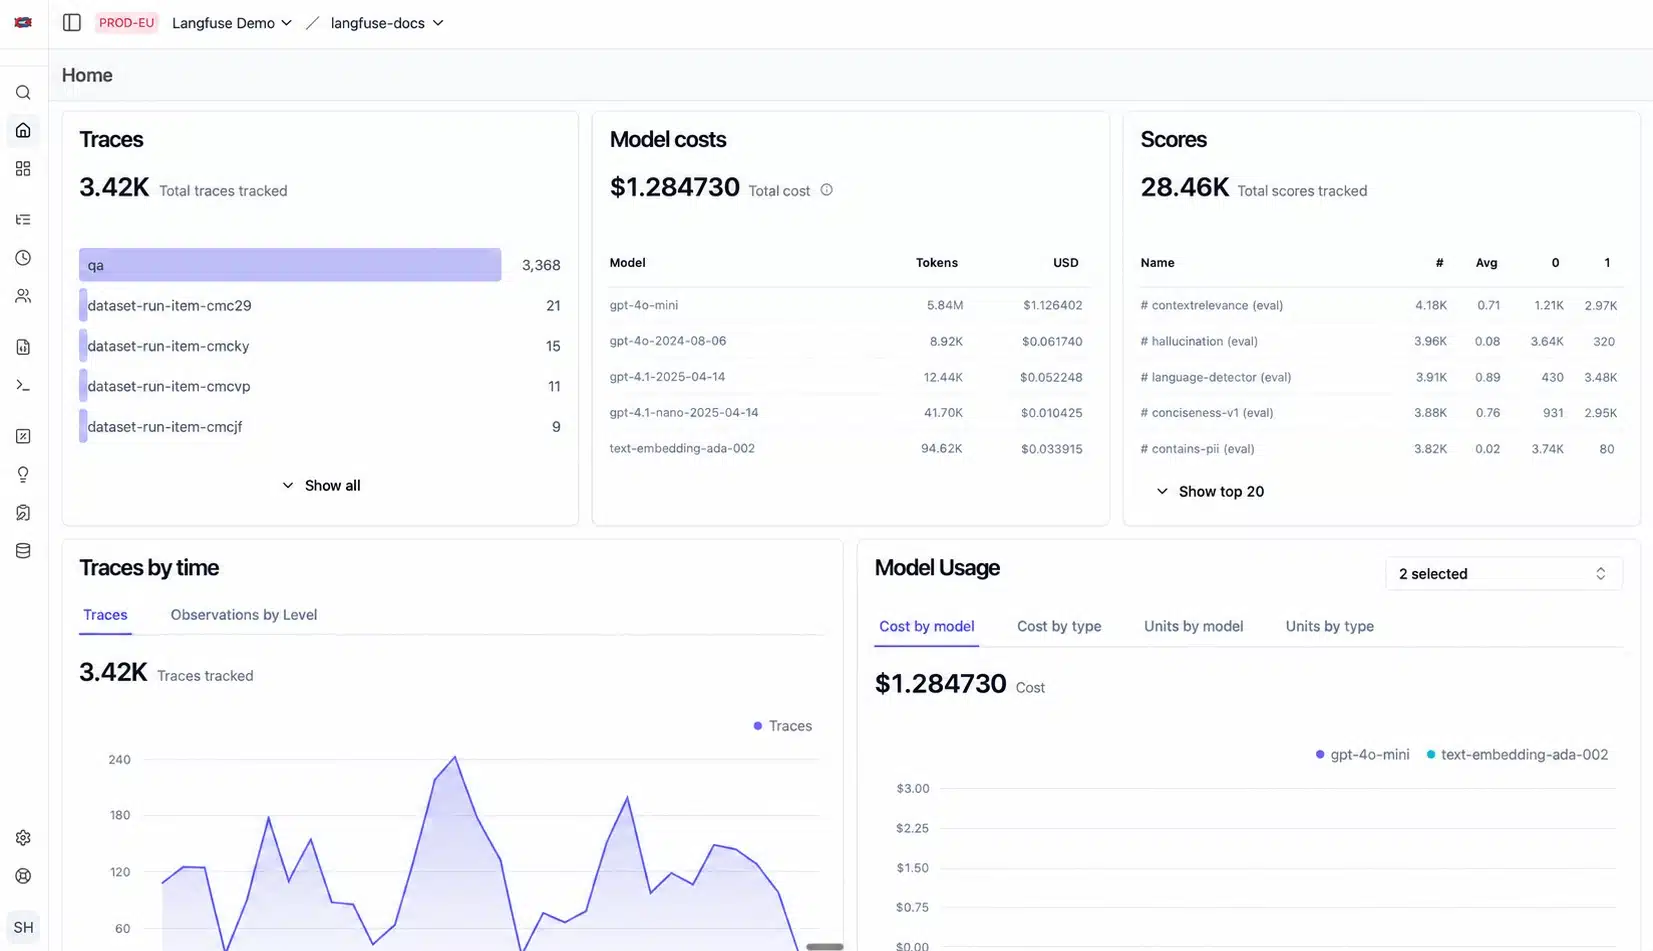
For a product that calls several model providers and bills users in tokens, this is the missing layer. Generic APM shows a slow HTTP call. Langfuse shows which prompt and which model caused it. The Hobby plan is free with 50k units and two users. Core is $29 a month with 100k units, then $8 per extra 100k. It is open source, and it is now part of ClickHouse.
9. Dynatrace: Enterprise-Grade Monitoring and Observability Tools for SaaS
Dynatrace is strong at automatic root-cause analysis across large systems. Full-Stack Monitoring lists at $58 a month per 8 GiB host. Infrastructure-only starts at $29 per host, and log ingestion costs $0.20 per GiB. Pricing runs on an annual platform commitment, with a 15-day free trial.
For an early-stage SaaS, it is too many tools. It makes sense once you sell to large companies that demand HIPAA or FedRAMP paperwork. If compliance is your main driver, start with our guide to security tools for SaaS compliance.
Quick Comparison of Monitoring and Observability Tools for SaaS
The biggest difference is not features. It is what you pay for as you grow: hosts, data, users, or a mix.
| Tool | Free tier | Paid from | You mainly pay for | Best fit |
|---|---|---|---|---|
| Grafana Cloud | Yes, 50 GB logs | $19/mo + usage | Data volume | Lean teams using OpenTelemetry |
| Datadog | Up to 5 hosts | $15/host/mo | Hosts + data | One vendor for everything |
| Sentry | 1 user, 5k errors | $26/mo | Events | Errors and releases |
| Better Stack | 10 monitors | $29/responder/mo | Responders + data | Uptime, on-call, status page |
| New Relic | 100 GB data | $0.40/GB | Data + users | Small teams with heavy data |
| SigNoz | Self-hosted | $49/mo | Data volume | Open-source, no lock-in |
| Honeycomb | 20M events | $150/mo | Events | Debugging slow requests |
| Langfuse | 50k units | $29/mo | Units | LLM cost and prompt tracing |
| Dynatrace | 15-day trial | $29/host/mo | Annual commitment | Enterprise compliance |
Prices are annual-billing list prices where both options exist. If your team is small but your data is large, user-based pricing wins. If you have few hosts but lots of engineers, host-based pricing can be cheaper.
Final Thoughts
Don’t pick monitoring and observability tools for SaaS by feature list. Pick by how the bill grows and how easily you can leave.
My advice for most small teams: instrument with OpenTelemetry first. Then send the data to Grafana Cloud or SigNoz, add Sentry for errors, and use Better Stack for uptime and on-call. If your product calls AI models, add Langfuse. That stack costs little at the start, and you can swap any piece later without touching your code.
Move to Datadog or Dynatrace only when engineering time costs more than the invoice. For a small product, like one of our free micro-SaaS tools, the free tiers above are usually enough.
Whatever you choose, set a spending limit before you send the first byte.