A page can receive thousands of impressions in Google Search Console and almost no traffic. That does not necessarily mean the data is wrong or the page has failed. It means Google displayed—or made available—a link to the page, but few searchers clicked it.
Search Console impressions measure search visibility, not website visits. They show where your pages have an opportunity to be seen, which queries Google associates with them, and whether that visibility is expanding or shrinking.
The metric becomes useful once you stop treating every impression as a real view. Read it alongside clicks, click-through rate, average position, search type, and the actual queries involved. That combination can expose ranking opportunities, poor intent matches, seasonal demand shifts, and technical problems that a single sitewide total would hide.
What Are Search Console Impressions?
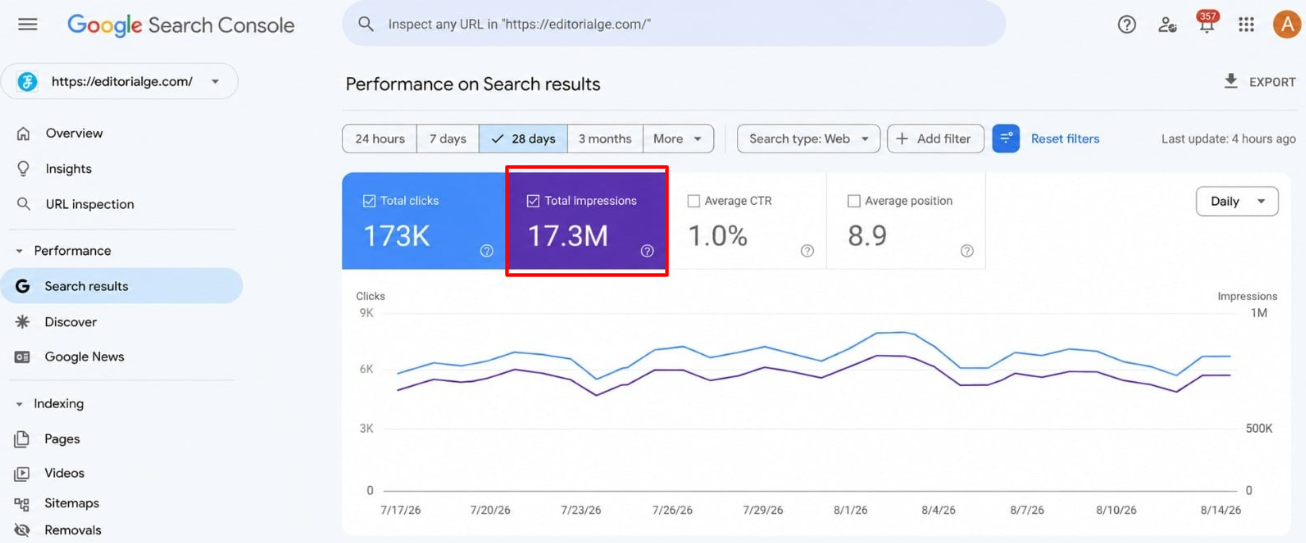
An impression generally means that a user saw, or potentially could have seen, a link to your site in an eligible Google surface such as Search, Discover, or Google News.
For a standard search result, the person may not need to scroll far enough to bring the link onto the visible part of the screen. If the result is included in the current set of results, it may count as an impression.
Suppose an article appears when someone searches for “email marketing checklist.” That appearance may create one impression even if the person never reaches the listing or reads its title.
If the article records 500 impressions, those could come from:
- 500 different people searching once
- A smaller number of people performing several searches
- The same page appearing for many related queries
- A combination of all three
Search Console does not report impressions as unique users. Nor does it tell you whether someone paid attention to the listing. The most accurate way to read the metric is as an eligible opportunity to be seen.
The Result Does Not Always Need to Be Visible
The phrase “your result was seen” can be misleading because Google applies different rules to different result formats.
In standard paginated results, an item can count when it appears in the current set of results, even if it sits below the visible portion of the screen. If the user must click a control such as “See more” to reveal another group of results, links hidden behind that action generally do not count until they are revealed.
Other formats behave differently:
- An item in a horizontally scrolling carousel normally has to be brought into view within the carousel.
- A hidden item in an expandable result usually must be expanded.
- On infinite-scrolling surfaces, the item generally must be loaded and scrolled into view.
- Scrolling away from a result and returning to it during the same query or session does not create another impression.
- A new search or another set of results can create a new impression.
The distinction matters when diagnosing small changes. A site gaining carousel or image visibility may see impressions behave differently from a site that mainly appears as standard text results.
Google can also adjust the counting method for particular search features. A modest reporting shift with no similar movement in clicks, rankings, or organic traffic does not justify an immediate content overhaul.
Property Totals and Page Totals Can Disagree
One of the more confusing parts of the Performance report is that the chart and table do not always aggregate data in the same way.
The chart is normally aggregated by property. If two results from the same Search Console property appear for one query, the chart may record one property-level impression.
The Pages table uses page-level aggregation. Each unique page can receive its own impression.
Imagine that a category page and a related guide both appear for the same search. The property-level chart may show one impression, while the Pages table shows one for each URL. Adding the page rows can therefore produce a number larger than the total at the top of the report.
Data grouped by Search appearance is also aggregated by page. Queries, countries, devices, and dates are generally aggregated by property.
The mismatch is a consequence of how the report groups data. It is not, by itself, evidence of missing or duplicated impressions.
Which URL Receives the Credit?
Search Console usually assigns impressions, clicks, and position data to the canonical URL chosen by Google.
If several addresses contain substantially the same content, Google may consolidate their performance under one representative URL. This can affect tracking-parameter URLs, desktop and mobile variations, or other duplicate versions.
As a result, the address credited in the Performance report may differ from the precise address displayed or visited.
When a page appears to be missing data, check its Google-selected canonical in the URL Inspection tool. If Google chose a different version from the one you intended, review:
- Canonical tags
- Internal links
- Redirects
- Sitemap entries
- Duplicate or near-duplicate pages
Do this before concluding that Search Console lost the impressions. Quite often, the data is sitting under another URL.
How AI Overviews and AI Mode Affect Impressions
Links appearing in AI Overviews and AI Mode can receive impressions. They are included within the Web search type in the standard Performance report.
Google applies its standard impression rules to these features, but position data reflects the surrounding search element. An AI Overview occupies one position, and the links within that overview are assigned the same position. In AI Mode, a follow-up question is treated as a new query and can create another set of performance data.
Google also provides a dedicated Generative AI performance report. Based on current documentation, it covers impressions from AI Overviews and AI Mode and allows data to be grouped by page, country, date, and device.
The report does not provide query-level data. You may see that a page gained AI-related impressions without learning the exact searches that triggered them. That limits how confidently the data can guide an individual content change.
Google announced worldwide rollout of these insights on August 31, 2026. A property may still lack the report if it has not recorded enough eligible generative AI impressions.
For most publishers, the regular Performance report should remain the main starting point. Use the dedicated report to isolate AI visibility, not as a replacement for broader page, query, CTR, and conversion analysis.
Impressions Are Not Search Volume
A query showing 2,000 impressions in your account did not necessarily receive 2,000 searches across Google.
Your site may have appeared for only part of the total demand. Search Console also withholds some low-volume or sensitive query data for privacy and limits the number of rows shown in its tables.
Nor do impressions directly measure:
- Website visits
- Unique searchers
- Engagement
- Leads or sales
- Brand recall
- Whether someone read the result
- Whether the result appeared above the fold
An impression is evidence of visibility, but not necessarily useful visibility. A page can appear repeatedly near the bottom of the results, accumulate a large number, and attract almost no qualified traffic.
Read Impressions With the Other Metrics
The four main Performance report metrics answer different questions.
| Metric | Question It Answers |
|---|---|
| Impressions | How often did the site have eligible search visibility? |
| Clicks | How often did that visibility produce a visit from Google? |
| CTR | What proportion of impressions became clicks? |
| Average position | Approximately where did the topmost reported result appear? |
Average position deserves caution. It is calculated across impressions and can be affected by the mix of queries, countries, devices, and result formats.
A page might rank well for five established queries and then start appearing much lower for 30 new ones. Its impressions rise, while its overall average position becomes numerically worse. That can look like a ranking loss even when the original queries remain stable.
Before reacting to average position, filter to the page and compare its individual queries across equal periods.
High Impressions and Few Clicks: What to Check First
Low CTR does not automatically mean the title needs rewriting. Position and search intent should be checked first.
If most impressions occur beyond the first page of results, few clicks are unsurprising. The bigger opportunity may be improving the page enough to compete, not adjusting a title that hardly anyone reaches.
If the page regularly appears near the top and still attracts little traffic, inspect the live results. Look for:
- A title that does not answer the searcher’s need clearly
- A mismatch between the query and the page’s purpose
- Ads, maps, shopping results, videos, or forums taking attention
- An AI-generated answer satisfying the query without a click
- A competitor with a more specific or trustworthy-looking result
- Informational queries leading to a strongly commercial page
Manual searches provide context, but they are only samples. Results vary by location, device, language, time, and search history.
The most useful diagnosis comes from combining that visible result-page context with Search Console data. Rewriting titles based only on sitewide CTR is too simplistic.
Why Impressions Increase
Rising Search Console impressions can mean several different things.
A page may be appearing for more query variations as Google develops a broader understanding of its subject. That can be promising if the new searches are relevant. If they are loosely related, the higher total may have little practical value.
Improved rankings can also produce more impressions before they produce many clicks. Moving from a barely visible position into the middle of the results gives a page more exposure, but it may still be too low to attract consistent traffic.
Demand changes are another common explanation. Seasonal events, news coverage, new products, and shifts in public interest can raise impressions even when rankings remain stable. For a seasonal page, year-over-year comparisons are usually more useful than comparing one month with the month immediately before it.
Finally, the growth may come from another format. Check Web, Image, Video, News, Search appearance, and generative AI data separately. Combining different surfaces makes the total harder to interpret.
Why Impressions Fall
A decline is not automatically evidence of a Google penalty.
Possible causes include reduced search demand, lost rankings, a changed canonical URL, removed pages, redirects, a noindex directive, migration errors, stronger competitors, or a different search-results layout.
Reporting choices can also create an apparent drop. Before investigating the site, confirm that you are looking at the same property, search type, country, device, date range, and filters.
Pay attention to the shape of the decline. A sharp drop beginning on one date is more consistent with a technical change, migration, reporting issue, or sudden ranking loss. A gradual decline across several months may reflect weakening demand, growing competition, or slowly deteriorating performance.
A stable average position combined with fewer impressions can suggest reduced demand, although the query mix must still be checked. Falling impressions and weaker positions across the same important queries point more clearly toward lost visibility.
Do not edit dozens of pages because the sitewide graph moved. First locate the page group, query category, country, or device responsible.
A Better Way to Analyze Search Console Impressions
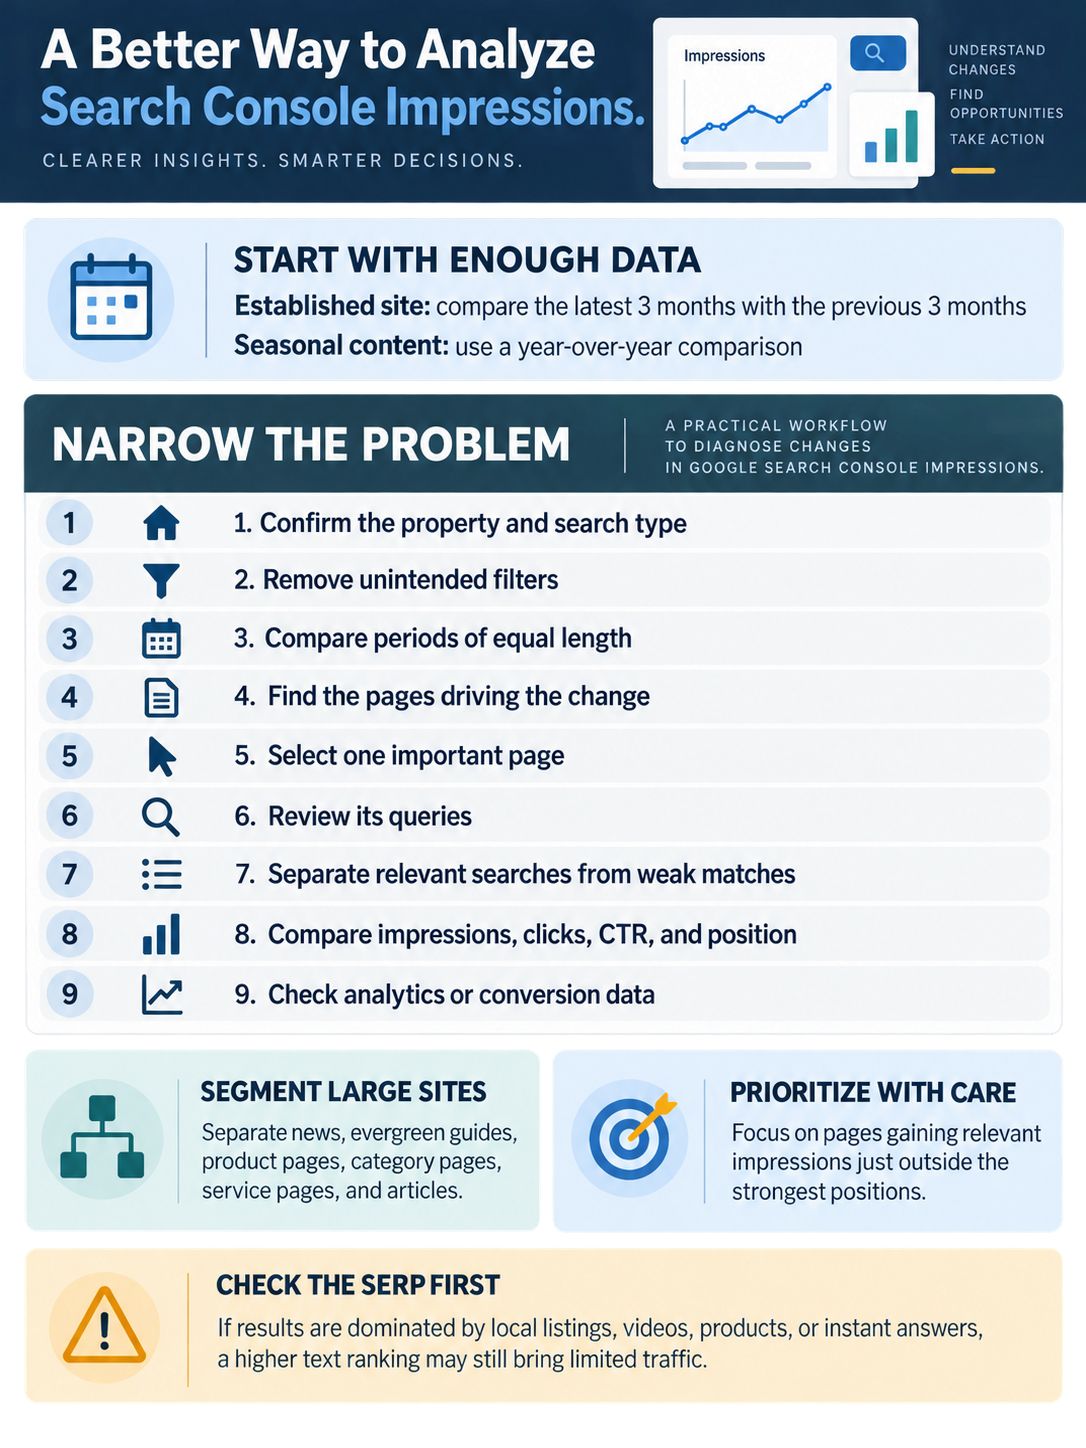
Start with enough data to reduce daily noise. For an established site, comparing the latest three months with the previous three months is usually more informative than reacting to a seven-day chart. Seasonal content may require a year-over-year comparison instead.
Then narrow the problem:
- Confirm the Search Console property and search type.
- Remove any filters you did not intend to use.
- Compare periods of equal length.
- Open the Pages tab and identify the URLs driving the change.
- Select one important page.
- Open its Queries tab.
- Separate relevant searches from weak or accidental matches.
- Compare impressions, clicks, CTR, and position for the same query group.
- Check analytics or conversion data to see what happened after the click.
Large sites should separate page types. A fall in news impressions does not necessarily say anything about evergreen guides. Product pages, category pages, service pages, and articles operate under different demand patterns and should not be combined into one diagnosis.
Pay closest attention to pages already gaining relevant impressions but sitting outside the strongest positions. Those pages have demonstrated some search eligibility. Improving them is often more defensible than publishing another loosely related article and hoping it performs.
That does not mean every near-ranking page deserves an update. Check the result page first. If the query is dominated by local listings, videos, products, or instant answers, a higher text-result ranking may still produce limited traffic.
Why Search Console and Analytics Do Not Match
Search Console records activity in Google results. Google Analytics measures visits and behavior after people reach the website. Clicks and sessions are related, but they are not the same event.
Differences can also come from:
- Missing or misconfigured analytics tags
- Consent choices that prevent analytics tracking
- Different time-zone settings
- Canonical URL consolidation
- Redirects
- Non-HTML files such as PDFs
- Different attribution and processing methods
Search Console usually publishes collected performance data within two to three days. Its 24-hour view can show newer preliminary figures, which may change as processing continues. Most daily Performance views use Pacific Time, so individual dates may not align with an analytics account set to another time zone.
Search Console tables are limited to 1,000 displayed rows. Some rare queries are anonymized and may contribute to chart totals without appearing in the Queries table. These limits are another reason the visible rows do not always add up to the headline number.
Exact agreement should not be the target. Look for comparable trends and investigate only when the difference is large, persistent, and unexplained.
How to Improve Impressions That Are Worth Having
More impressions are not automatically better. Visibility for irrelevant searches can inflate a report without helping readers or the business.
Useful improvements are usually straightforward:
- Expand a page when it leaves an important part of the searcher’s question unanswered.
- Create a separate page when a related query has genuinely different intent.
- Strengthen internal links to pages already showing relevant visibility.
- Use titles and headings that describe the page accurately.
- Consolidate overlapping pages competing for the same purpose.
- Correct indexing and canonicalization problems.
- Update material when old information makes the page less useful.
- Add examples, comparisons, evidence, or instructions missing from competing results.
Avoid rewriting a page every time impressions fluctuate. Search demand changes, preliminary data is revised, and new query exposure can shift average position. Wait for a sustained pattern, identify the affected searches, and make changes that improve the page for those readers.
Final Thoughts
Search Console impressions are most useful as a starting point for investigation. They show that Google is giving a page some level of visibility, but they do not reveal whether the right person noticed it, clicked it, or found the page useful.
Choose one page with a meaningful change in impressions, inspect its queries, and compare its position and CTR over the same period. Then check what the search results actually contain. That short process will tell you far more than watching the sitewide total rise and fall.
The number matters only when it represents relevant visibility. Use Search Console impressions to find that visibility, understand it, and decide where an editorial or technical improvement is genuinely worth the effort.
Frequently Asked Questions
Can my own Google searches create Search Console impressions?
They can if your result appears under the normal counting rules. Repeatedly searching for your pages is not a useful testing method, however. Results vary by location, device, language, and search history, and Search Console data is processed rather than presented as a live activity log.
Does zero impressions mean a page is not indexed?
Not necessarily. A page can be indexed without appearing in the searches recorded during the selected period. Check the page with the URL Inspection tool to confirm its indexing and canonical status. If it is indexed but has no impressions, examine its relevance, internal links, competition, and whether there is meaningful demand for the topic.
Should I optimize every query that has high impressions but no clicks?
No. First check whether the query is relevant to the page and valuable to the intended audience. Some high-impression queries are poor matches, while others produce few organic clicks because Google displays maps, products, videos, or instant answers. Prioritize queries where the page genuinely deserves to compete.
Why did my impression total change after I applied a page or query filter?
Filters can change how Search Console aggregates the data. Page-level reporting, property-level totals, anonymized queries, and the 1,000-row table limit can all create differences. A filtered total should not always be expected to match the unfiltered chart through simple addition or subtraction.