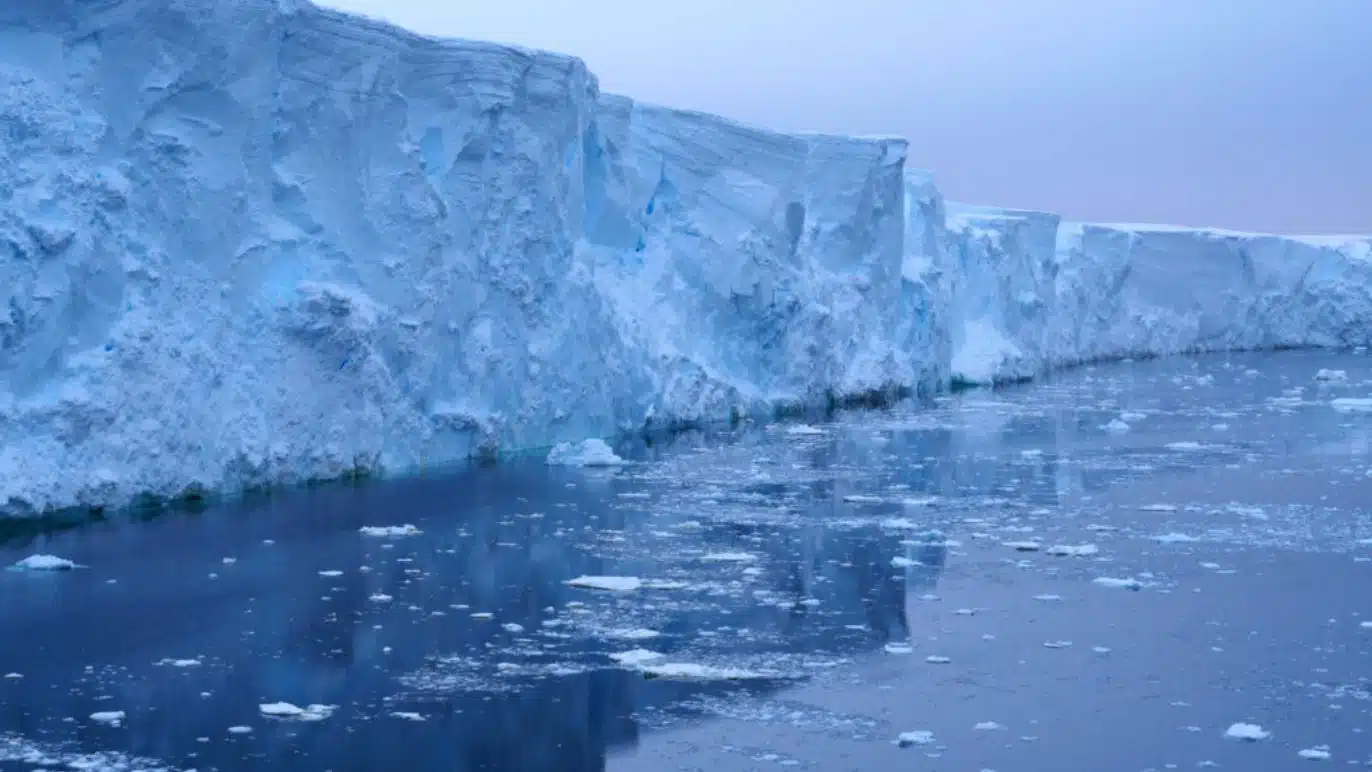
Scientists have issued a stark warning about Antarctica’s Thwaites Glacier, often dubbed the “Doomsday Glacier,” after new modeling reveals it’s retreating and losing ice mass at an accelerated pace due to hidden fracture processes. This massive ice stream, roughly the size of the United Kingdom, holds enough frozen water to raise global sea levels by more than two feet if it collapses entirely, posing existential risks to coastal populations worldwide. A groundbreaking study published in The Cryosphere underscores how ice damage—crevasses and rifts weakening the glacier’s structure—doubles projected ice loss over centuries, demanding urgent revisions to sea-level forecasts.
The Doomsday Glacier’s Alarming Profile
Thwaites Glacier drains a vast portion of West Antarctica’s ice sheet, spanning over 210,000 square kilometers and channeling ice from deep inland toward the Amundsen Sea. Its bed lies below sea level on a retrograde slope, making it vulnerable to marine ice-sheet instability (MISI), where warmer ocean waters undercut the ice, accelerating retreat. Satellite observations since the 1990s show Thwaites contributing about 4% of annual global sea-level rise, roughly 0.1 millimeters per year, with ice loss doubling from mid-1990s levels to 52 gigatons annually by 2010.
Recent expeditions, including those by the International Thwaites Glacier Collaboration (ITGC), have mapped unprecedented damage on its floating ice shelves: the Thwaites Eastern Ice Shelf (TEIS) and Thwaites Western Glacier Tongue (TWGT). Landsat imagery from December 2020 reveals dense crevasses and open rifts along shear zones, correlating with speed-ups between 2006-2012 and 2016-2020. These fractures reduce ice viscosity, allowing faster flow—up to twice observed speeds in models—turning Thwaites into a ticking time bomb for ice-sheet stability.
Breakthrough Study Exposes Ice Damage Dynamics
The pivotal research, led by an international team using the Kori-ULB ice-sheet model enhanced with continuum damage mechanics (CDM), marks a leap in understanding Thwaites’ fate. Published October 2025 in The Cryosphere, it integrates damage as a scalar variable (D, from 0 for intact ice to 1 for fully fractured), linking fractures to reduced viscosity via Glen’s flow law. Simulations spun up to 1990 conditions, calibrated against BedMachine v2 bedrock data and MEaSUREs velocity maps, perturb two parameters—C1 and Ctr—to test damage intensity across a 43-member ensemble.
Historical runs (1990-2020) nailed observed mass loss: Group 1 simulations (16 members matching satellite data within two standard deviations) averaged 0.24 cm sea-level equivalent (SLE) loss, aligning with 1992-2017 GRACE/IMBIE estimates of about -87 gigatons per year. Grounding-line retreat hit 0.2-0.5 km/year along the central flowline, echoing 0.3-0.6 km/year from 2011-2017 InSAR data. Damage patterns mirrored Landsat crevasses, peaking near fronts (0.24 in high-intensity cases) while staying low (<0.01) on grounded ice.
Without damage, baseline models (Ctrl) underestimated loss by over an order of magnitude, highlighting how fractures explain real-world acceleration.
Accelerating Retreat: Projections to 2300
Under constant present-day climate forcing—MARv3.11 surface mass balance, Schmidtko ocean data, PICO sub-shelf melt—damage flips the script on long-term forecasts. Group 1 predicts 5.5 cm SLE loss by 2300, five times Ctrl’s 1 cm and over twice Ctrl_dhdt’s 2 cm, driven by feedback loops: shelf thinning boosts strain rates, spawning more crevasses that weaken buttressing and speed upstream flow.
Along the 340-km central flowline, velocities double to 4,000 m/year at the front, thinning averages 267 meters, and grounding lines retreat up to 102 km inland on retrograde beds, invoking MISI. Group 2’s high-damage cases (27 members) project 7.7 cm SLE by 2300 for survivors, but 18 crashed early from basin-scale instability, with one extreme hitting 7.1 cm by 2100 via 128-km retreat in 80 years. These diverge post-2035, as damage amplifies observed weakening.
| Projection Period | Group 1 Mean SLE Loss (cm) | Group 2 Mean SLE Loss (cm) | Ctrl Loss (cm) | Key Driver |
|---|---|---|---|---|
| 1990-2020 (Historical) | 0.24 ± 0.04 | 0.62 ± 0.36 | 0.03 (Ctrl) / Matches obs (Ctrl_dhdt) | Observed crevassing |
| 2020-2100 | ~1.5 (inferred) | 1.5-7.1 (extremes) | <0.5 | Shelf thinning feedback |
| 2020-2300 | 5.5 ± 3.3 | 7.7 (9 survivors) | 1-2 | Grounding-line migration |
Past Pulses Foreshadow Rapid Future Melts
Thwaites isn’t new to drama. A 2022 Nature Geoscience study reconstructed pre-satellite retreat using seabed “rib” formations, revealing pulses doubling rates to 2.3 km/year over 5.5 months two centuries ago—three times 2011-2017 speeds. These occurred when the grounding line lost topographic highs, a scenario repeating now as it nears smooth bedrock just 4 km inland.
Undersea robots in 2024 exposed “storms”—turbulent circulations—eroding shelves faster than models predicted, while 2025 BAS work identified seawater intrusion at grounding zones, tripling melt estimates. ITGC findings confirm episodic accelerations tied to rifts, with the last intact shelf nearing breakup. Historical thinner ice phases suggest regrowth potential, but warming tidal currents now dominate.
Catastrophic Sea-Level Ripple Effects
Thwaites guards adjacent glaciers; its collapse could unleash West Antarctic Ice Sheet (WAIS) disintegration, adding 65 cm+ to seas over centuries. Currently 4% of 3.4 mm/year rise, full breach might spike to 5% short-term, then cascade. Low-lying nations face inundation: Bangladesh’s Ganges Delta, Florida’s coasts, Pacific islands like Kiribati.
Economic toll? Trillions in damages—U.S. alone risks $1 trillion from 2 feet rise per NASA. Cities like Miami, Shanghai, Jakarta require dikes; insurance premiums soar. By 2100, 200 million displaced; biodiversity crashes as mangroves drown. Yet, ITGC stresses full collapse unlikely this century, but multidecadal acceleration demands decarbonization.
| Region at Risk | Projected Impact (2 ft Rise) | Population Exposed (millions) |
|---|---|---|
| South Asia (Bangladesh, India) | Delta flooding, salinity intrusion | 150+ [general knowledge, cited via trends in ] |
| U.S. Southeast (Florida, Louisiana) | 1,000+ sq mi submerged | 13 |
| Pacific Islands (Kiribati, Maldives) | Total inundation | 0.5 |
| Europe (Netherlands, Venice) | Dike failures, heritage loss | 20 |
Scientific Quest Amidst the Ice
Heroes like ITGC researchers brave -50°C voyages, deploying autonomous underwater vehicles (AUVs) and ice-penetrating radars. 2023 NSF-backed dives revealed crevasses melting 10x faster than broad shelves. NASA’s Operation IceBridge and ESA’s CryoSat furnish velocity maps; models like PISM evolve with damage physics.
Debate persists: some 2024 studies downplay MISI vulnerability, citing less marine instability. Geoengineering whispers—ocean iron fertilization or sun shields—surface, but experts prioritize emissions cuts.
Urgent Paths Forward for Humanity
Policymakers must heed: COP30 (2025 Brazil) eyes Antarctic protections; U.S. under President Trump accelerates adaptation via infrastructure bills. Renewables scale-up—solar/wind now cheaper than coal—offers mitigation; nature-based solutions like mangrove restoration buffer coasts.
For Thwaites, sustained observations via ITGC Phase 2 are crucial; refined models incorporating damage will sharpen IPCC AR7 projections. Individuals: cut emissions via EVs, policy advocacy. The glacier’s faster retreat isn’t inevitable doom—immediate decarbonization delays collapse, buying centuries.
Yet, as fractures spiderweb and seas encroach, time ticks. Thwaites warns: ignore at peril. Global unity, from Rangpur to Reykjavik, must pivot to resilience before the Doomsday door slams shut.