
An AI-generated infographic can display the right numbers and still tell the wrong story. Imagine a graphic that says workshop completion rose from 40% to 50%. The headline calls it a “10% increase,” and the second bar looks twice as long as the first. The figures are right. The headline confuses percentage points with relative change, and the bars exaggerate the difference.
Run these eight data checks on the final exported graphic. Keep the source table open alongside it so you can compare what readers see with the evidence behind each claim.
1. Trace every number to a source you can reopen
Ask where each number came from, including figures embedded in icons, callouts, rankings, and captions. Save the dataset or report title, the release date, and the exact table, row, or cell. If the number came from an internal spreadsheet, record the tab and version. A logo or a generic “Source: survey data” footer gives an editor little to verify.
Check that the source actually measured what the graphic claims. A survey of respondents’ plans to adopt a tool supports a claim about intentions. Actual adoption requires evidence of use. If the only record of a figure is the AI output, remove the figure until you can substantiate it. The same requirement for accuracy and context applies to visuals under Editorialge’s journalistic ethics code.
2. Check the population, period, and denominator
Open the methodology or data notes and write down who qualifies for the measure. Watch for shifts between all registrants, attendees, and survey respondents. Eighty completions among 200 registrants is 40%. The same 80 completions among 100 attendees is 80%. Both rates may be valid, but the audience needs to know which group each one describes.
Confirm the date range and geography for every comparison. A full year beside a partial year can make a trend look steeper or weaker. If the source changed its screening criteria or reporting method between periods, describe the break or use a comparable series. Put the definition near the figure where readers can see it.
3. Recalculate every percentage and change
Compute derived values from the underlying counts or unrounded figures. Keep your calculations in a spreadsheet so another editor can reproduce them. Check which denominator each figure uses and when rounding enters the calculation.
In the hypothetical workshop example, Session A had 80 completions out of 200 registrants. Session B had 100 out of 200. The difference is 10 percentage points, calculated as 50% minus 40%. Relative to Session A’s rate, the increase is 25%, calculated as 10 divided by 40. A headline that says “completion rose from 40% to 50%” conveys the change with both comparison points visible.
4. Match chart geometry to the numbers
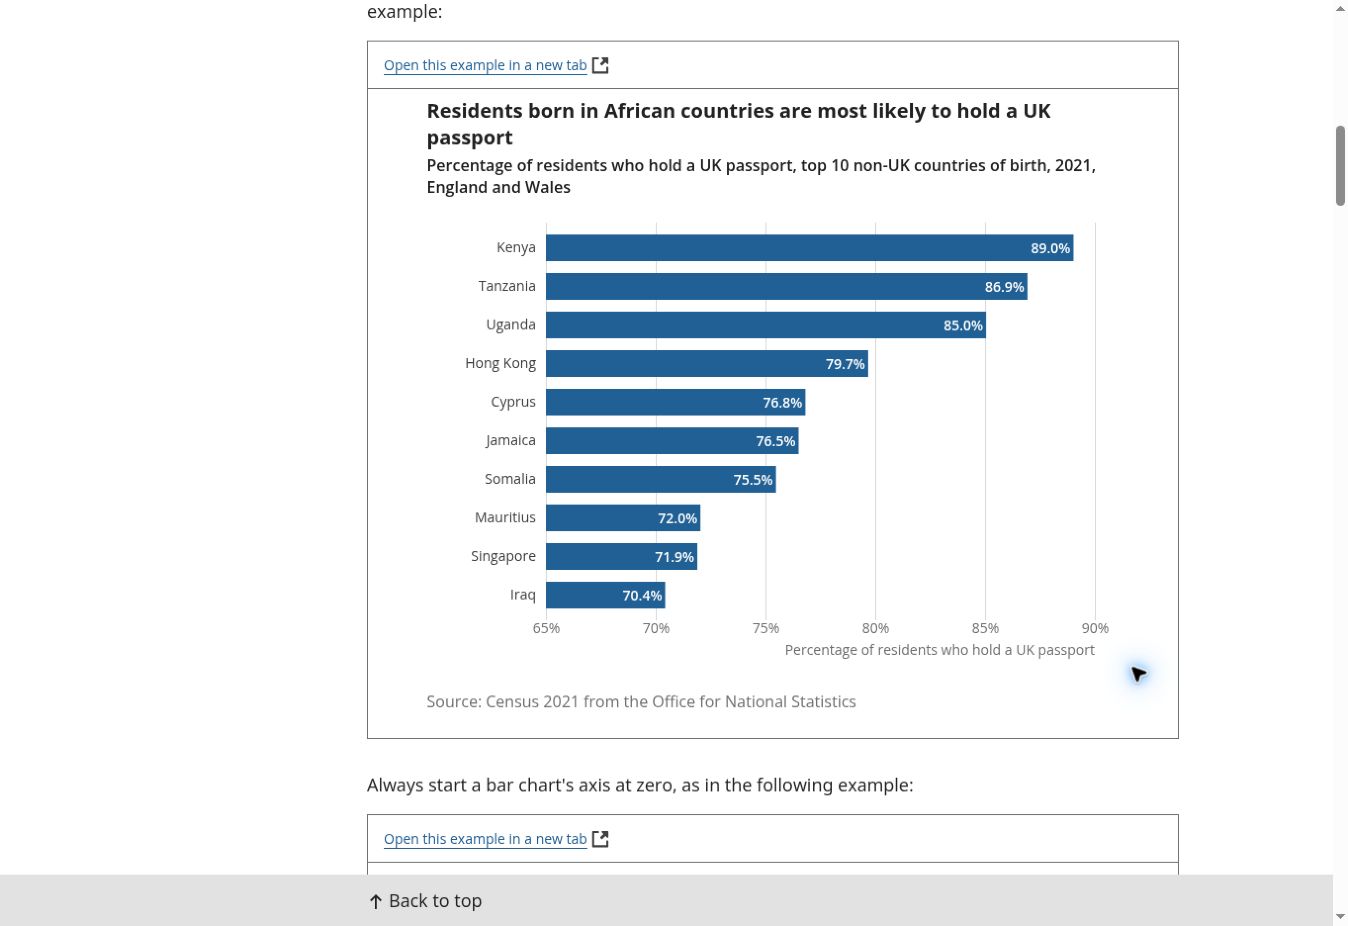
Read the labels, then check whether the shapes encode those values correctly. A 50% bar should be 1.25 times as long as a 40% bar on the same zero-based scale. If the axis begins at 30%, the two visible lengths represent 20 and 10 percentage points and can make the larger bar look twice as long. The UK Office for National Statistics calls for a zero baseline for bar charts.
Check pie slices against their shares, line points against their dates, and icons against their legends. A polished illustration can leave these proportions ambiguous. If the geometry fails, rebuild the chart from the verified table in a spreadsheet or charting tool.
5. Reconcile labels, units, and totals
Read the exported image from top to bottom, comparing each label with the corresponding data row. Check units, metric prefixes, decimal places, minus signs, currency codes, dates, and category order. Look for a shifted legend or transposed label that attaches the right value to the wrong group.
If a chart is meant to show a complete breakdown, check that its categories reconcile with the total. Rounded shares can land just above or below 100%, in which case a rounding note may help. Overlapping groups, such as survey responses that allow several selections, can legitimately add to more than 100%. Explain that design and choose a chart that can represent it. Also distinguish missing values from reported zeroes.
6. Preserve uncertainty and the limits of the comparison
Label estimates, forecasts, provisional numbers, and suppressed values according to the source. Include an interval when it is needed to interpret the comparison. Keep the sample size and caveats close to the relevant figure, especially when a graphic compares small groups.
The workshop figures show that the completion rate differed between two sessions. Suppose Session B introduced reminder emails. Without a study design or other evidence that isolates their effect, the figures alone cannot establish that the reminders caused the difference. Review the headline, arrows, and annotations for implications that the source cannot support.
7. Compare the export with the approved data
Verify the exact file that will go live, including each social crop. An update intended to fix one typo can change a date, a decimal separator, or a label elsewhere in a regenerated image. Manual edits can also leave the caption or source line out of sync.
Review at normal reading size on a phone. Ask a second reader to point to the denominator, units, dates, and source. Give that person the approved table so they can independently match the labels and values. Record which source version goes with the final file, then repeat the affected checks after any edit that touches the data.
8. Give readers a text version of the evidence
Write short alt text that identifies the graphic and points to the available detail when useful. Put the important values and relationships in nearby article text or an accessible table. W3C’s guidance for complex images describes a short description paired with a fuller text equivalent. W3C guidance on complex images
For the workshop chart, the text equivalent can say that completion rose from 80 of 200 registrants in Session A to 100 of 200 in Session B, a difference of 10 percentage points. A reader can follow the comparison even if the image fails to load or becomes difficult to read in a mobile crop.
Put the eight data checks to work
Use this hypothetical dataset to see what the graphic, caption, and source table should say together.
| Session | Completed | Registered | Completion rate |
|---|---|---|---|
| A | 80 | 200 | 40% |
| B | 100 | 200 | 50% |
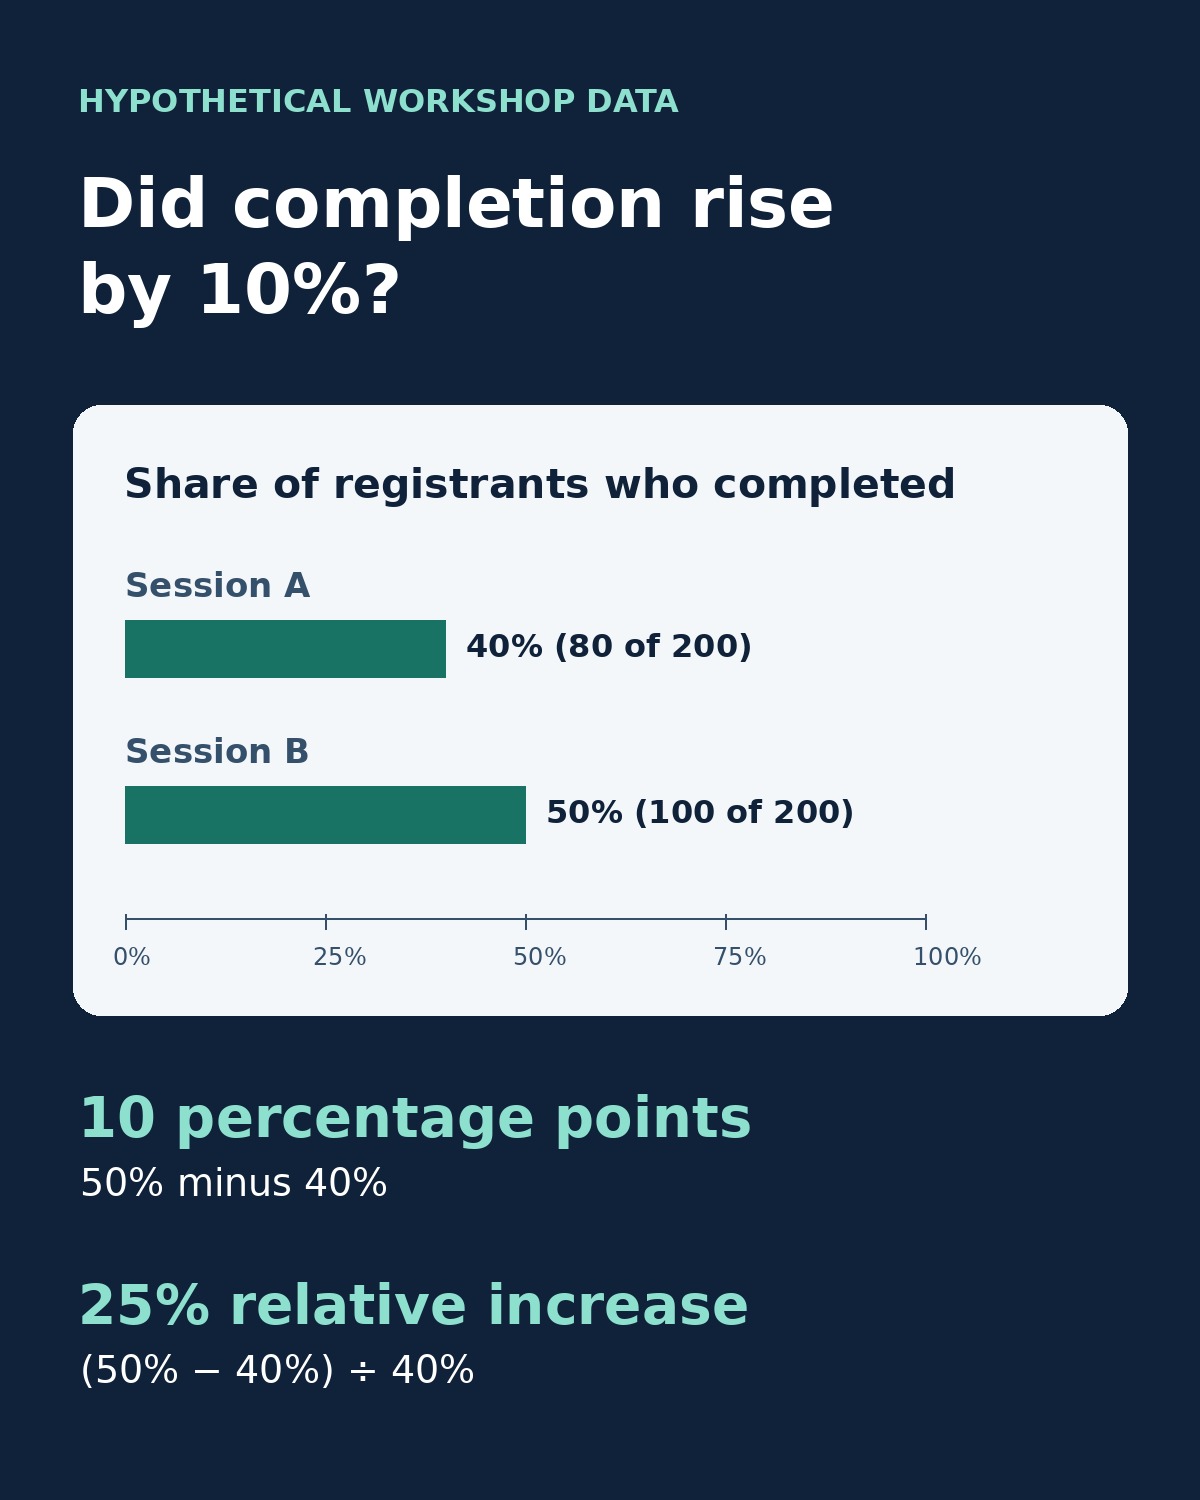
The exported chart should show two bars starting at zero on the same scale and label the measure as the share of registrants who completed the workshop. Keep the table beside the graphic and mark the example as hypothetical. The last pass before publishing an AI-generated infographic is a comparison between the file the reader will see and the source you can reopen.