Google has added NotebookLM data tables (announced Dec. 18, 2025), a new feature that turns information from your sources into structured tables you can export to Google Sheets, as part of a broader push to make NotebookLM faster and more useful for research.
What’s new: Data Tables in NotebookLM
NotebookLM is Google’s research assistant designed to work from the materials you give it—documents, notes, and other sources. With NotebookLM data tables, Google is adding a practical “organize and reuse” layer: the tool can extract key facts from your sources and arrange them into a table format.
Google says the goal is to help people move from unstructured reading to structured outputs, without manually copying and pasting details into a spreadsheet. The tables can then be exported to Google Sheets, where users can continue working with filters, formulas, and collaboration tools.
In simple terms: NotebookLM can now help you convert a messy pile of research into a clean grid you can scan and share.
Why tables matter for research (and why Google built this)
Summaries are useful, but research often depends on comparison.
Tables help people:
- Track what each source actually says (and what it doesn’t)
- Compare claims side by side
- Organize timelines, action items, and datasets
- Reduce manual transcription mistakes
- Reuse outputs in planning, reporting, or analysis
Google’s decision to emphasize export to Sheets signals an important strategy: NotebookLM is not trying to replace spreadsheets. It’s trying to speed up the step before spreadsheets—when information is still scattered across documents.
How Data Tables work in real workflows
Google has highlighted several practical use cases that match common research tasks:
Meetings and operations
Teams can turn meeting transcripts and notes into tables such as:
- Action items by owner
- Priority and due date tracking
- Decisions and next steps
This is especially useful for recurring meetings where teams need consistent structure week after week.
Competitive research and planning
Data tables can help build comparison grids across multiple sources—useful for:
- Feature comparisons
- Pricing or packaging summaries (where sources allow)
- Positioning statements and product claims
Academic and scientific review
Google also points to structured reading workflows where tables can capture:
- Study year, sample size, outcome measures
- Reported results and key limitations
- Paper-to-paper comparisons
For students, the same structure can support study tables for events, concepts, and cause-and-effect relationships.
The bigger picture: NotebookLM’s recent “research upgrade” wave
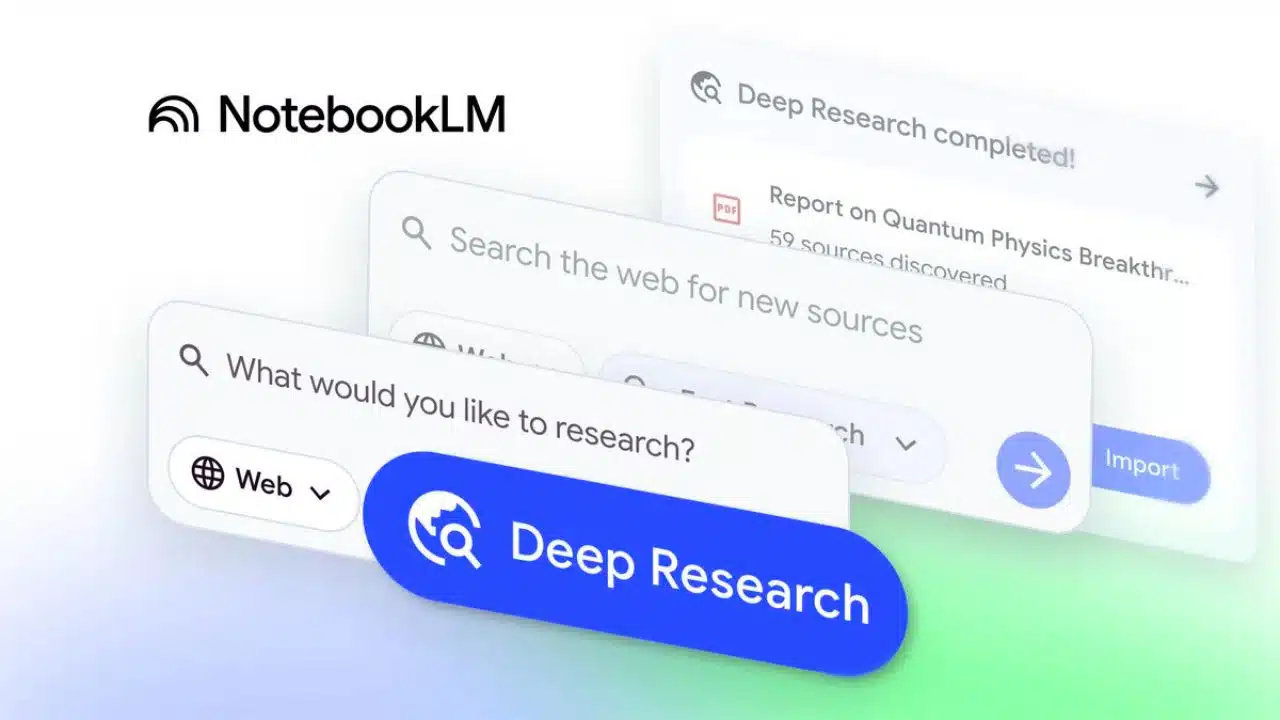
Data Tables did not arrive in isolation. In November 2025, Google introduced Deep Research inside NotebookLM and expanded the types of sources the tool can use—both of which shape how data tables may be used in practice.
That combination matters:
- Deep Research helps gather and synthesize information at scale
- Expanded source support brings more “real work” formats into the notebook
- Data Tables helps convert insights into structured, reusable outputs
Deep Research: a built-in research agent
Google describes Deep Research as a feature that can generate a research plan, browse broadly across the web, and produce a report grounded in sources. It is designed to reduce the time spent assembling background material and summarizing it into a coherent brief.
Google has described two approaches:
- Fast Research for quick scanning and adding sources into a notebook
- Deep Research for more thorough reports that can run in the background
In a typical workflow, a user might:
- Ask a research question
- Let Deep Research gather and summarize
- Save the report and sources into NotebookLM
- Use Data Tables to structure the findings into rows and columns
- Export to Google Sheets for deeper analysis or collaboration
Expanded source support: Sheets and Word change the day-to-day use case
Alongside Deep Research, Google expanded NotebookLM’s supported source types, including:
- Google Sheets
- Microsoft Word (.docx)
- Images (such as photos of notes or printed materials)
- PDFs from Google Drive (without re-uploading)
- Drive files added via URLs
This matters because many real research projects are mixed-format. A single investigation or market brief might include:
- A spreadsheet of numbers
- A Word draft or interview notes
- Several PDFs
- Photos of handwritten notes
- Links to Drive assets
With broader source support, NotebookLM can sit closer to the center of that workflow—rather than being an extra tool used only for one format.
Availability and rollout: who gets Data Tables first
Google says NotebookLM data tables are available immediately for certain paid tiers and will expand to more users afterward.
Rollout snapshot
| Feature/Update | What it adds | Availability (as described by Google) | Announcement date |
| Deep Research | Research plan + broad web research + source-grounded report | Rolling out to users | Nov. 13, 2025 |
| Expanded source types | Adds Sheets, .docx, images, Drive PDFs, and Drive links | Rolling out; images take longer | Nov. 13, 2025 |
| Data Tables | Turns sources into structured tables; export to Google Sheets | Pro & Ultra first; wider rollout in coming weeks | Dec. 18, 2025 |
Trust and traceability: why “grounded” outputs matter
NotebookLM is built around the idea of working from user-provided sources. Google’s documentation describes how the tool uses sources and citations to support answers. This is important for research because users need to track where information came from—especially when preparing reports, academic notes, or publishable material.
In that context, Data Tables can be seen as another “grounded output” format: instead of just narrative summaries, users can generate structured tables that are easier to check, audit, and refine.
What this means for Workspace, schools, and organizations
NotebookLM’s growth is closely tied to Workspace usage. Google has positioned NotebookLM and NotebookLM Plus as tools that can be enabled within certain Workspace environments, depending on eligibility and admin settings.
For organizations, the main questions tend to be:
- Who can access the tool (and under what plan)
- What admin controls exist
- How data is handled under their account type
Google’s admin and help documentation provides guidance on enabling NotebookLM for users and outlines protections in certain Workspace contexts, including how uploaded files and outputs are treated under those environments.
Practical takeaways: who benefits most from Data Tables
NotebookLM data tables are likely to have the biggest impact where teams repeatedly convert documents into structured tracking:
Journalists and editorial teams
- Build “who/what/when” tables across statements, transcripts, and reports
- Track timelines while drafting explainers
- Create comparison tables for policies, organizations, or product claims (based strictly on sourced material)
Business and operations teams
- Convert meeting notes into action-item trackers
- Summarize vendor or competitor materials into structured grids
- Export to Sheets for ongoing ownership, status, and reporting
Students and researchers
- Turn multiple readings into study tables
- Track key points across papers
- Build structured revision notes that are easier to scan than long paragraphs
Final Thoughts
Google’s move to add Data Tables to NotebookLM is a practical upgrade: it helps users turn research into structured outputs they can actually use. Together with Deep Research and broader source support, the feature set points to a clear direction—NotebookLM is evolving into a more complete research workspace, where you gather sources, synthesize them, and then export clean, checkable artifacts for analysis and collaboration.