Raw data has a lot of potentials, but to use that potential to grow your business, you need data analytics. Data analytics is the study of using raw data to figure out what to do with it. Using data analysis techniques, you can take raw data and look for patterns to find ideas. Data experts do their research with the help of data analytics these days. Data Analytics can be used on any data to learn something to make things better.
Different Types of Data Analytics
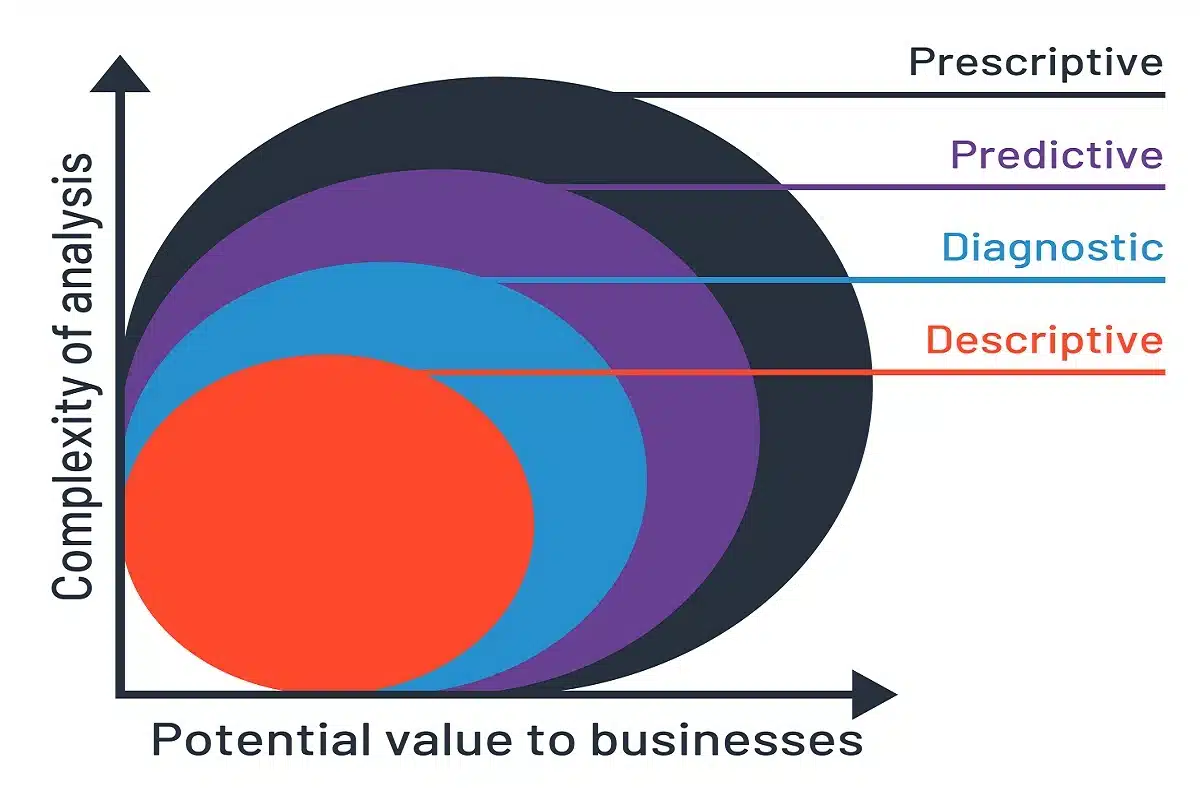
There are four different kinds of data analytics. We will take a close look at each of the four types. Here, we’ll start with the most accessible type and move on to the more complicated ones.
Descriptive analytics
Descriptive analytics answer the question, “What happened?”. Descriptive analytics is the simplest type of analytics and is what the other types are built on. It lets you find trends in raw data and quickly explain what happened or is happening.
Let’s look at an example from CAS about the changes in consumer preferences for natural products. It shows that moisturizers are one of the fastest-growing parts of the cosmetics industry. Since 2010, the number of patent applications for moisturizers that include natural ingredients has been growing.
Since 2010, the number of patent applications for moisturizers that include natural ingredients has been growing.
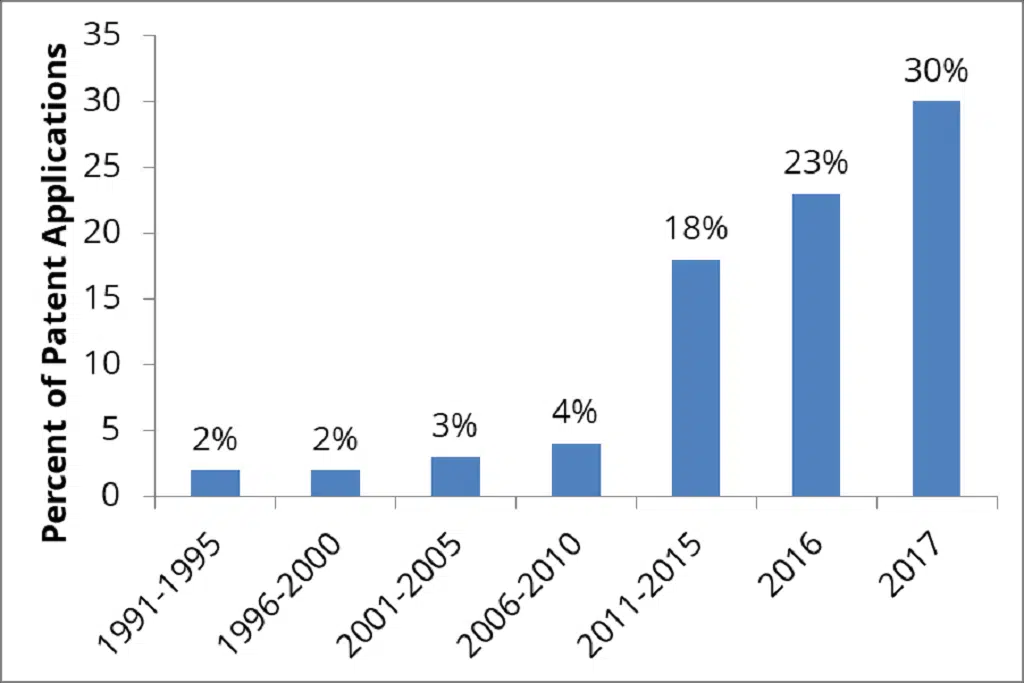
The people who buy cosmetics are the ones who make the industry grow and change. As an industry grows and changes, it produces more data, which makes it harder to keep up with trends and find new opportunities. In markets that are getting competitive, detailed descriptive analytics can help get a deep understanding of the market landscape and strategic options.
Data visualization is a natural way to explain descriptive analysis because charts, graphs, and maps can show you trends in data along with dips and spikes in a clear, easy-to-understand way.
Diagnostic Analytics
Diagnostic analytics answers the next logical question, “Why did this happen?”. This type of analysis goes a step further by letting you compare trends or movements happening simultaneously, finding correlations between variables, and, when possible, figuring out what caused what.
Consider the General Electric Company. It is a global company that has been around since 1892. GE makes light bulbs, things for health care and energy, windmills, gas turbines, jet engines, and other things.
The Transactional Model for GE was focused on how much GE was selling, in terms of sales of operational equipment and sales of parts and services. And what it needs to do to get those sales going up. GE needed to do diagnostic analytics to sell more equipment, parts, and services.
Diagnostic analytics can help you get to the bottom of an organization’s problem. It gives you a deep understanding of a problem.
Predictive Analytics
Predictive analytics helps answer the question, “What might happen in the future?”. By looking at past data and industry trends, you can guess what the future might hold for your business.
One example of predictive analytics is from WNS, a world-famous hotel chain that can stop timeshare members from leaving.
A global leader in the vacation timeshare exchange industry was losing a lot of its timeshare members. They used predictive analytics to give the client a better understanding of its members and to predict how they would act in the future. Their insights helped the client improve its marketing efforts, which stopped the loss of timeshare members.
Predicting what will happen in the future can help your organization make plans based on what is likely to happen.
Prescriptive Analytics
Prescriptive analytics answers the question, “What should we do next?”. Prescriptive analytics helps you look at all the possible things that could happen in a situation and tells you what to do next. This type of data analysis can be helpful when making decisions based on facts.
For example, the Bayes classifier is a common machine learning algorithm that uses the Bayes Theorem, a statistical model, to figure out the conditional probability of something happening. ID3 is a non-statistical machine learning algorithm that builds a graph of possible outcomes from data using a decision tree. The goal of both algorithms is to create a model from past data that can take in new information and predict what will happen.
Data scientists must try out different machine learning algorithms and features to build an authoritarian analytics system because different algorithms make different assumptions about the structure and completeness of data.
Handwork is possible with prescriptive analysis. But machine-learning algorithms are often used to help sort through large amounts of data and let you figure out what the best next step is. “If” and “else” statements are used in algorithms as rules for how to parse data. If a certain set of things happen, an algorithm will suggest a specific course of action. Even though there is a lot more to machine-learning algorithms than just these statements, they are an essential part of training, together with mathematical equations.
Analytics Data that has Retention
Data analytics can change your business, but many companies are too overwhelmed by the amount of data to do anything about it.
The analytical system used by Finteza includes Retention. Let’s take a look at an example. A store has a website where people can place orders online with an offer of a “buy 1, take 1” sale last month. On the day of the sale, the shop’s income increased, the site got a lot of new visitors, and the number of orders went up. Now, the owner needs to create a start event. Here, we need people who signed up for the website on the day of the promotion. Then we write down the events we are going to follow. These are called Tracked Events. In our case, we’ll keep track of repeated orders.
The result: The weighted averages show that 30.85 percent of users finished the Tracked Event on the first day, 10.19% on the second, 7.85% on the third, and so on.
The owner can make a report for the last month and find out, for example, that people who visited the site on the day of the promotion just wanted a free pizza and never came back. When put in context, the day’s metrics show the same number of repeat customers as a normal day. This means that the promotion didn’t work, even though it looked good from a distance. The owner will have to find other ways to bring in more customers.
The Retention report from Finteza will help you understand what is going on in your business and lets you evaluate the effects of marketing campaigns and technical changes on your projects in the right way.
Conclusion
As we’ve seen, each of these types of data analysis is related to the others and depends on them in some way. They all do something different and give different information.
Data is very important to any business because it helps them learn more about their customers, improve their advertising, and grow their lowest lines. Data analytics tools and processes are very important because data has a lot of benefits that you can’t get without these tools.
Raw data has a lot of uses, but you need data analytics to use those uses to grow your business. So, we can say that data analytics is very important for the growth of any business because it helps the company get the most out of its resources.