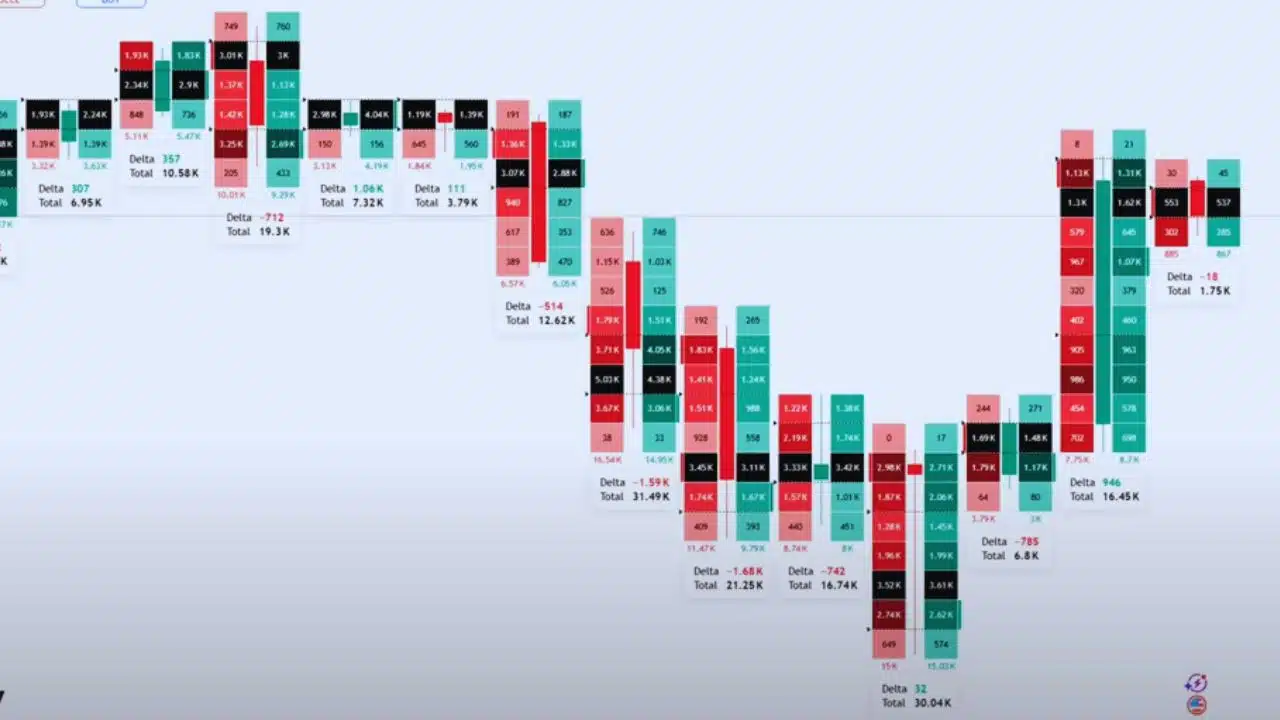
Order flow trading is a sophisticated approach that involves analyzing the buying and selling activity in the financial markets to make informed trading decisions. Unlike traditional technical analysis, which relies on historical price data, order flow trading provides real-time insights into market dynamics by focusing on the actual orders being executed. This method allows traders to gain a deeper understanding of market sentiment and liquidity.
Order flow tools such as Footprint Charts, Depth of Market (DOM), and Delta are essential for traders who wish to master this approach. By utilizing these tools, traders can enhance their decision-making process, manage risk more effectively, and potentially increase profitability.
Understanding Footprint Charts
Footprint charts are an advanced form of candlestick charts that display detailed information about the traded volume within each candlestick. They provide traders with insights into the nature of buying and selling pressure at various price levels.
Key Features of Footprint Charts
- Volume Distribution: Footprint charts break down the total volume into bid and ask volume at each price level, revealing where buyers and sellers are most active.
- Imbalances: These charts highlight areas where there is a significant imbalance between buying and selling activity, indicating potential turning points or continuation patterns.
- Cluster Analysis: Traders can analyze clusters of trades to identify areas of high liquidity or exhaustion.
Example of Footprint Chart Usage
Consider a scenario where a trader notices an area with high buying volume but minimal price movement upwards. This could indicate absorption by larger players preparing for a potential breakout.
The Depth of Market (DOM) Explained

The Depth of Market (DOM) is a tool that displays the current buy and sell orders for a particular asset at different price levels. It is essential for understanding market liquidity and gauging potential support and resistance levels.
How DOM Works
- Order Book Visualization: DOM provides a visual representation of the order book, showing pending buy (bid) and sell (ask) orders.
- Liquidity Insights: By analyzing the concentration of orders at specific price levels, traders can identify areas with significant liquidity.
- Market Dynamics: Changes in the DOM can signal shifts in market sentiment or upcoming volatility.
Practical Application of DOM
Using DOM, a trader might notice a large concentration of sell orders above the current market price, suggesting resistance that could prevent further upward movement unless absorbed by buyers.
Unveiling the Delta in Trading
Delta is a metric used in order flow analysis that measures the difference between buying and selling volume within a specified period. It provides insights into market sentiment by indicating whether buyers or sellers are dominant.
Calculating Delta
Delta is calculated by subtracting the total sell volume from the total buy volume for each bar or time period:
Interpreting Delta Values
- Positive Delta: Indicates buyer dominance, often seen as bullish.
- Negative Delta: Indicates seller dominance, often seen as bearish.
- Neutral Delta: Suggests an equilibrium between buyers and sellers.
Example Scenario Using Delta
A trader observing increasing positive delta alongside rising prices might interpret this as strong bullish momentum, leading to a decision to enter a long position.
Integrating Footprint Charts, DOM, and Delta

The power of order flow trading lies in combining these tools to form a comprehensive market view:
- Footprint Charts provide detailed volume analysis at each price level.
- DOM offers real-time insights into order book dynamics.
- Delta helps gauge overall market sentiment.
Synergistic Benefits
By using these tools in tandem, traders can confirm signals from different perspectives:
- Validate DOM imbalances with footprint chart clusters.
- Correlate delta trends with visible support/resistance levels on DOM.
- Identify potential breakout zones using footprint imbalances confirmed by positive delta shifts.
Practical Applications for Day Traders
Day traders can leverage order flow tools for various strategies:
Scalping Strategies
Utilizing DOM to spot liquidity pockets allows scalpers to enter and exit trades quickly with minimal slippage.
Swing Trading Tactics
Footprint chart patterns combined with delta analysis help swing traders identify reversal points or continuation signals over several sessions.
Advanced Strategies Using Order Flow Tools
For seasoned traders looking to refine their skills further:
Absorption Patterns
Detect absorption events where large players are absorbing selling pressure without significant price movement, indicating potential accumulation zones before breakouts.
Iceberg Orders Detection
Identify iceberg orders hidden within DOM layers by noting repeated small execution patterns at specific price points—often used by institutional players to conceal true order size.
Common Mistakes and How to Avoid Them
Even experienced traders can make errors when using these sophisticated tools:
Overreliance on One Tool
Avoid focusing solely on one aspect like delta without considering context provided by footprint charts or DOM data—a holistic approach yields more reliable results.
Ignoring Market Context
Always consider broader market conditions such as economic events affecting liquidity—order flow tools should complement rather than replace fundamental analysis considerations during volatile times.
Case Study: Successful Implementation of Order Flow Tools
In 2022, an experienced day trader applied order flow techniques across multiple futures contracts during heightened volatility periods associated with geopolitical events impacting commodity prices globally:
- Utilized footprint charts alongside delta readings daily.
- Monitored key support/resistance zones via dynamic changes observed through live updates from Bookmap’s advanced platform.
- Achieved consistent profit growth over six months attributable directly back towards disciplined application leveraging comprehensive integration across all three core elements discussed here today!
Future Trends in Order Flow Analysis
As technology continues advancing rapidly within finance sectors worldwide—with increased adoption rates among retail participants—we anticipate further innovations emerging soon:
- Enhanced machine learning algorithms capable automatically detecting complex patterns previously overlooked human eyes alone;
- Greater integration between traditional charting software platforms;
- Wider accessibility allowing broader audiences benefit powerful insights derived from sophisticated methodologies developed top-tier professionals globally!
Order flow trading remains an invaluable skillset every serious trader should aspire mastering fully if seeking sustained success competitive arenas alike!