You stare at a live graph and feel trapped in a maze of data. You want to track Dogen Crypto, but you freeze at each metric. Here is one fact, DOGEN is a meme token on the Solana network. Fans love the playful dog theme and the coin’s bright community vibes, which many spot on Solana.
This guide shows you how to read a market cap graph on a Solana wallet or an exchange like Raydium. We break down key data like current price, 24-hour volume, all-time high, and market cap value. Note that different sources may show varying market cap numbers due to timing differences.
You will learn to spot dips and peaks, weigh risk and reward, and make smarter trades. A close look at Dogen crypto volume trends can reveal market shifts. Keep reading.
Key Takeaways
- DOGEN crypto is a Solana meme token priced at $0.0003766 today, with a market cap of $376,670 and a fully diluted valuation of $3.76 million for 10 billion tokens.
- Traders see a 73.55% volume-to-market-cap ratio and 1 billion tokens in circulation (10% of total supply) by reading chart volume bars and token stats.
- The presale runs in 13 distinct stages through Q1 2025; you can track live price, volume, and market cap on Raydium, Binance, TradingView, CoinGecko, or Solana RPC feeds.
- Use moving averages, RSI, and support/resistance lines to spot buy and sell points—watch for the $0.002 USD support level—and link your wallet to claim and stake tokens after the presale.
Understanding the Dogen Crypto Marketcap Chart

Fire up the chart platform, and watch Dogen’s marketcap light up in real-time data on the blockchain network. You can gauge digital asset flows, follow USD price jumps, and read market volatility in a blink.
The value shown on the chart is a snapshot of how traders feel in the moment. It tells a story of demand and supply that changes fast. Watching this number can help you set your own trading pace.
How to Read the Chart
This section shows you how to read the Dogen crypto market valuation chart. It helps you spot shifts in price, volume, supply, and token stats. Look for markers like volume spikes and moving averages that highlight when the coin might be set for a change.
- Observe the USD price scale; it acts like a thermometer, showing $0.0003766 per token today. It tells you if the price trend is heating up or cooling down.
- Check the time axis; it works like a timeline, from the presale kickoff through Q1 2025. This lets you spot surges when the Dōgen crowd piled in and track the memecoin buzz.
- Examine the volume bars below; they mark trade swings and transaction spikes. A 73.55% volume-to-market cap ratio hints at active trading activity.
- Follow the marketcap curve; it sits at $376,670 in USD. This line sums up total asset value and offers a quick look at token health.
- Spot the FDV line at $3.76 million; it projects the full value for all 10 billion tokens. This helps you see the bigger picture of the token supply’s future.
- Use moving averages on TradingView or CoinGecko. These smooth out sharp jumps, and RSI on CoinMarketCap charts can flag overbought or oversold moments.
- Read the supply widget; it logs 1 billion tokens in play, which is 10% of the total supply. This data point is verified by blockchain feeds.
- Watch support and resistance lines; they mark key floors and ceilings. They help set entry and exit points during wild price swings.
For new traders, grasping basic crypto ideas is very useful. Study market risk, price swings, and token flow. Short examples show how shifts in volume and price can change a token’s value. Some charts even use RSI to signal buying chances.
Advanced traders can check trends across several technical charts. Using more than one tool can back up what you see. Comparing data on Raydium, Binance, and TradingView gives you a fuller view.
Tracking Dogen’s Live Price and Market Trends
Readers get real data fast. We keep you in the loop. Live prices can shift by small amounts, and you will see DOGEN crypto trade near $0.0003766 with bursts of volume on busy days.
| Tracker | Channel | Key Metric |
|---|---|---|
| Centralized Site | Binance, Coinbase Pro | Live Price, 24h Volume |
| Decentralized App | Raydium, Jupiter | Swap Rate, Volume Shifts |
| Chart Widget | TradingView, CoinGecko API | Price History, Marketcap Trend |
| Websocket Feed | Solana RPC, Custom Bot | Real-Time Quotes |
| Alert Tool | Telegram Bot, Email | Price Threshold, Cap Moves |
Tips for Using Marketcap Charts for Investment Decisions
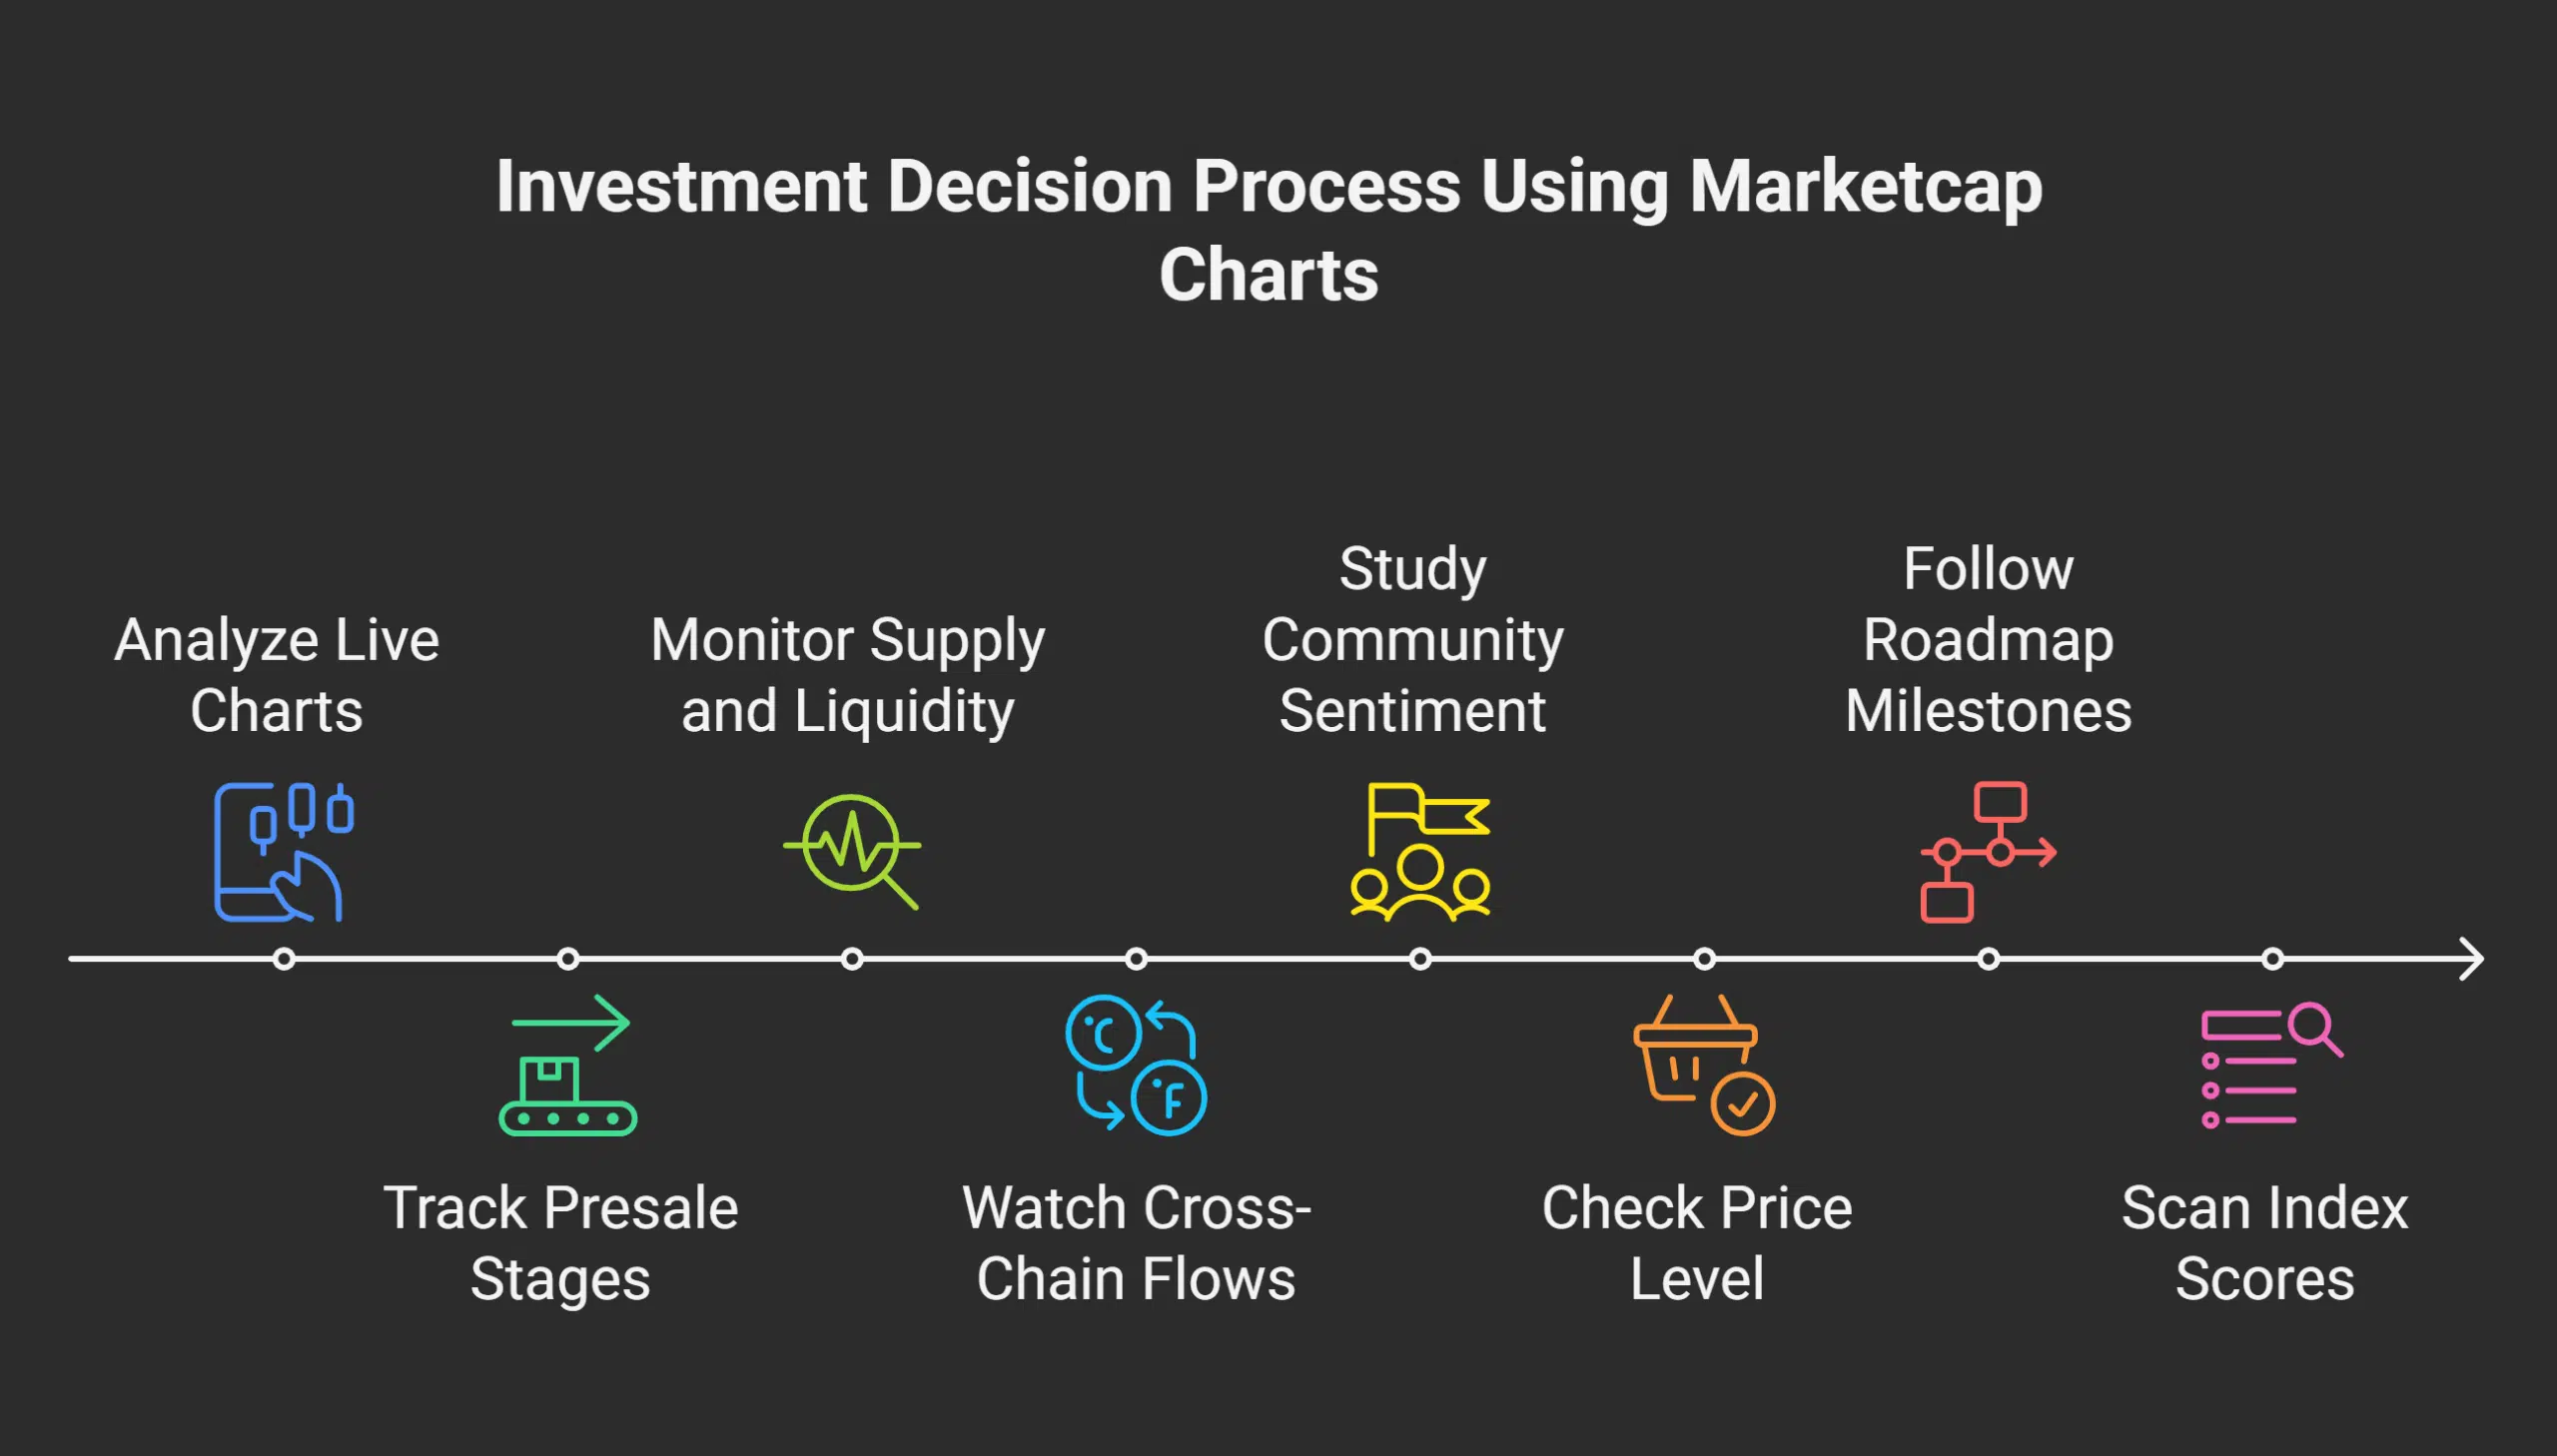
Live charts on CoinMarketCap can guide your moves in Dogen crypto price shifts. Chart volume bars help you see changes in memecoin demand. The presale runs in 13 stages; you can watch each phase on the presale widget. Technical indicators like moving averages and RSI help cut through the noise.
Chart supply and liquidity on SpyWolf, Cyberscope, and SmartState to catch sudden dips. Watch Ethereum and Solana flows for signs of cross-chain moves. Data differences across feeds are common; comparing numbers from Solana RPC and CoinGecko builds a clearer picture.
Study sentiment in the Dogen crypto Army chat for clues on community mood. Check if the $0.002 support level holds firm. Link your wallet to claim tokens, and staking options open after the presale. Small shifts in these numbers can affect your entry, so keep an eye out.
Follow roadmap steps like platform launch and token audit to time your moves. Look at index scores and exchange listings to widen your view of the market. Multiple data points add up to a smart plan.
Mastering the market cap chart gives you a real edge. You can track price swings, token supply, and overall market cap on your favorite platform. Whether you use Raydium or Binance, live stats help you spot trends fast.
Crypto traders can grab the moment, play it safe, or ride the wild swings with calm. Keep your eyes on the chart, watch the trading volume, and let the data guide your moves.
Informational Gain
Different sites may show slightly different numbers for the same token. For example, market cap values for DOGEN crypto are reported anywhere from about $211K to $526K. These differences can come from update lags or different ways of calculating supply and price.
Meme tokens like DOGEN are known for fast swings and high risk. The mixed data on weekly gains and drops shows that volatility is part of the package. Checking several sources and setting clear stop points can help you act wisely. Use these insights to make decisions that match your risk play.
FAQs on Dogen Crypto
1. What is Dogen Crypto?
Dogen Crypto is a meme token that jumped into the crypto era. It sprang from an Internet meme. It rides on a blockchain platform, alongside other cryptocurrencies like Bitcoin. It hit the charts hard after the end of the presale.
2. How do I read the marketcap chart?
The chart shows statistics on dogen’s price today. Each bar marks a moment in time. Some bars look like a cigar shape and signal calm trades. You can line them up next to Bitcoin stats. This view helps you spot shifts in the crypto landscape.
3. Why do fans call Dogen the one and only alpha?
Fans call Dogen crypto the one and only alpha. Alpha means a fresh tip for big gains. The team shared stats since the end of the presale. They show full transparency from day one. That made the alpha tag stick in meme culture. The community buzz adds to the excitement and keeps traders watching.
4. How can I earn passive income with staking options?
Just lock your dogen tokens in a staking option. The pool then pays extra tokens back to you. This gives you passive rewards and thrills any enthusiast. The staking model is a common way to earn in crypto.
5. Is investing in Dogen crypto risky, and what about regulatory rules?
All cryptocurrencies, including meme tokens, carry risk. Dogen’s value may jump or drop in a blink. Crypto laws differ by place, and rules can change fast. Check the latest guidelines and market data before investing.