
A device’s nameplate tells you what it is rated to handle. It does not tell you how much electricity it used during a typical office week. A printer may spend most of its time waiting for a job; a desktop may keep drawing power long after everyone leaves. A small office device energy log makes those differences visible before you change settings or buy new controls.
Start with six measurements: active power, ready-idle power, sleep power, plugged-in off power, hours spent in each state, and actual kilowatt-hours (kWh) over a defined period. The first five help explain the sixth. They also reveal which change is worth testing. For a broader investment decision, compare the result with other low-cost technology upgrades that can be measured.
Set the Boundary Before You Measure
Give each log entry a device ID, location, meter boundary, and start and end dates. “Printer near reception” is more useful than “printer”; “desktop plus monitor on one metered strip” is a group measurement, not a reading for either item alone. Note the relevant settings and whether the week included a holiday, unusual workload, or extended hours.
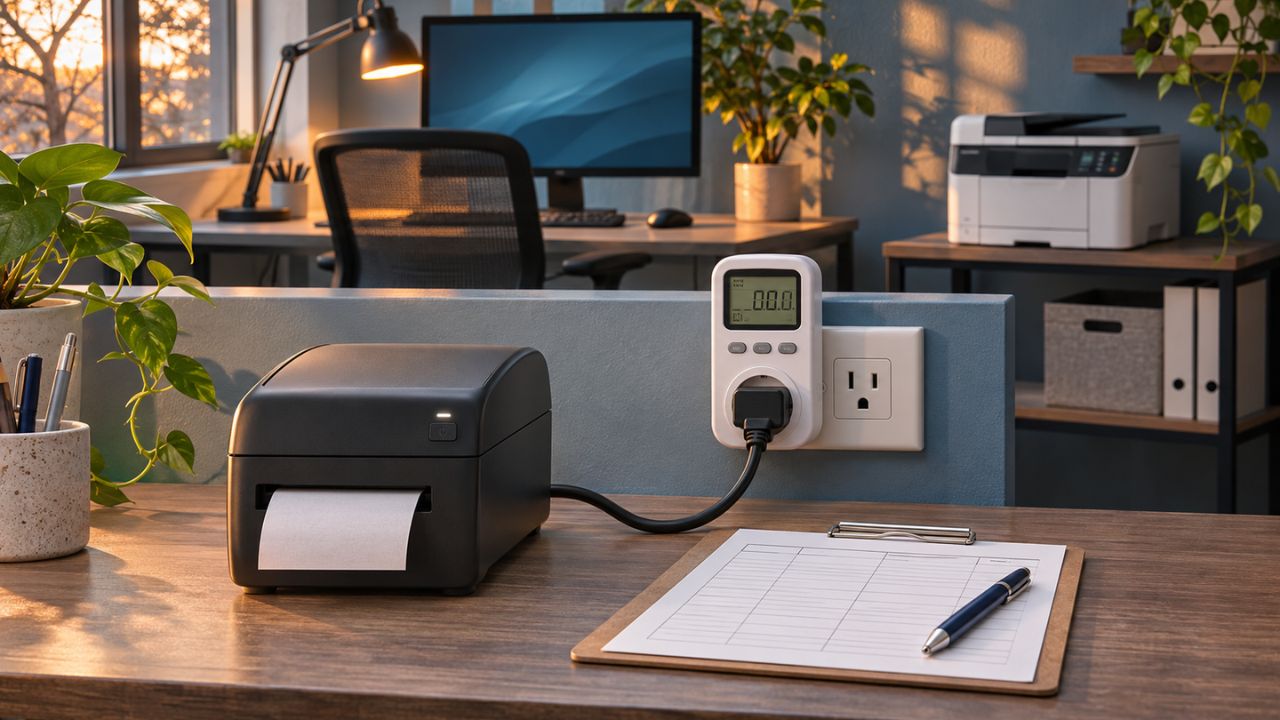
For a plug-in device, use a meter or energy-monitoring plug compatible with the local outlet, voltage, and expected load. Arrange the connection without an overloaded strip or exposed wiring. Coordinate with the person responsible for the equipment before interrupting a workstation, printer, network device, or anything that must stay on. Hardwired equipment belongs with a qualified facilities or electrical professional.
The National Renewable Energy Laboratory’s office plug-load guidance recommends metering across at least a full workweek and comparing business with nonbusiness hours. A brief reading can help identify a power state, but a full week is much better for identifying use patterns.
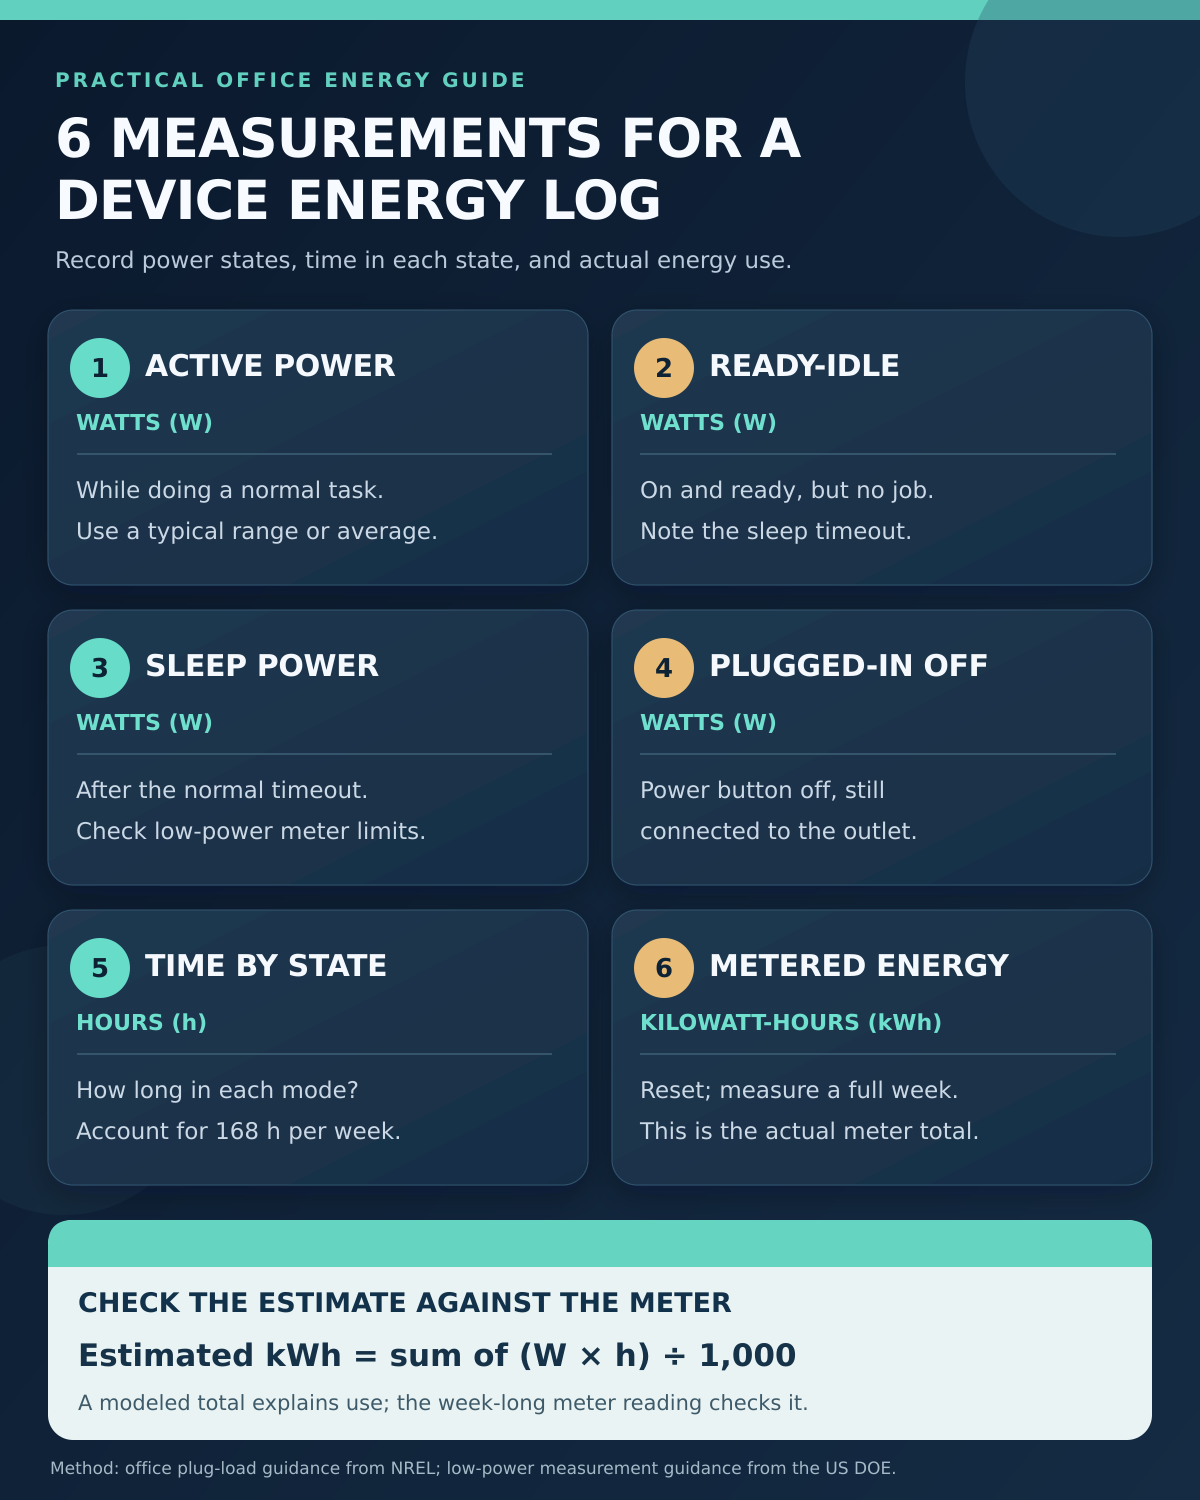
1. Active Power While the Device Does Its Job
Record power in watts (W) during a representative task: a normal editing session, a typical print job, or a video call on the usual workstation. Write down the task and take several readings if the display fluctuates. The highest instant you happen to see is not necessarily the device’s typical active power.
For equipment that cycles sharply, such as a laser printer, note both the usual active range and the workload. A single minute of printing should not be extrapolated into an entire day of continuous printing. If the meter logs readings, use the average for the relevant active intervals when estimating energy.
2. Ready-Idle Power While It Waits
Measure the device when it is powered on and ready, with no active job. Wait until startup activity ends and record the wattage before any automatic sleep timer activates. A printer that remains ready for hours or a desktop left on at lunch can consume more over the week in this state than during short bursts of work.
Record the timeout setting alongside the reading. If two otherwise similar devices have different idle schedules, the setting may explain more than the hardware model. Keep ready-idle separate from sleep; combining them hides the effect of power management.
3. Sleep Power After the Timeout
Let the device enter its normal sleep state and measure its wattage there. Do not assume a dark screen means the entire computer is asleep: a monitor and computer can enter low-power states at different times. If they share one meter, label the result as the combined setup.
Low readings need care. Some consumer meters cannot resolve a fraction of a watt reliably. Record “below meter resolution” when that is what the instrument shows, instead of changing it to zero. For devices with fluctuating low-power draw, average over a longer interval. A smart plug that reports energy use can help with a useful trend, provided it is rated for the load and its reporting is clear enough for the decision.
4. Plugged-In Off Power
Use the device’s normal power control to switch it off while leaving it plugged in, then measure any residual draw. “Off” on the front panel is not always electrically the same as unplugged. The US Department of Energy’s standby-power guidance explains why a device can still draw power when it appears off, and why low-power measurements require an adequately sensitive meter.
This reading is useful only if the state actually occurs in your office routine. Do not cut power to a running computer or printer just to force a zero reading. Network gear, security equipment, backup devices, and systems that perform updates or maintenance may have a reason to remain powered. The log should describe what happens now before anyone designs a shutoff rule.
5. Hours Spent in Each Power State
Watts describe a rate; hours describe how long that rate persists. For one device measured across a seven-day week, the hours assigned to active, ready-idle, sleep, and plugged-in off states should add up to 168. An unplugged interval can be recorded separately at zero device draw if it is part of the real schedule.
Use a meter with time-stamped readings when available. Otherwise, combine its readings with the actual work schedule, sleep timeout, and a short observation of how staff use the device. Mark estimated hours as estimates. A 24-hour router and a weekday-only desktop should not be given the same schedule. If a device has another meaningful state, such as charging or maintenance, add it to the notes and calculation rather than forcing it into the wrong category.
6. Metered Kilowatt-Hours for the Whole Week
Reset the meter’s cumulative energy reading at the beginning of a representative week and record its kWh reading at the end. This is the measured total within the meter boundary. It captures changing loads across the week better than multiplying one snapshot wattage by 168 hours.
Use the state readings and hours as an explanation or cross-check, not as a replacement for the meter total. If the two disagree, check for missed activity, charging, overnight updates, incorrect state hours, an unusual week, or a meter that struggles at low loads. Note the difference; do not silently adjust the meter reading to make the calculation match.
A Worked Example for One Desktop
The following numbers are entirely illustrative. They are not measured results for a real office or a typical desktop. They show how to make a rough weekly estimate from four power states.
| State | Illustrative power | Illustrative hours per week | Estimated energy |
|---|---|---|---|
| Active | 80 W | 18 h | 1.440 kWh |
| Ready-idle | 35 W | 22 h | 0.770 kWh |
| Sleep | 4 W | 88 h | 0.352 kWh |
| Plugged-in off | 1 W | 40 h | 0.040 kWh |
| Total | — | 168 h | 2.602 kWh |
The calculation is (80 × 18 + 35 × 22 + 4 × 88 + 1 × 40) ÷ 1,000 = 2.602 kWh. Enter the actual metered kWh in a separate column of your log. A difference is a reason to inspect the schedule and workload, not evidence that either number must be discarded. Keep the number of identical devices separate; multiply a per-device estimate only when their settings and use patterns are reasonably comparable.
Turn the Log Into One Testable Change
Look first for a state that lasts a long time and has a meaningful gap to a lower-power state. In the illustrative example, changing 50 weekly hours from 35 W ready-idle to 4 W sleep would reduce the modeled energy by (35 − 4) × 50 ÷ 1,000 = 1.55 kWh per week. This is an estimate, not a promised saving. Verify the new setting over another comparable week and compare actual metered kWh before claiming a result.
For an office-wide plan, the ENERGY STAR checklist for office equipment recommends enabling computer power management and printer sleep settings. The wider sustainable office guide covers other workplace choices after the device-level readings show where attention belongs. If you convert kWh into money, use the applicable local energy rate and account for tariff features; a lower device total does not automatically reduce every fixed or demand-based charge on a bill.
Keep the Small Office Device Energy Log Honest
Keep the raw meter total, the measurement dates, and the assumptions behind the state hours. Note changes in staffing, workload, settings, and equipment before comparing weeks. One useful log is enough to decide whether to adjust a sleep timer, investigate an always-on setup, or leave a low-draw device alone. The value comes from checking the next week against the first, not from filling every cell with a guess.