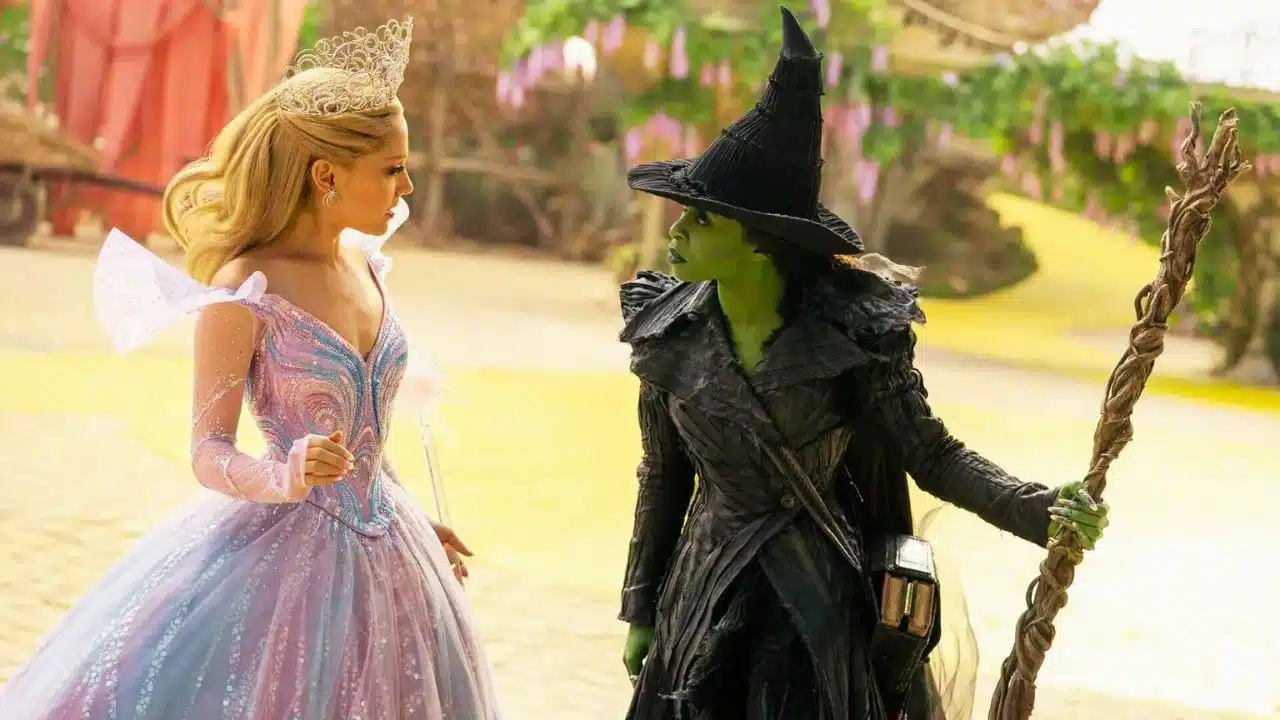
Universal’s Wicked: For Good has stormed the North American box office with an estimated $150 million opening weekend, delivering a record-smashing launch for the concluding chapter of the hit Broadway musical adaptation. Studio estimates put its global debut at about $226 million, underscoring both intense fan demand and the enduring appeal of the Oz saga one year after the first film’s release.
Record-Breaking Opening Weekend
According to studio and industry estimates, Wicked: For Good collected $150 million from 4,115 theaters in the U.S. and Canada across its first three days in release. That figure includes robust preview grosses earlier in the week and easily tops the $112.5 million domestic opening of 2024’s Wicked.
The sequel’s performance secures several milestones:
- Biggest opening ever for a Broadway musical adaptation, surpassing the first Wicked.
- Second-largest domestic opening of 2025, behind only A Minecraft Movie (about $162–163 million).
- One of Universal Pictures’ strongest openings in studio history, second only to tentpoles like Jurassic World in some tallies.
IMAX and premium formats played a notable role. IMAX screenings alone contributed about $15.5 million, or roughly 11% of the domestic haul, setting a new November record for the large-format exhibitor.
Global Debut Hits $226 Million
Overseas, Wicked: For Good added roughly $76 million to its North American start, pushing the worldwide opening to $226 million. That puts the film comfortably ahead of the first installment’s global launch and reinforces the franchise’s strength in key international territories.
Box office trackers and studio executives are treating the debut as a rare bright spot in a choppy fall marketplace, noting that the film’s performance helps stabilize theatrical receipts heading into the U.S. Thanksgiving corridor.
Beating Its Predecessor
The new film arrives barely a year after the first Wicked movie turned the long-running stage hit into a modern box office powerhouse. That film opened to $112.5 million domestically and went on to gross about $475 million in North America and $759 million worldwide, becoming the highest-grossing stage musical-to-screen adaptation on record.
Wicked: For Good not only outpaced that debut by more than 30% in North America, it also improved on the original’s global start, a sign that awareness and anticipation grew between installments rather than fading.
Industry analysts note that the back-to-back success validates Universal’s risky decision to split the Broadway property into two large-scale films shot consecutively, a strategy that demanded significant upfront spending but allowed the studio to maintain momentum with audiences.
Audience Profile and Reception
Exit polling suggests that women once again powered the opening, accounting for roughly 71% of ticket buyers, mirroring the first film’s female-skewing audience. According to Screen Engine/Comscore’s PostTrak, about 83% of viewers said they would “definitely recommend” the sequel, a slightly higher endorsement rate than the original.
Audience scores skew strongly positive. The film earned an “A” CinemaScore, indicating strong word-of-mouth potential heading into the Thanksgiving holiday frame. While critics have been more divided—various reports describe the reviews as “mixed” to “somewhat mixed”—the strong recommendation metrics and social buzz suggest that fan enthusiasm is overwhelming any critical hesitations.
Social media analytics firm RelishMix measured around 1.3 billion social media impressions around the release, highlighting especially intense engagement around Ariana Grande’s performance as Glinda, which many online commentators have called “scene-stealing” and even “Oscar-worthy.”
The Power of Event Musicals in a Post-Pandemic Market
The back-to-back success of the Wicked films is being closely watched across Hollywood as studios continue to test what kinds of projects can draw large, reliable audiences in the post-COVID theatrical landscape. Analysts point to several factors driving Wicked: For Good’s outsized debut:
- A built-in Broadway fanbase cultivated over decades.
- Star power, led by Ariana Grande and Cynthia Erivo, and supported by returning ensemble cast members.
- A long, carefully managed marketing campaign that spanned trailers, music teases, talk-show performances and heavy social media promotion, culminating in a blitz timed to the holiday corridor.
- The cliffhanger structure of the first film, which effectively pushed audiences toward the conclusion.
ComScore and other trackers estimate that about 2 million more people attended Wicked: For Good’s opening weekend compared to Wicked, illustrating how audience interest actually expanded between installments.
Outlook: Can the Sequel Match the First Film’s Legs?
The key question now is how well Wicked: For Good will hold in the coming weeks. The first Wicked displayed strong staying power, eventually reaching $474.9 million domestically off a $112.5 million opening. Early indicators—high CinemaScore, strong recommend rates, and robust family turnout over a holiday period—suggest that the sequel could follow a similar pattern, barring sharp competition from other family and musical titles.
Some analysts caution that major fan-driven openings can be frontloaded, especially when driven by pre-sales and hardcore devotees, but the studio and exhibitors are betting that cross-generational appeal, school holidays, and repeat viewing will help sustain grosses beyond the first weekend.
Regardless of its ultimate total, Wicked: For Good has already cemented itself as one of the defining box office stories of 2025, reaffirming the commercial viability of big-budget musicals when they combine recognizable IP, star casting, and event-level marketing.