
Ever wonder why a website feels fast on a desktop but struggles to generate leads? Real-world visitors rarely browse on high-speed office networks. Instead, they encounter heavy images, render-blocking scripts, and sluggish server responses on mobile devices. This frustrating user experience demonstrates exactly how Page Speed Affects SEO Rankings. When pages drag, bounce rates spike, and search engines take notice, pushing the site down the results.
To stop losing valuable traffic, it is crucial to focus on the performance metrics that actually matter. By identifying specific bottlenecks, websites can quickly recover lost visibility. Discover which practical fixes move the needle first, enabling strategic optimization without any guesswork. Ultimately, fast pages keep visitors engaged, and engaged visitors drive real growth.
What Is Page Speed?
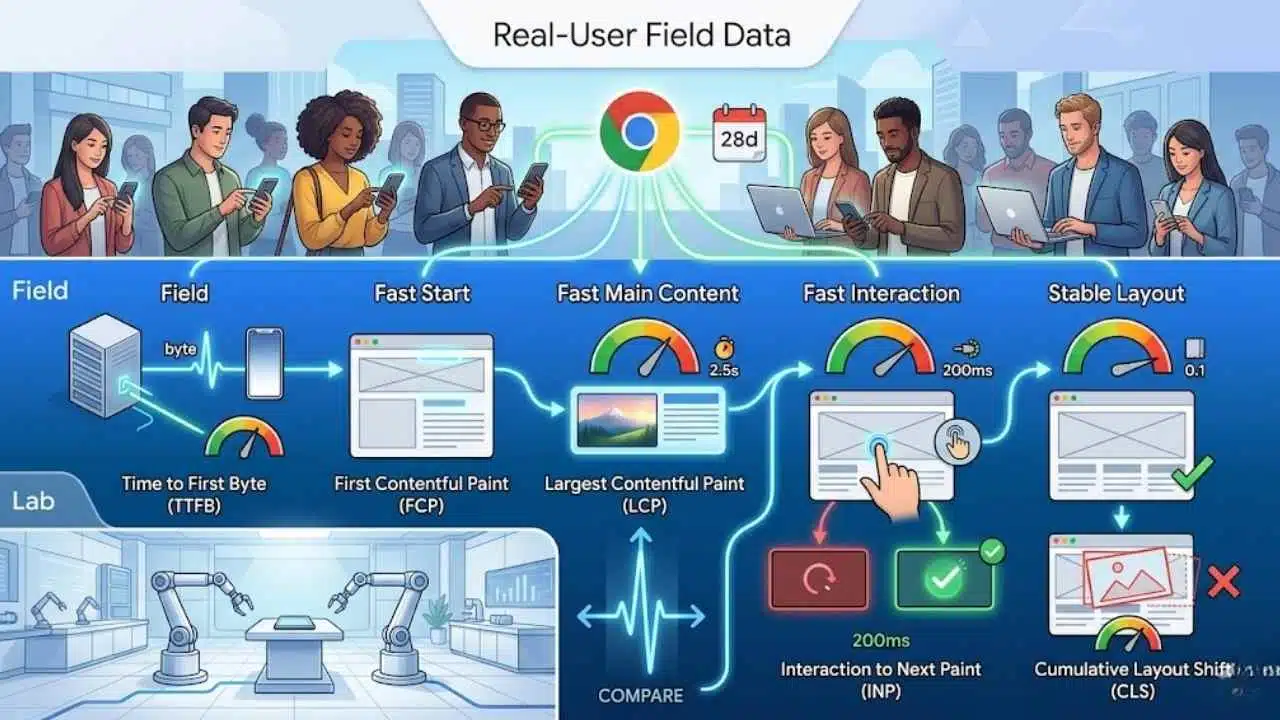
Page speed is the real-world speed of a page from first byte to first usable click. It covers how fast the server responds, how quickly the main content appears, and whether the page stays stable while it finishes loading.
That is why a page can look “loaded” and still feel slow. If the hero image arrives late, the layout jumps, or a tap does nothing for a moment, visitors still experience that as poor website performance.
Google PageSpeed Insights helps you see both sides of the story. Its lab data is useful for debugging in a controlled test, while its field data comes from the Chrome User Experience Report over the previous 28 days, which is much closer to what real visitors felt.
- Time to First Byte: how long it takes the first byte of HTML to arrive. If this is slow, every other metric starts late.
- First Contentful Paint: when the first visible text or image appears.
- Largest Contentful Paint: when the main content shows up.
- Interaction and stability: interaction to next paint measures responsiveness, and cumulative layout shift measures unexpected movement.
If you want a simple definition, think of page speed as four things working together: a fast start, fast main content, fast interaction, and a stable layout.
How Does Page Speed Affect SEO Rankings?
Page speed affects SEO in two ways. First, Google uses Core Web Vitals in its ranking systems. Second, slow pages damage user experience, which means more bounces, fewer conversions, and less engagement with your content.
Google’s Algorithm and Page Speed as a Ranking Signal
Google has treated speed as a ranking factor for years, first on desktop and later on mobile. In Google’s current page experience guidance, it says Core Web Vitals are used by ranking systems, but it also makes clear that relevance still comes first.
That is the nuance many articles miss. A fast page with weak content will not outrank a stronger page just because it scored well in Lighthouse, but a slow page can lose visibility when several pages are similarly helpful.
- Fix page types, not random URLs: Search Console groups similar pages by the weakest metric, which helps you repair templates that affect dozens or hundreds of pages at once.
- Start with high-value pages: service pages, top blog posts, category pages, and lead forms usually deliver the fastest SEO and revenue gains.
- Do not treat AMP as a shortcut: accelerated mobile pages (AMP) can still be fast, but AMP itself is not a ranking factor and it is no longer required for Top Stories.
Impact on User Experience and Engagement
Readers do not experience “technical SEO.” They experience hesitation, jumpy layouts, and buttons that seem to ignore them.
A 2020 Google-commissioned Deloitte study of 37 brands across Europe and the US found that even a 0.1-second mobile speed improvement lifted business results across multiple industries, including an 8.4% conversion increase in retail and a 10.1% increase in travel. That is why speed work belongs on the revenue roadmap, not just the developer backlog.
Small speed gains can create real business gains, especially on pages close to signup, checkout, or lead capture.
If your bounce rate is high on landing pages, slow page load speed is one of the first things worth checking. A page that feels sluggish usually loses trust before it earns attention.
Mobile vs Desktop Page Speed Importance
Mobile speed deserves the first round of fixes, because Google announced on October 31, 2023, that the move to mobile-first indexing was complete. For almost every site, Google now uses the smartphone version of your content for indexing and ranking.
Desktop still matters for conversions and desktop search visibility. Still, if you have to choose where to start, fix mobile first and make sure the mobile page contains the same primary content, images, metadata, and structured data as desktop.
| Area | Mobile | Desktop | What to do |
|---|---|---|---|
| Indexing | Google’s smartphone crawler is the main view of your site. | Desktop content still matters, but it is not the primary crawl model for most sites. | Keep content parity between mobile and desktop. |
| Networks | Phones often deal with weaker connections and higher latency. | Connections are often faster and more stable. | Compress assets and trim requests for mobile first. |
| Hardware | Lower-powered CPUs make JavaScript problems more obvious. | Heavier scripts can be hidden by stronger hardware. | Reduce JavaScript work, not just file size. |
| Images | Oversized hero images slow largest contentful paint quickly. | They still hurt, but the pain is often less visible. | Serve responsive images and keep the hero lean. |
| Lazy loading | Bad lazy loading can hide important content from users and crawlers. | The same risk exists, but mobile suffers more from delays. | Do not lazy load primary content on user interaction. |
| Testing | Mobile reports expose the weakest real-world experience. | Desktop reports help confirm broader stability. | Check both, but prioritize the mobile report first. |
Core Web Vitals and Their Role in SEO
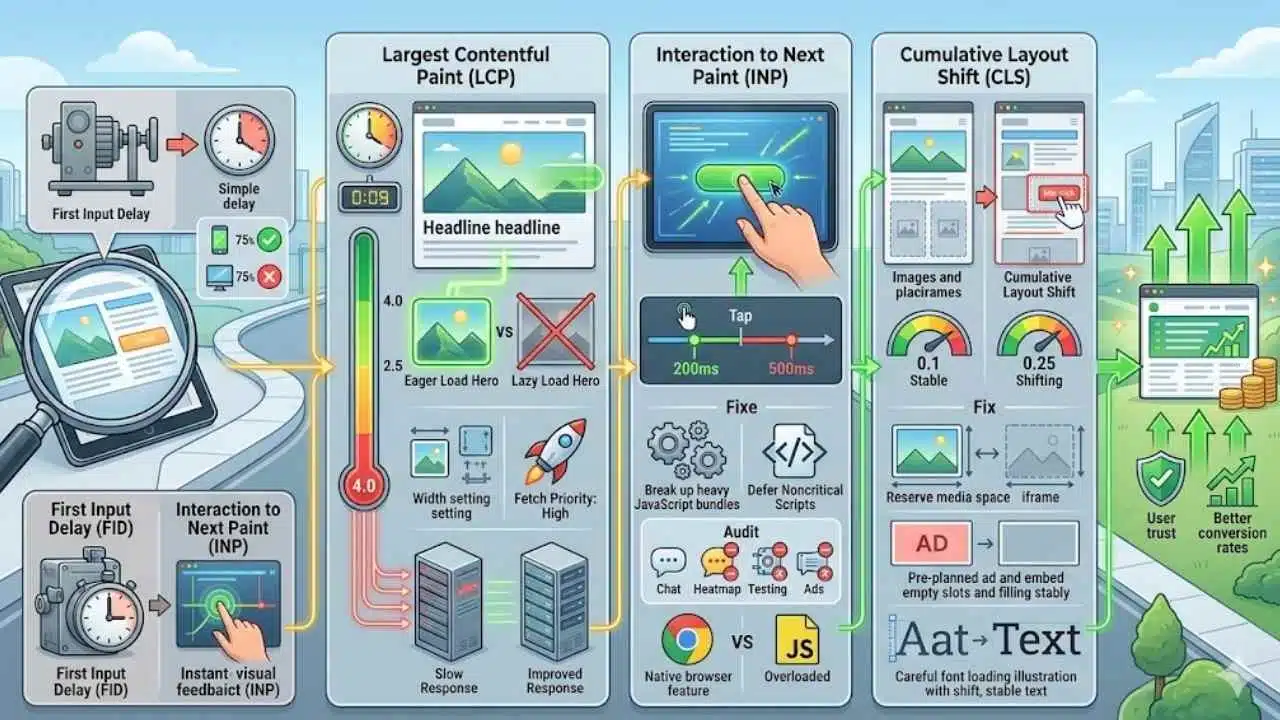
Core Web Vitals give Google and site owners a shared way to judge real page experience. The three current metrics are largest contentful paint (LCP), interaction to next paint (INP), and cumulative layout shift (CLS).
If you want a quick benchmark, aim for “good” at the 75th percentile of real visits on both mobile and desktop. That is why a page can pass a single lab test and still fail in Search Console.
| Metric | Good | Poor | What it tells you | Best first fix |
|---|---|---|---|---|
| Largest Contentful Paint (LCP) | 2.5 seconds or less | More than 4.0 seconds | How quickly the main content appears | Improve server response and prioritize the hero image |
| Interaction to Next Paint (INP) | 200 ms or less | More than 500 ms | How responsive the page feels after interaction | Reduce heavy JavaScript and third-party scripts |
| Cumulative Layout Shift (CLS) | 0.1 or less | More than 0.25 | How stable the page stays while loading | Reserve space for images, ads, and embeds |
Largest Contentful Paint (LCP)
Largest contentful paint (LCP) measures when the biggest visible image or text block appears. On many pages, that is the hero image, headline block, or featured content area.
Google’s performance guidance sets a good LCP at 2.5 seconds or less for at least 75% of visits. If your LCP is slow, find the actual LCP element in PageSpeed Insights or Lighthouse first, because you cannot fix what you have not identified.
- Do not lazy load the hero image: above-the-fold images, especially likely LCP candidates, should load eagerly.
- Give the hero image priority: use explicit
widthandheight, keep it in the initial HTML when possible, and usefetchpriority="high"only for the truly critical image. - Lower server delay first: if time to first byte is slow, your LCP starts late before the image request even begins.
First Input Delay (FID) and Interaction to Next Paint (INP)
If you still see first input delay (FID) in older posts, treat it as historical context. Google replaced first input delay (FID) with interaction to next paint (INP) as a Core Web Vital in March 2024, because INP measures responsiveness across the page lifecycle instead of just the first interaction.
A good interaction to next paint (INP) score is 200 milliseconds or less. Pages usually miss that mark because the main thread is overloaded with JavaScript, third-party tags, or long tasks that block the browser from showing feedback quickly.
- Cut long JavaScript tasks: break up heavy bundles, defer noncritical scripts, and remove code that does little real work.
- Audit third-party tags: chat widgets, heatmaps, testing tools, and ad scripts often hurt responsiveness more than your own code.
- Use native browser features first: native lazy loading is often lighter than adding more JavaScript just to lazy load images.
Cumulative Layout Shift (CLS)
Cumulative layout shift (CLS) measures how much the page jumps while loading. Good CLS is 0.1 or less, and poor CLS is above 0.25.
This metric matters because layout shifts break trust. A moving button can cause a bad click on a form, product option, or checkout step, which is one of the fastest ways to damage conversion rate.
- Reserve space for media: set
widthandheighton images and iframes so the browser can lay out the page before files arrive. - Pre-plan ads and embeds: empty slots that suddenly expand are a common CLS problem.
- Load fonts carefully: font swaps can move text, so test them on slower connections, not just your own machine.
Tools to Check and Analyze Page Speed
You do not need one tool. You need one tool for real-user signals, one for controlled debugging, and one for business impact.
This mix keeps you from fixing the wrong thing. A great lab score can hide weak field data, and a conversion dip in analytics can tell you which speed issue deserves attention first.
| Tool | Best for | What it shows | Use it when |
|---|---|---|---|
| Google PageSpeed Insights | Real-user and lab analysis | CrUX field data, Lighthouse lab data, Core Web Vitals, opportunities | You want to see what users felt and what to fix first |
| GTmetrix | Deep debugging | Waterfall, filmstrip, Lighthouse-based audit, location and connection testing | You need to reproduce slow loads in a specific region |
| Pingdom | Synthetic monitoring and RUM | Load history, asset timelines, geography, browser, and platform views | You want ongoing monitoring after launch or redesign |
| Google Analytics | Business impact | Engagement, key events, form submits, purchases, bounce rate trends | You need to prove that faster pages improve conversions |
For larger sites, a bulk scanner such as Experte Bulk Page Speed Test can help surface slow templates quickly. Use it for triage, then confirm priorities with Google’s own data.
Google PageSpeed Insights
Google PageSpeed Insights should be your first stop because it combines field and lab data in one report. If a page has enough Chrome User Experience Report data, you can see what real visitors experienced across the previous 28 days, and if it does not, the tool can fall back to origin-level data.
Use the field data to prioritize what matters for SEO, then use the lab diagnostics to reproduce and fix the issue. If the field panel shows poor largest contentful paint or interaction to next paint but the lab test looks fine, that usually points to real-world device, network, or caching differences.
- Check mobile first: weaker devices and slower networks expose problems fastest.
- Open the Core Web Vitals assessment first: if it fails, start there before chasing lower-value audits.
- Read the opportunities with context: a small byte saving matters less than a slow LCP image or a render-blocking stylesheet in the head.
GTMetrix
GTmetrix is where you go when PageSpeed Insights tells you what is wrong, but you still need to see why it happens in sequence. Its waterfall and filmstrip views make it much easier to spot late hero images, redirect chains, slow third-party scripts, and oversized files.
As of May 2026, GTmetrix lists 22 global test locations and 107 test servers. That makes it especially useful for US businesses with customers spread across the East Coast, Midwest, and West Coast, because one test from a single city rarely tells the whole story.
- Test from the region closest to your customers: A central or eastern US result can look very different from a west coast result if your origin sits in one location.
- Match the connection speed to real visitors: A page that feels quick on unthrottled desktop can still struggle on mobile.
- Save before-and-after reports: That gives you proof when image compression, browser caching, or a CDN cuts load time.
Pingdom
Pingdom is helpful when you want repeat synthetic checks and a simple history of how fast a page loads over time. Its page speed monitoring can run every 30 minutes, and its real user monitoring can break down performance by geography, browser, platform, and connection type.
That combination makes Pingdom useful for ongoing web performance monitoring, especially after a redesign or hosting change. If one region suddenly slows down, you can often trace it to a cache issue, an origin bottleneck, or a third-party asset that should have been served through a CDN.
- Use synthetic checks for key templates: home, service, category, product, contact, and lead form pages.
- Use real user monitoring for the truth: synthetic tests are consistent, but real-user data shows what visitors actually feel.
- Watch load time and request count together: a page can look fine in seconds and still be bloated with too many requests.
Google Analytics
Google Analytics is not your best Core Web Vitals debugger anymore, but it is still the clearest place to measure business results after a speed fix. In GA4, watch page views, user engagement, scroll depth, form submissions, and purchases before and after performance work.
Google Analytics automatically collects events such as page_view, and GA4 tracks engagement in a way that helps you see whether faster pages keep people active longer. That means you can connect speed fixes to bounce rate, conversion rates, and lead quality instead of arguing about scores alone.
- Mark real business outcomes as key events: quote requests, demo bookings, checkout completion, or newsletter signups.
- Segment by device: mobile gains often show up first.
- Compare landing pages before and after a release: if traffic stays level but engagement rises, your speed work is paying off.
Top Strategies to Improve Page Speed for SEO
If you want faster results, do not start everywhere at once. Start with the elements that most often control largest contentful paint, interaction to next paint, time to first byte, and repeat-visit speed.
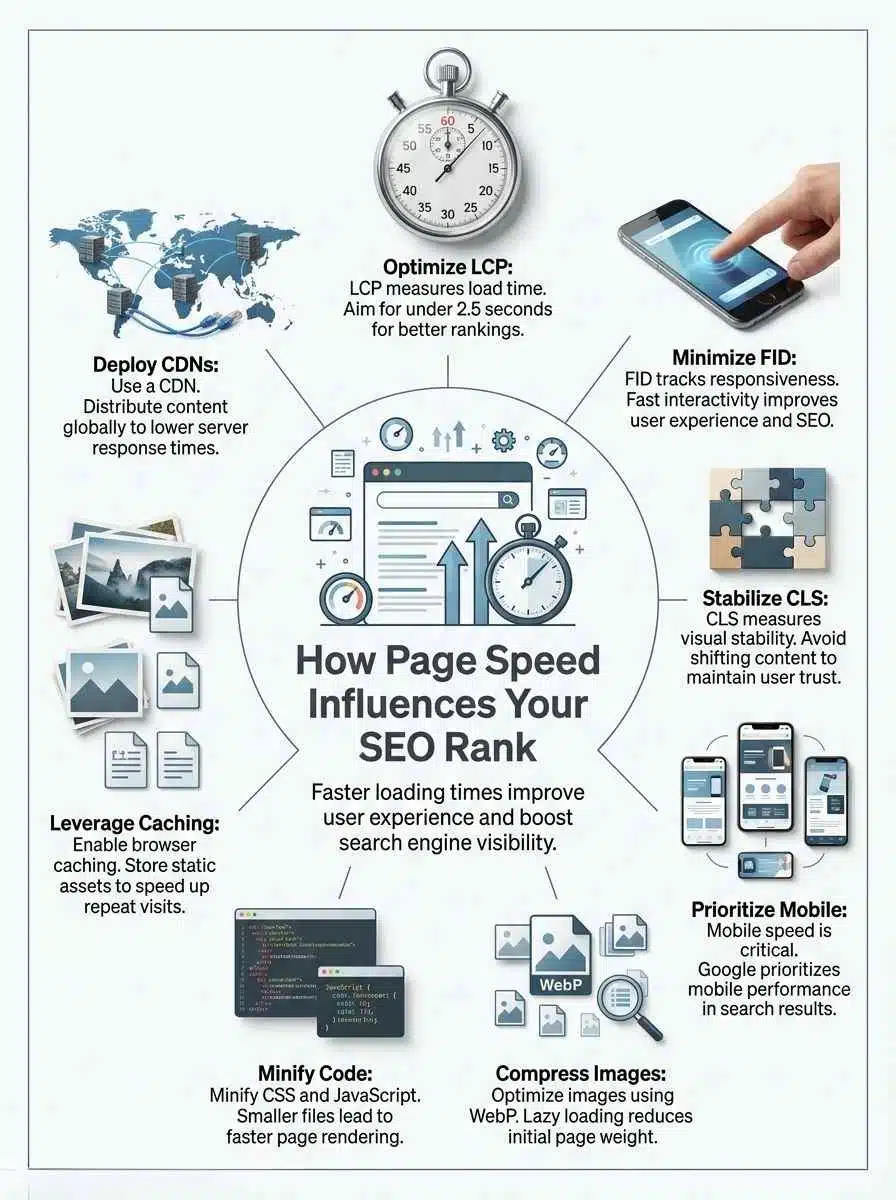
The best fixes tend to be simple and measurable: smaller images, less JavaScript, smarter browser caching, faster server response, and a CDN that serves assets closer to your audience.
Optimize Images and Use Compression
Images are often the easiest big win because they are frequently the largest files on the page and very often the LCP element. Google’s image guidance says modern formats such as WebP and AVIF can provide better compression than PNG or JPEG, which means smaller downloads and faster rendering.
Start with the hero image, not your icon set. If the hero is oversized, that single file can dominate page speed all by itself.
- Use the right format: WebP is a strong default, and AVIF can shrink many photographic images even further.
- Serve the right size: responsive images with
srcsetstop phones from downloading desktop-sized files. - Set
widthandheight: this helps prevent cumulative layout shift. - Lazy load below-the-fold images only: keep the hero eager so it does not delay largest contentful paint.
- Automate image compression: tools like Squoosh, ImageOptim, and CDN-based image pipelines can keep new uploads from slipping through unoptimized.
Minify CSS, JavaScript, and HTML
Minifying code helps, but the bigger win is usually shipping less code in the first place. Lighthouse now flags render-blocking requests, and Chrome DevTools can show how much CSS and JavaScript a page downloads but never uses during the initial load.
If a script sits in the head without defer or async, it can block first paint. That slows first contentful paint, time to interactive, and often interaction to next paint on script-heavy pages.
- Remove unused code before you minify: Dead code savings are usually bigger than whitespace savings.
- Defer noncritical JavaScript: Keep only the code needed for first render and early interaction.
- Inline critical CSS for the first viewport: Load the rest after the initial paint.
- Watch third-party scripts closely: One chat widget or testing script can outweigh all your minification work.
Leverage Browser Caching
Browser caching speeds up return visits by saving files locally instead of downloading them again. Google’s performance guidance points to response headers like Cache-Control, ETag, and Last-Modified as the core controls that decide how well HTTP caching works.
A simple pattern works well for most sites: give versioned CSS, JS, fonts, and images a long cache life, but keep HTML on a shorter leash so content updates still appear quickly.
- Use hashed filenames for static assets: this lets you cache them for months without serving stale files after a deploy.
- Set explicit headers: if you omit
Cache-Control, browsers may still cache, but they make the rules, not you. - Keep HTML fresher than assets: the page shell changes more often than a versioned stylesheet or image.
- Pair browser caching with image optimization and a CDN: first visits get lighter files, and repeat visits skip many requests.
Reduce Server Response Time
Time to first byte measures the gap between navigation starting and the first byte of the response arriving. Because it happens before the browser can render meaningful content, slow TTFB drags every other performance metric behind it.
If your site speed is poor even after front-end cleanup, the bottleneck is often at the origin: slow hosting, too much app logic before HTML is served, uncached database queries, or redirect chains that add extra round trips.
- Turn on full-page or fragment caching where it makes sense. That reduces repeat work on busy pages.
- Trim redirect chains. Every extra hop adds delay before the first byte appears.
- Profile database queries and APIs. One slow query can sink the whole page.
- Use HTTP/3 if your host or CDN supports it. It can reduce connection overhead and improve reliability on mobile networks.
- Add load balancing for traffic spikes. If speed collapses during campaigns, the problem may be capacity, not front-end code.
Use a Content Delivery Network (CDN)
A CDN puts static assets on edge servers closer to your visitors, which cuts latency and reduces strain on your origin. For a US audience, that usually means a faster experience for visitors far from your main server, especially if your origin sits on one coast and your traffic is national.
Services like Cloudflare, Akamai, Fastly, and Amazon CloudFront solve the same core problem in different ways: they shorten the distance between the user and the file. The biggest gains usually show up on images, scripts, fonts, and cacheable HTML.
| CDN task | Why it helps | Best pages to start with |
|---|---|---|
| Edge caching | Reduces repeated trips to the origin | Home, landing, and campaign pages |
| Image delivery | Improves largest contentful paint and cuts bandwidth | Product, blog, and gallery pages |
| Brotli compression | Shrinks CSS, JavaScript, and HTML responses | Every template |
| HTTP/3 support | Improves delivery on lossy mobile networks | Mobile-heavy traffic |
Before you call a CDN done, test from several locations in GTmetrix or Pingdom. A CDN works best when it is paired with long-lived cache headers, smaller files, and a fast origin that can still answer cache misses quickly.
Final Thoughts
Page speed is not a vanity metric. It shapes user experience, Core Web Vitals, rankings, and conversion rate. Start with your highest-value pages, run them through Google PageSpeed Insights and Search Console, then fix the issues that hurt LCP, INP, CLS, and time to first byte first.
Do that well, and page speed becomes one of the simplest ways to strengthen SEO and grow your business.
Frequently Asked Questions (FAQs) About How Page Speed Affects SEO Rankings
1. What is the link between page speed and SEO rankings?
Search engines use page speed as a ranking signal, so slow pages can fall in search results. Fast pages help your seo (search engine optimization), they reach more people.
2. Why does speed matter to users?
People expect pages to load fast, and they will bail like in a slow checkout line if a site drags.
3. How do I test and fix page speed?
Use simple speed test tools to check load time, they tell you where the slow bits are. Compress images, cut unused scripts, and use caching to make pages load faster. These fixes boost user time on site, and they help your seo (search engine optimization).
4. What is a good target for page load time?
Aim for under three seconds, faster is better, try to hit one to two seconds on both phone and computer.