As of January 2026, China has officially shattered global records with a $1.2 trillion trade surplus for 2025. This figure is not just a statistic; it represents a fundamental rewiring of the global economy. While Chinese factories have achieved “Electrostate” dominance—controlling the flow of the world’s green energy hardware—its domestic economy remains trapped in a deflationary spiral. This combination of export dominance and weak domestic demand is the essence of China’s Electrostate Deflation. This dangerous divergence between hyper-efficient exports and anemic domestic consumption is the single most critical economic fault line of 2026.
Key Takeaways
- The “Electrostate” Reality: China has effectively become the OPEC of the green transition. By dominating the “New Three” (EVs, Batteries, Solar), it now controls the essential hardware for global decarbonization.
- The Two-Speed Economy: While export volumes are booming, domestic producer prices (PPI) have been in deflation for 39 consecutive months, signaling chronic overcapacity.
- The Great Reroute: US tariffs have worked to reduce direct bilateral trade (-20%), but China has successfully pivoted to the “Global South,” with exports to Africa and ASEAN surging by double digits.
- The Wealth Effect Crisis: With 70% of household wealth tied to a crashing real estate market, Chinese consumers are in a liquidity trap, saving at record rates despite government pleas to spend.
The Trillion-Dollar Divergence: Anatomy of an ‘Electrostate’
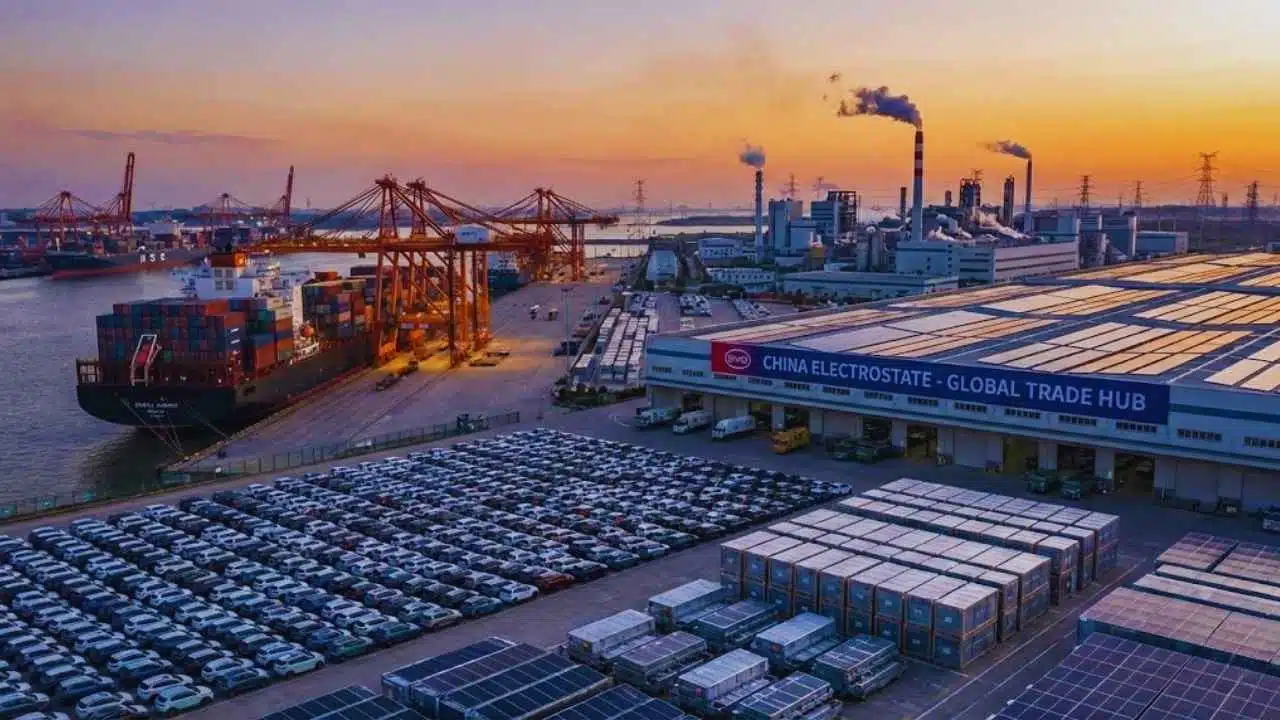
China has transitioned from being the “World’s Factory” of cheap trinkets to the “Electrostate”—a superpower defined by its monopoly on the electron economy. In 2025, China didn’t just export goods; it exported the infrastructure of the future.
The $1.2 trillion surplus is fueled by the “New Three” industries: Electric Vehicles, Lithium-ion Batteries, and Solar Cells. However, this success is built on a ruthless hyper-efficiency that Western competitors call “overcapacity.” Chinese factories are running at roughly 74% capacity utilization—high enough to flood global markets, but low enough to indicate that domestic demand cannot absorb the supply.
The “New Three” Export Explosion (2025 Data)
| Sector | Export Volume (YoY Growth) | Global Market Share Estimate | Key Insight |
| Electric Vehicles | +30% (approx. 6.5M units) | ~60% of global production | BYD and peers are now outselling legacy auto giants in emerging markets. |
| Lithium Batteries | +25.4% | ~75% of global supply | Prices dropped nearly 50%, making foreign battery startups uncompetitive. |
| Solar Components | +18% | >80% of global supply | China installed more solar in 2025 than the US has in its entire history. |
| Old Economy Goods | +4% (Textiles, etc.) | Declining relevance | Low-margin industries are slowly migrating to Vietnam/India. |
The Hollow Core: Why Factories Hum While Families Save
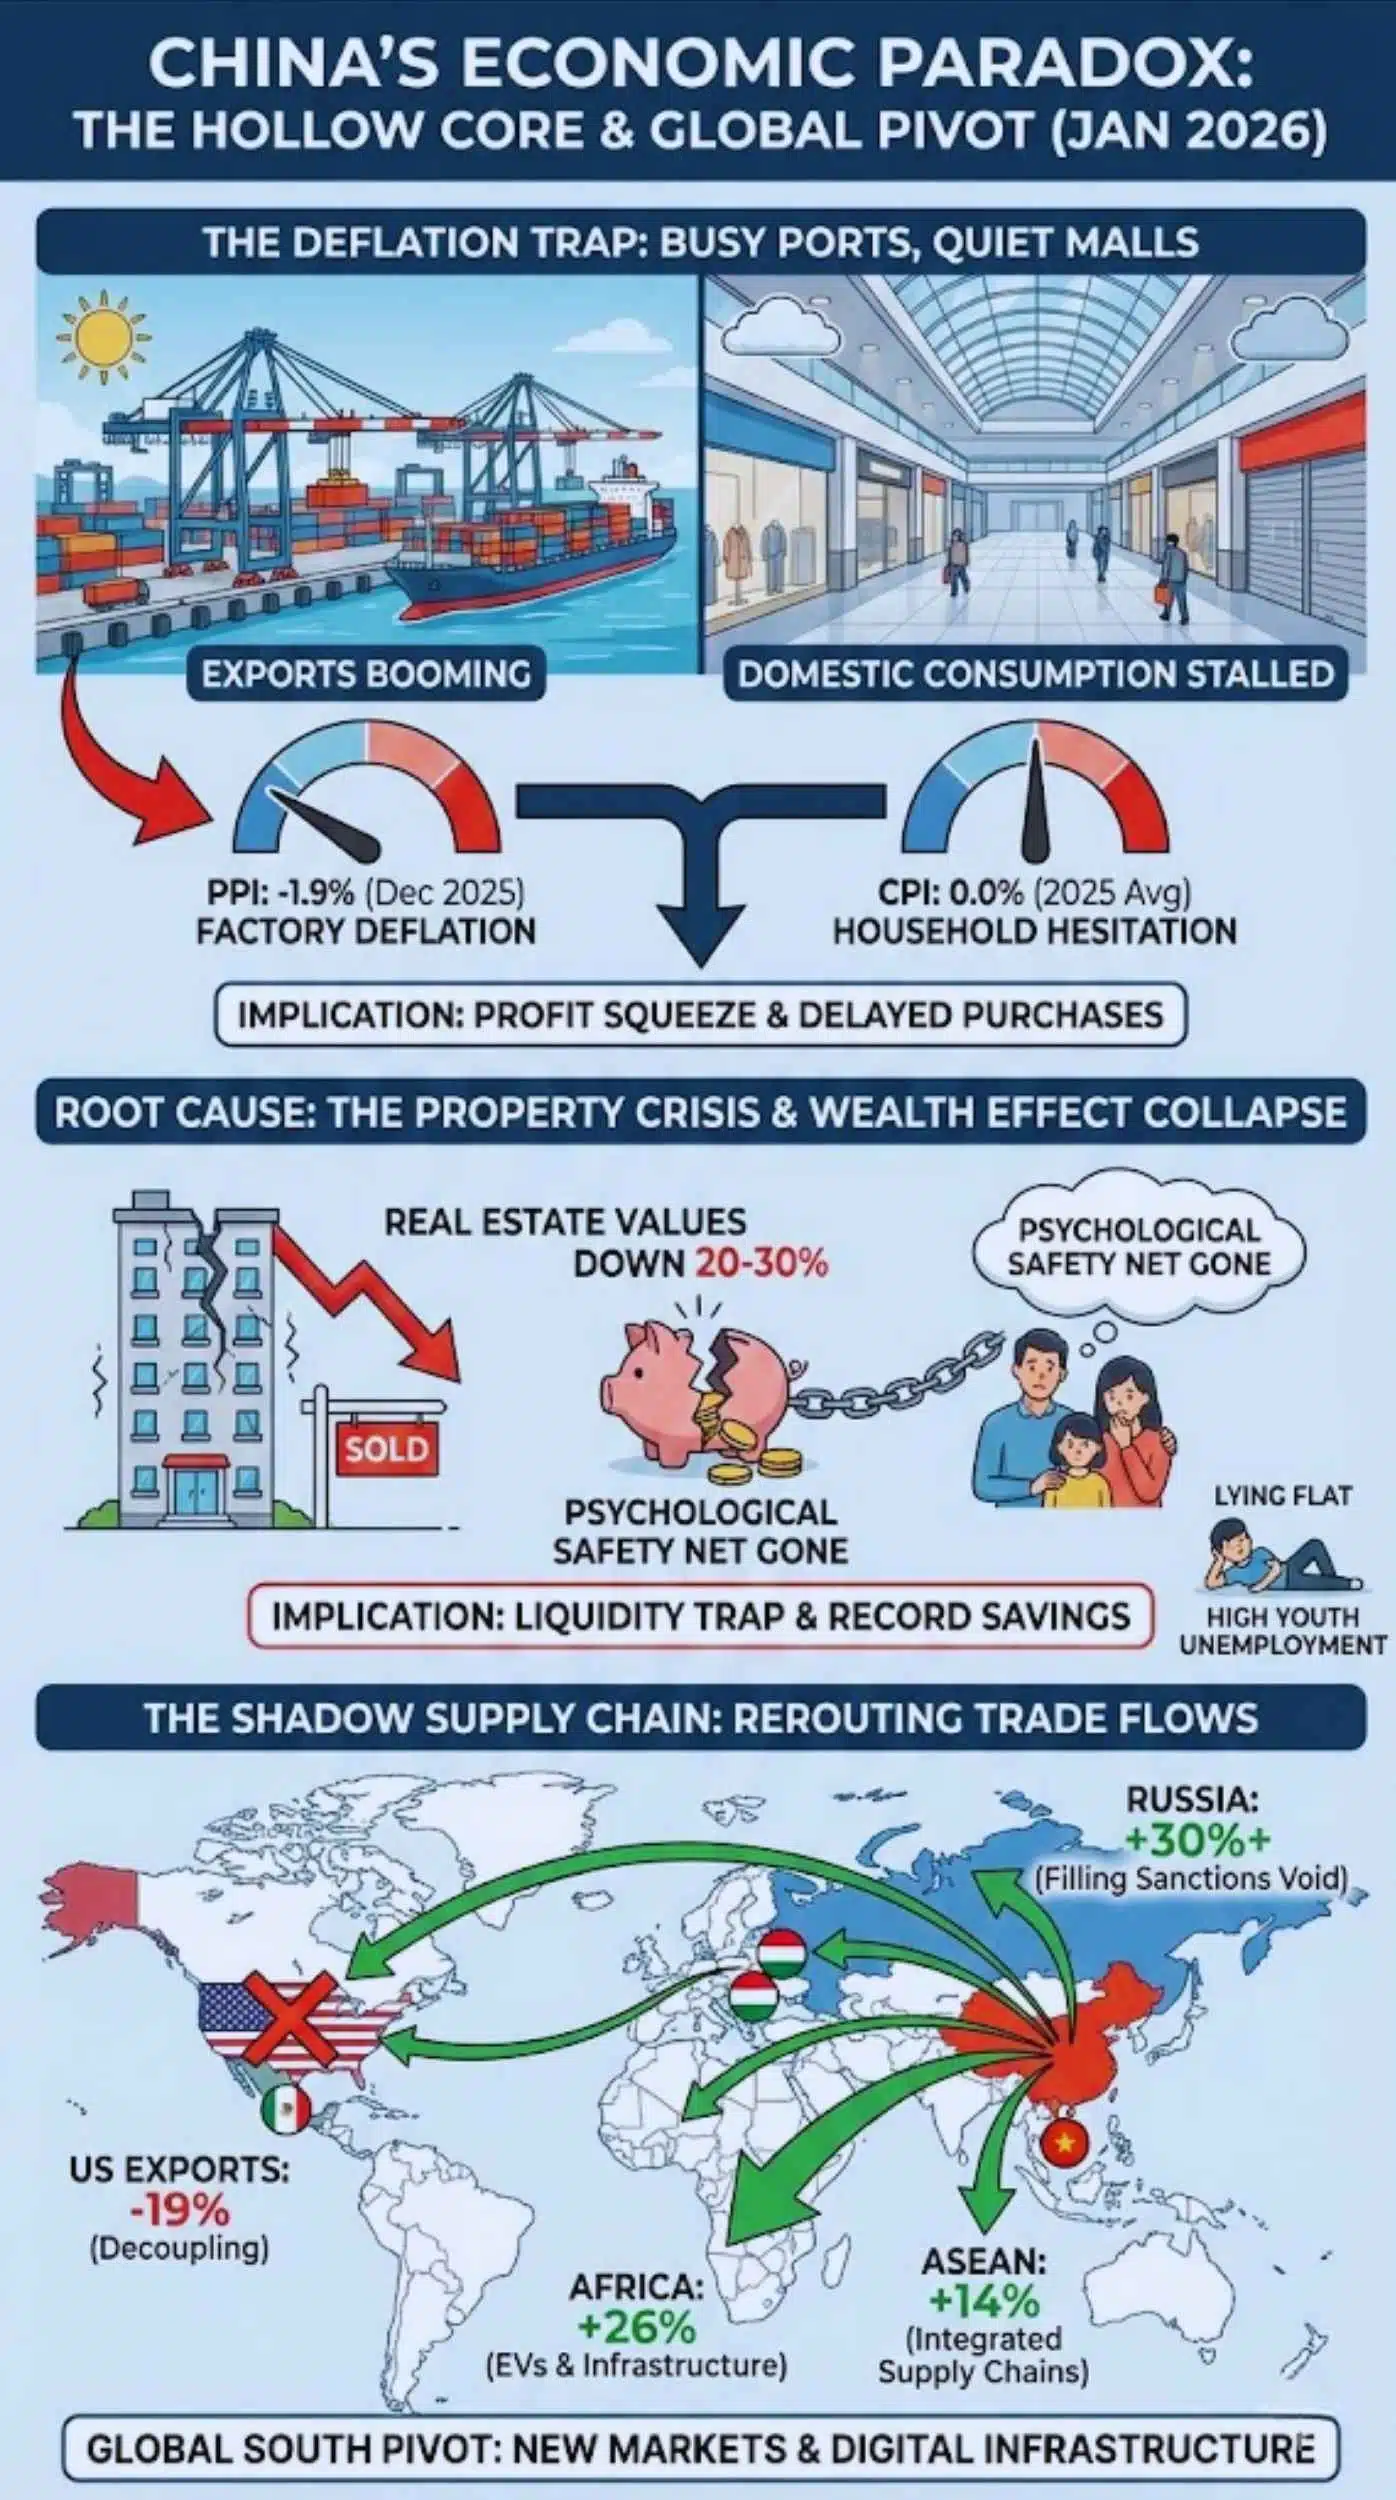
While the ports are busy, the shopping malls are quiet. This is the “Deflation Trap.” For the entirety of 2025, China’s Consumer Price Index (CPI) hovered near 0%, ending the year at a meager 0.8% only due to food prices. More alarmingly, the Producer Price Index (PPI) remained negative (-1.9% in Dec 2025), marking over three years of falling factory-gate prices.
The root cause is the collapse of the “Wealth Effect.” For decades, rising property prices made Chinese families feel rich, encouraging them to spend. With real estate values down 20-30% from their peak, that psychological safety net is gone.
The Two-Speed Economy Indicators (Jan 2026 Status)
| Economic Indicator | Status | Implication |
| Producer Prices (PPI) | -1.9% (Deflation) | Factories are slashing prices to clear inventory; profits are squeezing. |
| Consumer Prices (CPI) | 0.0% (Full Year Avg) | Households are delaying purchases, expecting goods to be cheaper later. |
| Youth Unemployment | High Structural friction | A generation of “lying flat” youth is reducing long-term consumption potential. |
| Property Investment | Double-digit decline | The traditional engine of GDP growth has seized up completely. |
The Shadow Supply Chain: How Trade Is Rerouting, Not Stopping
The narrative of “Decoupling” is technically true but practically misleading. While trade with the US has plummeted due to tariffs, China hasn’t stopped selling; it has just changed customers. 2025 witnessed the solidification of the “Shadow Supply Chain,” where Chinese components are shipped to intermediary countries like Mexico, Vietnam, or Hungary, assembled, and then re-exported to the West.
Furthermore, China has aggressively pivoted to the “Global South.” The Belt and Road Initiative (BRI) has morphed from building bridges to selling EVs and digital infrastructure.
The Geopolitical Pivot (2025 Export Destinations)
| Region/Country | Export Growth (YoY) | Strategic Context |
| United States | -19% | The result of “Trump 2.0” tariffs and aggressive decoupling measures. |
| Africa | +26% | China is providing affordable 4G/5G and EVs to the continent’s growing middle class. |
| ASEAN | +14% | Now China’s largest trading bloc; heavily integrated supply chains (e.g., Vietnam). |
| Russia | +30%+ | China fills the vacuum left by Western sanctions, supplying cars and machinery. |
The Policy Paradox: Supply-Side Addiction in a Demand-Starved Era
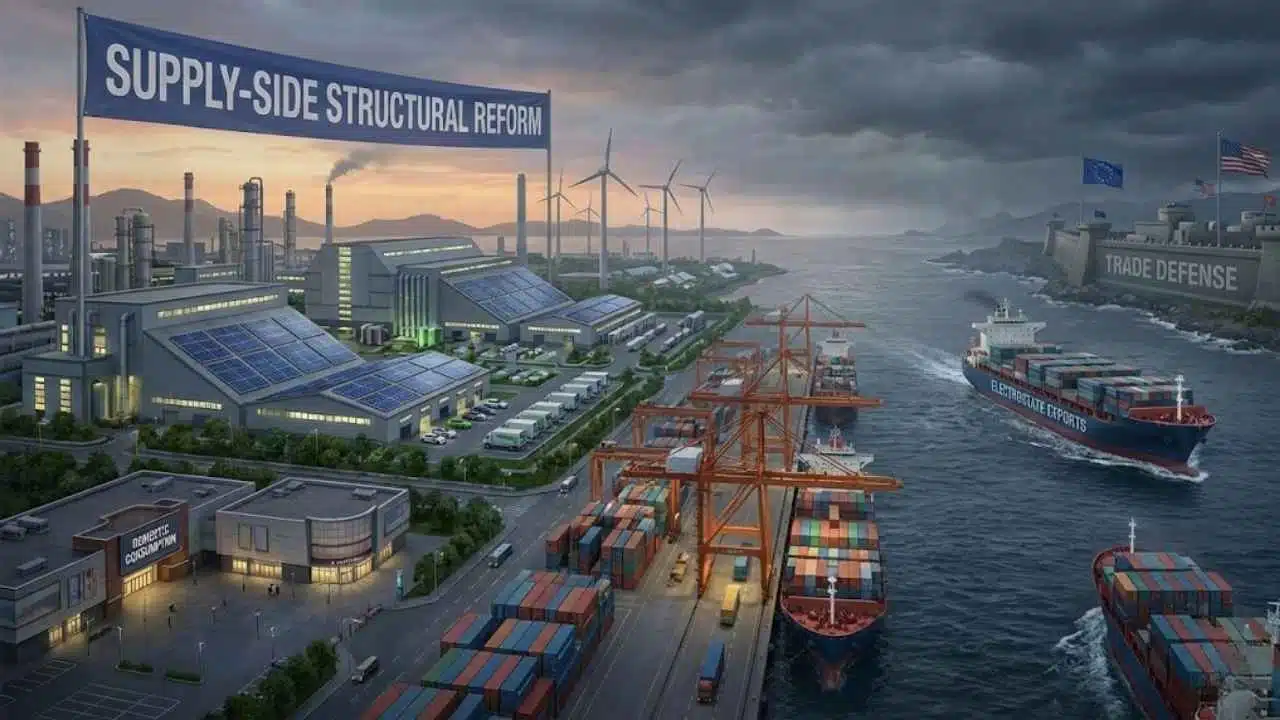
Why doesn’t Beijing just hand out cash to consumers to fix deflation? The answer lies in President Xi Jinping’s economic philosophy, which views consumption-based growth as “welfarism” that breeds laziness. Instead, Beijing prefers “Supply-Side Structural Reform”—pouring money into high-tech manufacturing.
This creates a paradox: The government is subsidizing the production of goods that its own people cannot afford to buy in sufficient quantities. This forces China to export its excess capacity, effectively exporting deflation to the rest of the world. Western nations view this as “dumping,” while Beijing views it as “industrial upgrading.”
Stimulus Strategy Comparison (West vs. China)
| Feature | Western Model (e.g., US/EU) | China Model (2025/2026) |
| Primary Target | Demand Side (Households) | Supply Side (Factories/Tech) |
| Method | Direct checks, tax cuts, welfare. | Cheap loans to manufacturers, infrastructure investment. |
| Outcome | High Inflation, High Growth. | Deflation, High Trade Surplus. |
| Risk | Overheating economy. | Trade Wars (Global pushback against dumping). |
Future Outlook: The Collision Course of 2026
As we look ahead, the “Electrostate” strategy is on a collision course with Western protectionism. The $1.2 trillion surplus is politically unsustainable for China’s trading partners.
- The “Anti-Involution” Consolidation: Watch for Beijing to force mergers in the solar and battery sectors to stop companies from undercutting each other. They need to raise prices to restore profitability.
- Europe’s Breaking Point: The EU cannot absorb the EVs that the US rejects. Expect Brussels to implement quotas or higher carbon taxes (CBAM) specifically targeting Chinese “overcapacity.”
- The Currency Wildcard: If exports slow down due to tariffs, Beijing might be tempted to devalue the Yuan (RMB) to remain competitive. This would trigger a currency war reminiscent of the 1990s Asian Financial Crisis.
Final Thoughts
China has won the battle for green technology dominance, but it is at risk of losing the war for economic stability. By building an “Electrostate” without a strong domestic consumer base, it has constructed an engine that can only run by venting its exhaust—excess inventory—onto a world that is increasingly closing its windows.