
Every year, it gets harder to make sure that all business processes are under control because of the huge amounts of data that are being created. This is a problem for businesses of all sizes. In the end, organizations and companies need certain kinds of help in order to make decisions that are both sustainable and profitable. By using modern, professional business intelligence tools (BI tools), any business user can quickly solve any problem without a lot of help from IT.
These tools go a step further by allowing a company to collect, analyze, monitor, and predict future business scenarios based on a clear view of all the data it handles. Finding trends, letting people do their own analytics, using powerful visualizations, and offering professional BI dashboards are becoming the norm in business operations, strategic planning, and, ultimately, tools that can’t be done without if you want to make more money. Not only that, but because these solutions are self-service, all types of users can use all of the features we just talked about without any technical skills or training. They are the perfect way to open up data analysis to more people and improve business performance.
Here, we’ll explain what a BI tool is, list the most important things a company can get out of using them, and give a review of each of the best BI tools on the market. For this list to be as accurate as possible, we looked at two of the best sites for comparing software and reading user reviews. On one side is Capterra, which is also part of the Gartner family. Gartner is the world’s leading research and advisory company. On the other side, we have G2Crowd, which is one of Gartner’s biggest competitors and has been a major player in the review market for over a decade. For our research, we looked at the business intelligence software platforms that had the best ratings on both sites and had at least 50 reviews between them.
What Is Business Intelligence?
• Business intelligence (BI) is a software collection that analysts and managers utilize to help them make decisions.
• Business intelligence is described as the analysis and processing of massive amounts of data, followed by the conversion of that data into knowledge-based information to enable profitable business choices.
• The BI Environment consists of business models, data models, and ETL tools for organizing and transforming data into valuable information.
• BI employs terminology such as:
• Big Data refers to a collection of huge and complex data sets containing structured and unstructured data that can be difficult to process and analyze using typical database management techniques.
• A data warehouse is a subject-oriented, integrated system for reporting and analyzing data to aid in decision-making.
• Data mining is the practice of applying statistical approaches to massive amounts of raw data in order to generate meaningful information with new patterns and linkages within large relational databases.
The diagrammatic representation of the BI implementation process is provided here to assist you in better understanding Business Intelligence.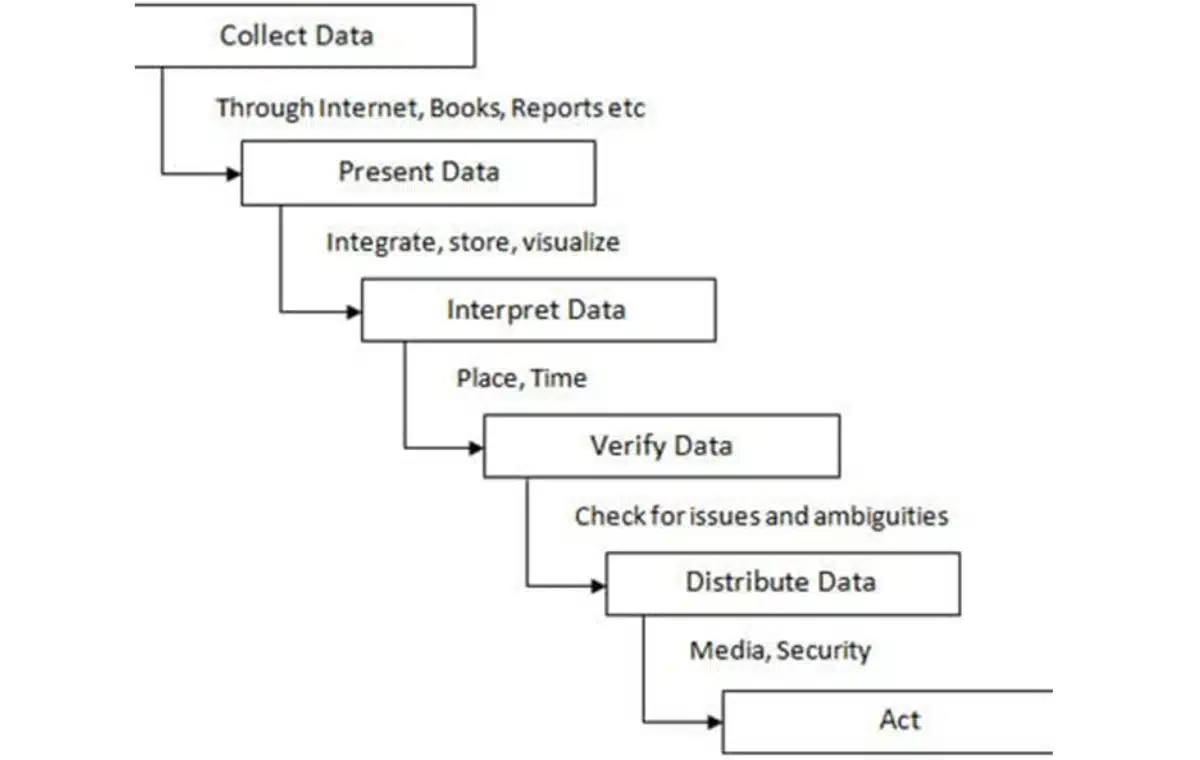
Impact of Business Intelligence
BI has shown to be beneficial to corporate organizations in the following ways: • Get a quick answer to essential business challenges.
• Align business operations with corporate strategy and tactics.
• Employee Involvement
• Time saved on data manipulation.
• Gain knowledge about your customers
• Recognize crucial cost-estimating areas.
• Increase business productivity
Challenges with BI Implementation
Even though BI is being used by many businesses and has helped them, there are still some problems with putting it into place.
Some of them are listed below:
• Every day, a huge amount of data is collected, but it’s not possible to process it all at once.
• Not having a plan.
• Users or groups of users who use different methods don’t want to change unless the way they’re doing things takes too much time and isn’t effective.
• Justifying investments by figuring out how much it will cost to find new ways to do business.
• Change in management.
• Managing non-transactional data.
• Enterprise data governance.
• There aren’t enough links between IT and business users.
• A lot of people can get to the information.
• Putting together security and customization.
The Benefits OF Business Intelligence Tools
Professional business intelligence (BI) software and tools have a lot of great benefits, but here we’ll focus on the most important ones:
They bring together all relevant data: Whether you work for a small company or a large enterprise, you probably collect data from different portals, ERPs, CRMs, flat files, databases, APIs, and much more. You have to get a lot of data intelligence to be able to handle all of these sources and get a better grasp of the information gathered. So, using modern data connectors will help you bring all the different sources together and give you a single view of all your business processes. So, figuring out problems and trends, doing crossed-analysis, and taking action are all closely linked and based on data alone.
Their true self-service analytics approaches unlock data access: When everyone in a company has access to modern business intelligence software that lets them explore data on their own, they don’t have to ask the IT department for reports nearly as often. This self-service BI method gives companies a competitive edge because each employee will have the right amount of data analytics skills. This will save the company time and money while relieving the IT department of some of its responsibilities, letting them focus on other important tasks.
Users can take advantage of predictions: Predictive analytics doesn’t have to be something that only data scientists or analysts are good at. With the integration of forecast engines, business users of any level of skill can easily get information about what might happen in the future. This will help them change their current strategies to get the best results. On the other hand, if a business situation changes, artificial intelligence-powered intelligent data alerts will protect you from any strange things that might happen while you manage a lot of data and help you find new trends and patterns that will let you act right away. With this level of technology, you can automate processes and do less work by hand, giving you more time to do other things.
They eliminate manual tasks: Traditional ways of running a business involve using spreadsheets and presentations that don’t change, but new software gets rid of all the rows and columns and makes it easier to automate processes. You want a report? The tool sends real-time data to your KPI dashboard on its own. Also, you can set up the reporting process to happen automatically at certain times and just look at the results. Need to give a talk? Just drag and drop your values to see how easy it is to make a powerful dashboard that lets you interact directly with your data all on one screen. Getting rid of endless PowerPoint presentations and replacing them with a much more intuitive way to look at data.
They reduce business costs: BI platforms make it faster to plan, analyze, and report on everything from sales and customer behavior to real-time process monitoring and offer optimization. In fact, more than half of business intelligence users who took part in a survey by the BI survey said that these were the most important benefits that helped them cut costs and make more money. If you can work quickly and precisely, you can get much better business results and make changes that are good for your bottom line.
They’re constantly at your service, 24/7/365: Different organizations have different needs, and these tools’ Software-as-a-Service (SaaS) model will provide a full SaaS BI experience, with all the data hosted in a safe online environment. The software can be scaled up or down, depending on what you need. In this way, it can adapt to the needs of a company. Since the data is stored in the cloud, you can always use the software and try out the different self-service analytics features, no matter if you’re a manager, data scientist, analyst, or consultant. Any smart device can access your data as long as it has a browser and an internet connection.
These benefits of business intelligence apply to both small and large businesses. BI is the way to keep track of your data and know what’s going on in your company. We’ve made a list of business intelligence tools to help you along the way. These tools will not only make data management and discovery easy and intuitive, but they will also keep your data safe and ensure a higher level of productivity, which will lead to higher profits.
BI Tools Comparison Criteria & Key Features
1. and easy to understand?
2. Usability: Is it simple to learn and get good at? Is there training and how-to? How well-made is the user interface (UI)? Does it have clear screens? Especially for enterprise reporting tools, you should be able to get different kinds of tech and user support to help different people in your organization get started.
3. Features & Functionality: How many of the key features and functions of management reporting tools does it have, and how well do they work? I was especially looking for:
• Customizable Dashboards: The best BI solutions show multiple visualizations on a single screen and give you the option to link the visualizations together (so that any filters or choices you make affect all of the visualizations) or keep each one as a separate one. It should show changes in real time and let you change how important data is shown.
• Drill Down and Data Filters: Includes drop-down menus, search filters, and slicers, as well as the ability to drill down into the details and back up to data summaries.
• Web-based Interface For Clients: It’s easiest if client-facing reporting solutions have web-based client interfaces, which are faster and easier to manage than desktop-based client interfaces.
• Scheduled and Automated Reports: the tool should make it easy for you to keep track of progress. This includes being able to set up automatic updates to be sent to teams, automatic reports to be sent to clients, and automatic alerts to be sent out when important dates or thresholds are reached.
• High Quality Diagramming: Basic tools include bar, line, pie, area, and radar charts. More advanced diagrams include heat maps, scatter plots, bubble charts, histograms, and geospatial maps. The best tools for reporting let you mix and match these visualizations to make diagrams that use a mix of them all.
1. Integrations: Integrations can be broken down into three main types. 1) How well does an app work with your software so that embedded BI visualizations work well? 2) Does the software work with other apps? Does it have plug-ins, connectors, or extensions that you can use with your other workflow software? 3) What kinds of data sources can it connect to and pull from, and how many are there?
2. Value for $: Does the price make sense for the features, capabilities, and uses of the product? Is the pricing clear, flexible, and easy to understand?
The Best BI tools on the Market a Detailed Review
community, which is frequently cited in industry papers, and has received excellent user ratings on Capterra and G2Crowd, as previously reported. The arrangement of the tools is arbitrary and does not represent any kind of grading or ranking system. This list’s ranks were as follows: We have selected the top 14 BI products that are market leaders in business intelligence collected through November 2021. Let’s get this party started!
1. Datapine
datapine is a business intelligence program that allows you to link data from many sources and analyze it using advanced capabilities (including predictive analytics and artificial intelligence). With all of your data at your disposal, you can build a comprehensive business dashboard (or multiple), generate standard or customized reports, and add intelligent alerts to be warned of anomalies and targets. This tool, which has received 4.8 stars on Capterra and 4.6 stars on G2Crowd, is a powerful option for organizations of all sizes because datapine can be used for a wide range of industries, services, and platforms.
The software caters to both advanced users like data analysts and average corporate users. The SQL mode allows analysts to construct their own queries, whereas the intuitive drag-and-drop interface ensures a visually intuitive manner of entering numbers and creating impressive charts and dashboards by utilizing effective visual analytics.
Key Features:
Intuitive drag-and-drop interface: Simply drag your KPIs into the interface and see how your charts and graphs change into a professional dashboard without the need for IT or complicated code.
Easy-to-use predictive analytics: Advanced analytics features such as predictive analysis based on a forecast engine, where you simply select the KPI, determine the number of data points to forecast, specify the previous data points for the calculation, and finally define the model quality by specifying the desired confidence interval.
Many interactive dashboard features: Drill down into each section of the dashboard using advanced dashboard software features such as drill-downs, chart zooms, widget linking, and hierarchical filters, among others, to ensure a thorough data discovery process.
Multiple reporting options: Use BI reporting capabilities to build standard or bespoke reports that you can share via a password-protected live URL, allow viewer access to, or send an e-mail report that you may automate at specific time intervals. Furthermore, you can incorporate datapine into your own application and reap all of the benefits of BI software without investing all of your money and time in developing your own.
Smart insights and alarms based on artificial intelligence: Artificial intelligence, machine learning, and pattern recognition technologies warn the user if a business anomaly happens or generate different sorts of insights, such as growth, trends, value drivers, and what-if scenarios, among others.
SHORTCOMINGS: They do have mobile access, however the dashboards are inaccessible until you download their app and configure them within the mobile view.
2. SAS Business Intelligence
SAS Business Intelligence is a business intelligence tool that includes a wide range of tools and technology for data scientists, text analyzers, data engineers, forecasting analysts, econometricians, and optimization modelers, among others. SAS Business Intelligence, which was founded in the 1970s, has a long history in the market, constantly developing and expanding its products. With a Capterra rating of 4.3 and a G2Crowd rating of 4.2, this software has a reasonable level of user trust and happiness.
Key Features:
5 main subjects: SAS provides several BI tools and technologies centered on visual data exploration and easy analytics, interactive reporting and dashboards, collaboration, and mobile apps.
Data exploration supported by machine learning: SAS’ data exploration provides automated analysis using machine learning that is packaged in interactive visualizations that address business queries such as “Where do my customers come from?”
Text analytics capabilities: Text analytics, which allows you to acquire insights from text data such as social media, and location analytics, which integrates data in a geographical context, are both intriguing aspects.
Reports and dashboards across devices: Like the other tools on our list, dynamic graphics are arranged into interactive reports and dashboards that can be accessed on mobile and tablet devices (both Android and iOS).
Integration with other applications: With their Office Analytics solution, you can combine SAS with Microsoft Office apps such as PowerPoint, Word, SharePoint, or Excel, allowing you to view your results directly in Microsoft Office Suite.
SHORTCOMINGS:
Given the product’s complexity and offerings, the higher price range and restricted customization choices can be significant factors in determining whether this business intelligence tool is the best decision, as most customers suggest on Capterra and G2crowd.
3. Infor Birst
Infor Birst is a cloud-based analytics and business intelligence tool that assists users in comprehending and optimizing complicated processes. Birst was acquired by Infor, a multinational firm with a diverse array of software products for various industries, in 2017. Infor Birst is now a sophisticated end-to-end solution that includes a data warehouse, visualization and reporting platform, and a networked BI approach based on considerable automation and learning technologies. Customers gave the BI vendor’s software 4.1 stars on Capterra and 3.9 stars on G2Crowd.
Key Features:
Modern data architecture: Infor’s modern data architecture serves as the foundation for Birst’s native cloud BI product. The benefits include increased flexibility, data security, and scalability to react to changing business situations.
Networked BI: A multi-tenant cloud architecture enables the creation of interconnected analytics and BI instances based on a shared Data-as-a-Service (DaaS) structure.
Adaptive interface: Cross-device access to the platform that matches the needs of modern work styles, allowing for a great user experience with the same interface whether online or offline.
Embedded BI: You can combine Infor Birst’s cloud solution with your own application. This allows you to monetise data in a familiar software environment without developing your own analytics solution.
Industry analytics: A variety of role-specific and industry-specific data models, as well as analysis choices, are available. Specific trends, as well as weak signals, might be discovered with their assistance in order to respond to them at an early stage and boost profitability.
SHORTCOMINGS:
The user interface has been described as confusing by several customers. Furthermore, data integration is more involved than indicated because the business intelligence tool does not totally automate the creation of a data model based on the linked data sources.
4. Integrate.io
Key Features:
• Integrate.io is a platform for data integration. It is a cloud-based system that will connect all of your data sources.
• Integrate.io offers a marketing solution with data enrichment features. Combine.io will integrate your data enrichment tools.
• It will assist you in keeping your marketing automation up to date. Integrate.io ensures that your client information is constantly up to date.
• Integrate.io will improve the effectiveness of your marketing campaigns.
• It offers multichannel marketing as well as data-driven insights.
• It will assist you in developing a comprehensive Sales Analytics solution.
• A sales solution includes data enrichment, excellent analytics, a centralized database, and other features.
• Integrate.io has a customer support analytics solution that delivers comprehensive insights, data enrichment, personalized help solutions, and so on.
5. Zoho Analytics
Zoho Analytics is a self-service business intelligence and analytics tool. It enables users to construct insightful dashboards and examine data visually. It has an artificial intelligence-powered assistant that allows customers to ask inquiries and receive intelligent answers in the form of useful reports.
Features:
• 100+ pre-built connectors for key corporate software, cloud storage, and databases
• Unified business analytics that analyzes data from several business applications.
• Augmented analytics with an AI and ML-powered intelligent assistant that understands natural language inquiries.
• White label solutions for embedded analytics and business intelligence/analytics portals.
• There are on-premise and cloud versions available. It is possible to deploy it on AWS, Microsoft Azure, and Google Cloud.
Best Features: Intelligent assistant, unified business analytics, white-label / embedded BI, and more than 100 connectors with pre-built reports and dashboards are all available.
Price Plan: Free plan, Basic ($22/month), Standard ($45), Premium ($112), and Enterprise ($445) plans are available.
Verdict: The program provides intelligent data alerts and forecasts. It employs AI, ML, and NLP technologies.
6.HubSpot
• HubSpot is software for inbound marketing, sales, and service. • Its CRM software is absolutely free and will assist you in organizing, tracking, and building better relationships with prospects and customers.
• It provides marketers and developers with versatile and robust content management tools.
• Its sales software provides better insights into prospects and allows you to automate operations.
• Marketing software will assist you in running large-scale inbound marketing efforts.
7. SAP Business Objects
SAP BusinessObjects is a business intelligence platform that enables extensive reporting, analysis, and data visualization. They offer Office connections with Excel and PowerPoint, allowing you to make live presentations, as well as hybrid analytics that connect to their on-premises and cloud SAP systems. They are primarily concerned with business categories such as CRM and customer experience, ERP and digital core, HR and people engagement, digital supply chain, and many others. To be precise, SAP is used by over 170 million people worldwide, making it one of the world’s largest software vendors. The company received 4.2 ratings on Capterra and 3.8 stars with over 400 reviews on G2Crowd, proving its well-established position in the market since 1972.
Key Features:
A BI enterprise reporting system: Ad hoc queries and a comprehensive BI enterprise reporting solution designed to guide your overall company strategy are used for reporting and analysis.
Self-service, role-based dashboards: Analytics applications and data visualization are centered on self-service capabilities, similar to other tools, where you may develop your own role-based dashboards and applications, for example, to assess risks.
Cross-enterprise sharing: You can build a cross-enterprise sharing functionality to share your findings with other stakeholders and partners.
Connection with SAP Warehouse and HANA: When you connect to SAP Business Information Warehouse (SAP BW) or SAP HANA, multidimensional data analysis allows you to filter and change data in real-time.
Integration with Office: By combining Microsoft Excel with SAP, you can analyze bigger volumes of data and incorporate analytics in PowerPoint, making this solution readily integrated with Microsoft Office.
SHORTCOMINGS:
According to several reports, extensive analytical functions are rarely usable without further user training. Furthermore, the costs for individual modules are rather costly, and there are rarely feature updates.
8. DOMO
Domo is a business intelligence software platform that includes several systems, beginning with linking data and ending with extending data with pre-built and custom apps from the Domo Appstore. Domo can also be used in conjunction with R or Python scripts to prepare data for predictive modeling in data lakes, warehouses, and ETL tools. You may integrate data throughout your company, apply machine learning and artificial intelligence skills, and allow users to explore the data on their own, much like with other tools. With a solid 4.2 star rating on Capterra and an even better 4.4 in G2Crowd, this BI application is also highly recommended by many users worldwide, despite the fact that the company is one of the youngest on our list, having been created in 2011.
Key Features:
Numerous pre-built cloud connectors: Data integration works similarly to other tools; you can connect to more than 1000 pre-built cloud connectors, on-premise with Domo Workbench, file upload such as Excel or Google Docs, proprietary systems, and federated connectors that will allow you to query the data regardless of where it is hosted.
Magic ETL feature: Data transformation tools will allow you to prepare your data with a drag-and-drop Magic ETL, as Domo refers to it, without having to understand SQL.
Automatically suggested visualizations: Data visualization allows you to go from raw data to charts, graphs, maps, and other visualizations that Domo suggests after you input your data source. You can fine-tune the data, annotate it for additional commentary or conversation, or adjust and restrict who gets access to it.
Mr. Roboto as an AI engine: Mr. Roboto, Domo’s AI engine, powers predictive analysis by allowing data scientists to create predictive models and use artificial intelligence, machine learning, natural language processing, and other AI technologies to alert and notify about changes in KPIs, for example.
Domo Appstore: Their open cloud platform is an ecosystem of pre-built apps, connector APIs, and dashboards, with the option to create your own and share it on the Domo Appstore.
SHORTCOMINGS:
Domo is not designed for newbies because the learning curve might be steep, but they do provide training, so be prepared to learn. Their pricing models are opaque, but based on the facts available on the web, you may guess it’s the most expensive answer on our list.
9.TIBCO Spotfire
Spotfire, a business intelligence firm established in Somerville, Massachusetts, was acquired by TIBCO in 2007. (Wikipedia). Spotfire provides general visualization features similar to Tableau or QlikView.
TIBCO Spotfire pricing starts at $650.00 per year, per user, whereas Tableau Public and Power BI Desktop are free to use. Because there is no free version, it may be less popular among independent Data Scientists. However, I recently came across this story about how Accor Hotels used TIBCO Spotfire to improve customer experience and integration that was faster, easier, and simpler.
With Spotfire in its arsenal, TIBCO, a former global leader in integration and analytics, had a sizable customer. The TIBCO customer list can be seen here.
What sells TIBCO Spotfire?
1. A diverse range of visuals (around 16 viz options)
2. Create, deploy, and share analytics apps using mobile browser access.
3. The Recommendations Wizard automatically generates visuals.
4. Use statistical/regression models to gain predictive insights.
5. Gain access to always-on analytics based on real-time industry data.
Spotfire Cloud provides 250GB of consolidated storage.
10. MicroStrategy
MicroStrategy is a software and mobility platform for enterprise business analytics that focuses on hyperintelligence, federated analytics, and cloud solutions. Their mobile dossiers allow customers to create interactive analytics books that can be viewed on iOS or Android smartphones, with the option to integrate MicroStrategy material into their apps using Xcode or JavaScript. You can get a sample app, MicroStrategy Mobile, or the Library app, which will allow you to install analytics on the fly. This tool has received 4.2 stars from both Capterra and G2Crowd reviewers, making it one of our instances of business analytics products with high references in the BI industry.
Key Features:
Hyperintelligence pulls your data: Their hyperintelligence function collects data from many sources and converts it into meaningful, zero-click insights, whether it’s a card on a website or integrated with a voice-over assistant. An intriguing fact is that they deliver contextual insights; merely hover your cursor over the relevant data, and the software will recognize it directly on the website, applications, and gadgets you use.
Federated analytics: Federated analytics: It provides a common data lexicon that is built on an enterprise semantic graph that indexes all disparate data systems and enables visualizations of the same data, regardless of the tools used.
Mobile deployment: As previously said, they also provide mobile deployment, which allows customers to access existing reports, dashboards, and visualizations in real-time, from any location and device, with the option for code-free app development and design.
Integration with voice technology: Using natural language processing and machine learning, you may connect voice technology and chatbots such as Alexa or Google Home.
Cloud technology: Microstrategy provides a variety of cloud solutions that are scalable, secure, versatile, and expandable to satisfy the demands of both business departments and IT.
SHORTCOMINGS:
Some users claim a complicated initial setup because it needs many parties and extensive understanding of the application itself. The software’s ease of use is definitely lacking — you’ll need very competent employees to “get it up and running.”