

A carbon savings calculator can turn a lighting upgrade, a shorter commute, or a change in packaging into a single emissions figure. The number is only as useful as the comparison behind it. A warehouse that was already going to replace its lights, for example, may save less by choosing a premium LED system than a calculator suggests when it assumes the old fixtures would stay in service for years.
Before you use an estimate to choose a project or make a public claim, check what would have happened anyway, how much activity actually changes, and which emissions the calculation includes. The seven checks below use a hypothetical warehouse lighting project to show where the result can move.
1. What baseline does the carbon savings calculator use?
The baseline is what you reasonably expect to happen without the proposed action. If the existing fixtures would stay in place for another year, using them as the first-year baseline may make sense. If a standard LED replacement is already budgeted for next month, compare the premium system with that planned replacement for the period after the change. A baseline can change during the time the calculator covers.
Keep the service comparable. A proposal that leaves half the warehouse underlit answers a different question from one that provides the required lighting throughout an operating shift. Write down what each option delivers and why the baseline is plausible. A purchase plan, maintenance schedule, or replacement quote can be more useful here than a generic calculator default.
2. How much activity will actually change?
A kit sold as “40 watts less per fixture” describes a difference in power. To estimate energy savings, you also need the number of fixtures and the hours they run. A 40-watt reduction across 100 fixtures running 2,500 hours a year saves 10,000 kilowatt-hours (kWh) a year, assuming both options have the same runtime. At 2,000 hours, the estimate drops to 8,000 kWh.
Record which inputs are measured and which are assumed. Fixture counts and lighting schedules are a starting point. A dedicated meter or control log can help check operating hours, especially when occupancy sensors, dimming, or shift patterns change. A whole-building utility bill can show a change in total consumption, but other equipment and operating changes can affect the same bill. For projects that change how lights are used as well as which fixtures are installed, check the assumptions about dimming, motion sensors, and lighting habits.
3. Does the emissions factor fit the location and the question?
An emissions factor converts activity into an emissions estimate. For electricity it might be kilograms of carbon dioxide per kWh. Ask for the factor’s source, grid region, and data year. If the calculator defaults to a national rate when a location is missing, record that fallback. Using an old or distant grid mix can change the answer even when the energy savings stay the same.
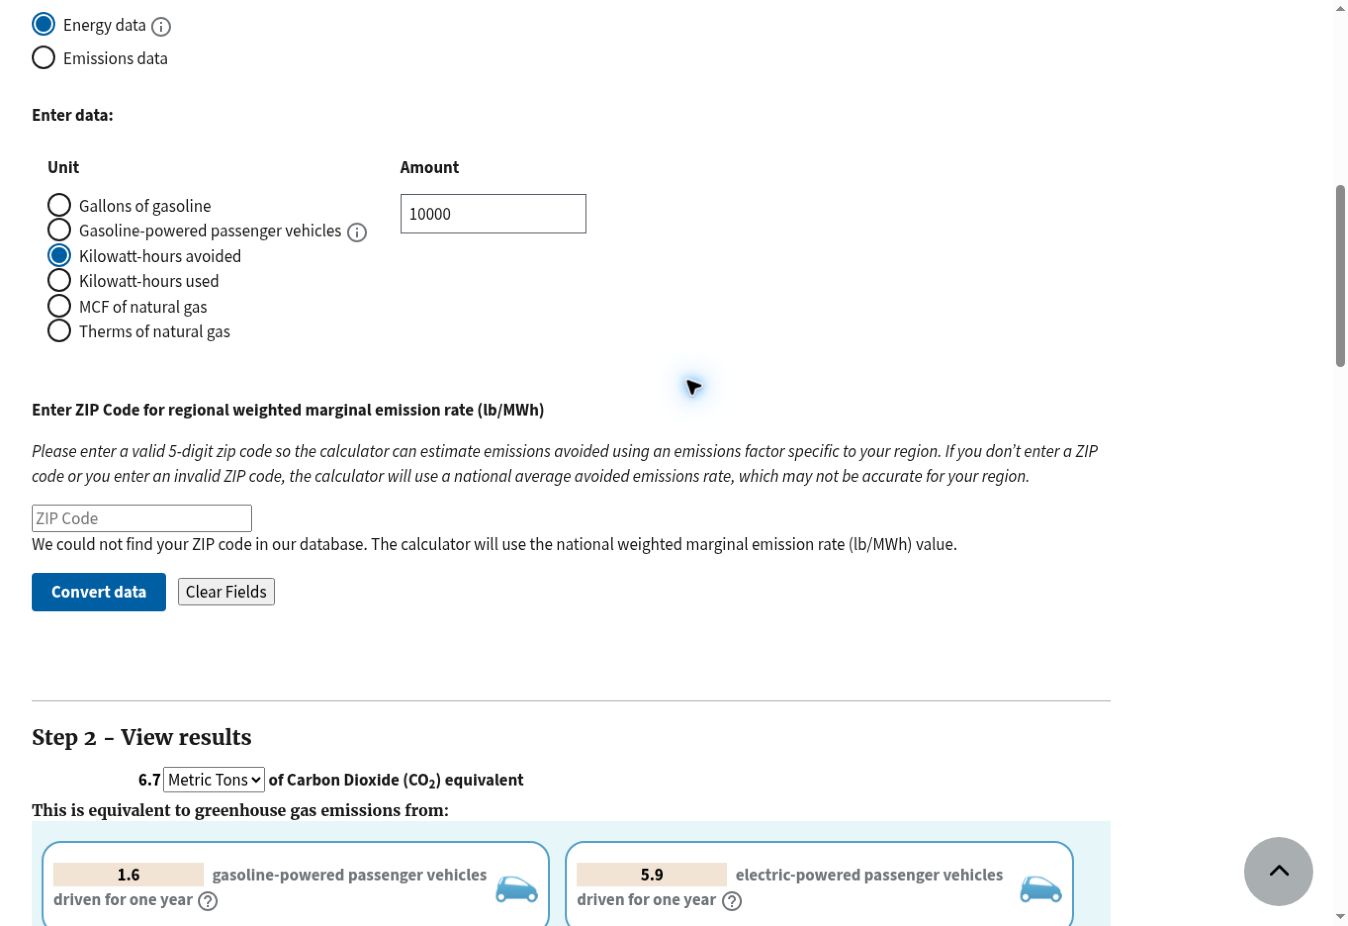
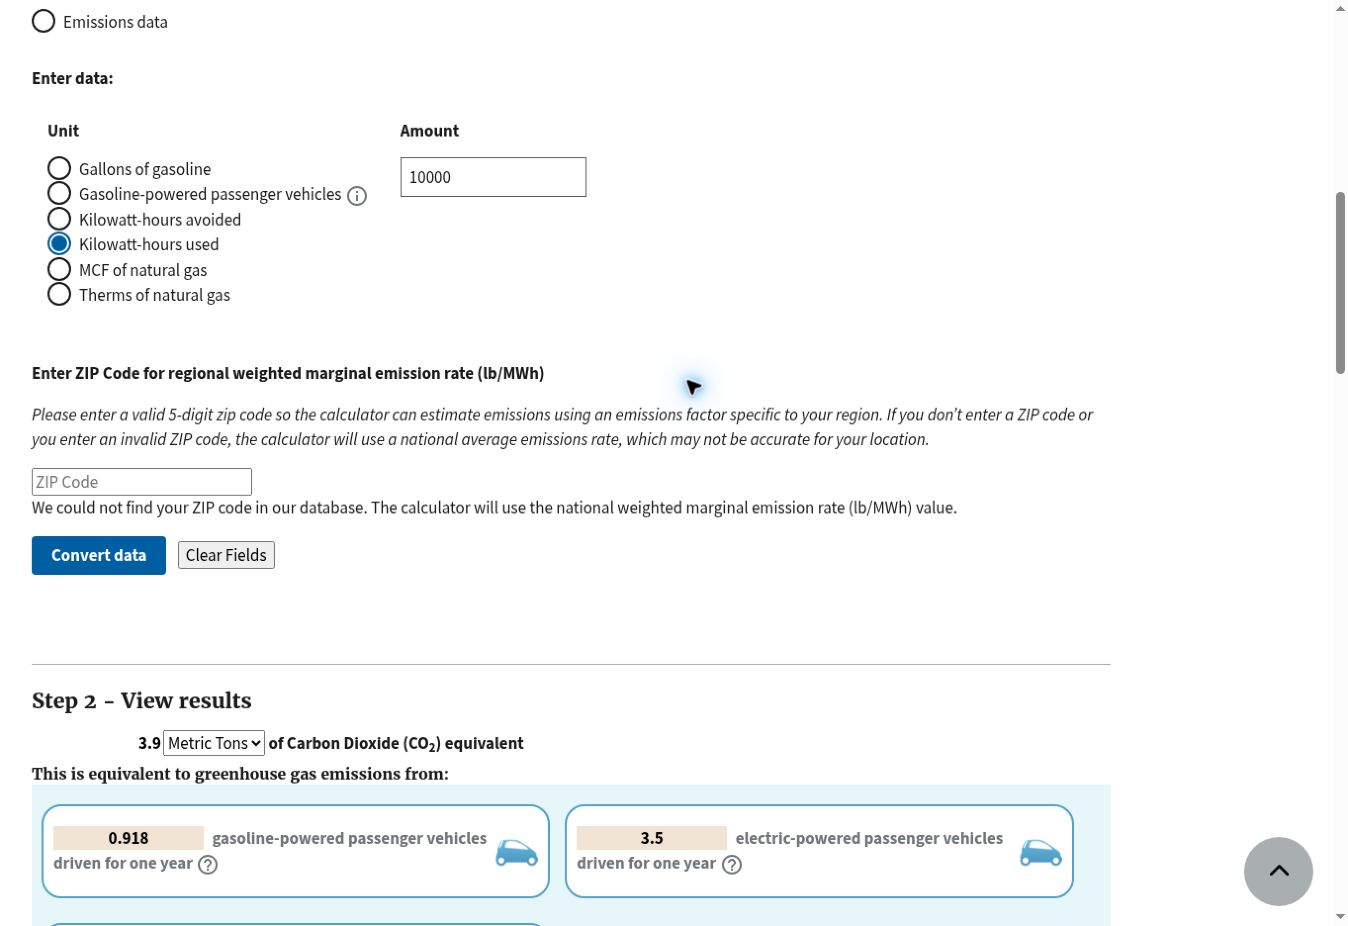
The choice of factor also depends on what you want to measure. An average grid factor describes emissions associated with electricity use across the grid mix. A marginal factor estimates the emissions response to a change in electricity demand or generation. The U.S. EPA’s calculator methodology illustrates the distinction by using different rates for electricity used and electricity avoided. If the project shifts electricity use between hours, check whether the available factor reflects when that shift happens. A regional annual factor can still be a rough screening input when hourly data are unavailable.
4. Which emissions does the calculation include?
An operating estimate can answer how much grid CO₂ the lighting upgrade might avoid through lower electricity use. A lifecycle comparison asks a broader question and may also need to account for producing, shipping, installing, and disposing of fixtures. A project that replaces working equipment early can have a different lifecycle result from one that installs the same efficient model at the end of the old equipment’s useful life.
Ask what is included on both sides of the comparison. For purchased electricity, check whether the factor is based on electricity generated or delivered and whether grid losses are already included. For a project that changes fuels or introduces a new material, list the emissions that move from one part of the system to another. If the data cover operations only, label the result “estimated operating emissions avoided” so readers know its scope.
5. Do the units and time period match?
Check the input and factor before trusting the output. A factor expressed per megawatt-hour needs activity in megawatt-hours or a conversion to kWh. One metric tonne is 1,000 kilograms. CO₂ describes carbon dioxide, while CO₂e expresses the warming impact of included greenhouse gases on a common basis. Keep the label that matches the factor and the gases it covers.
A first-year estimate also differs from a forecast over an asset’s working life. Multiplying by ten assumes the annual savings persist for ten years and that any factors held constant remain suitable for the calculation. For a multi-year decision, document how runtime, equipment replacement, and the electricity mix could change. Label constant-factor projections clearly so the reader can see what drives the forecast.
6. How much does the result move when assumptions change?
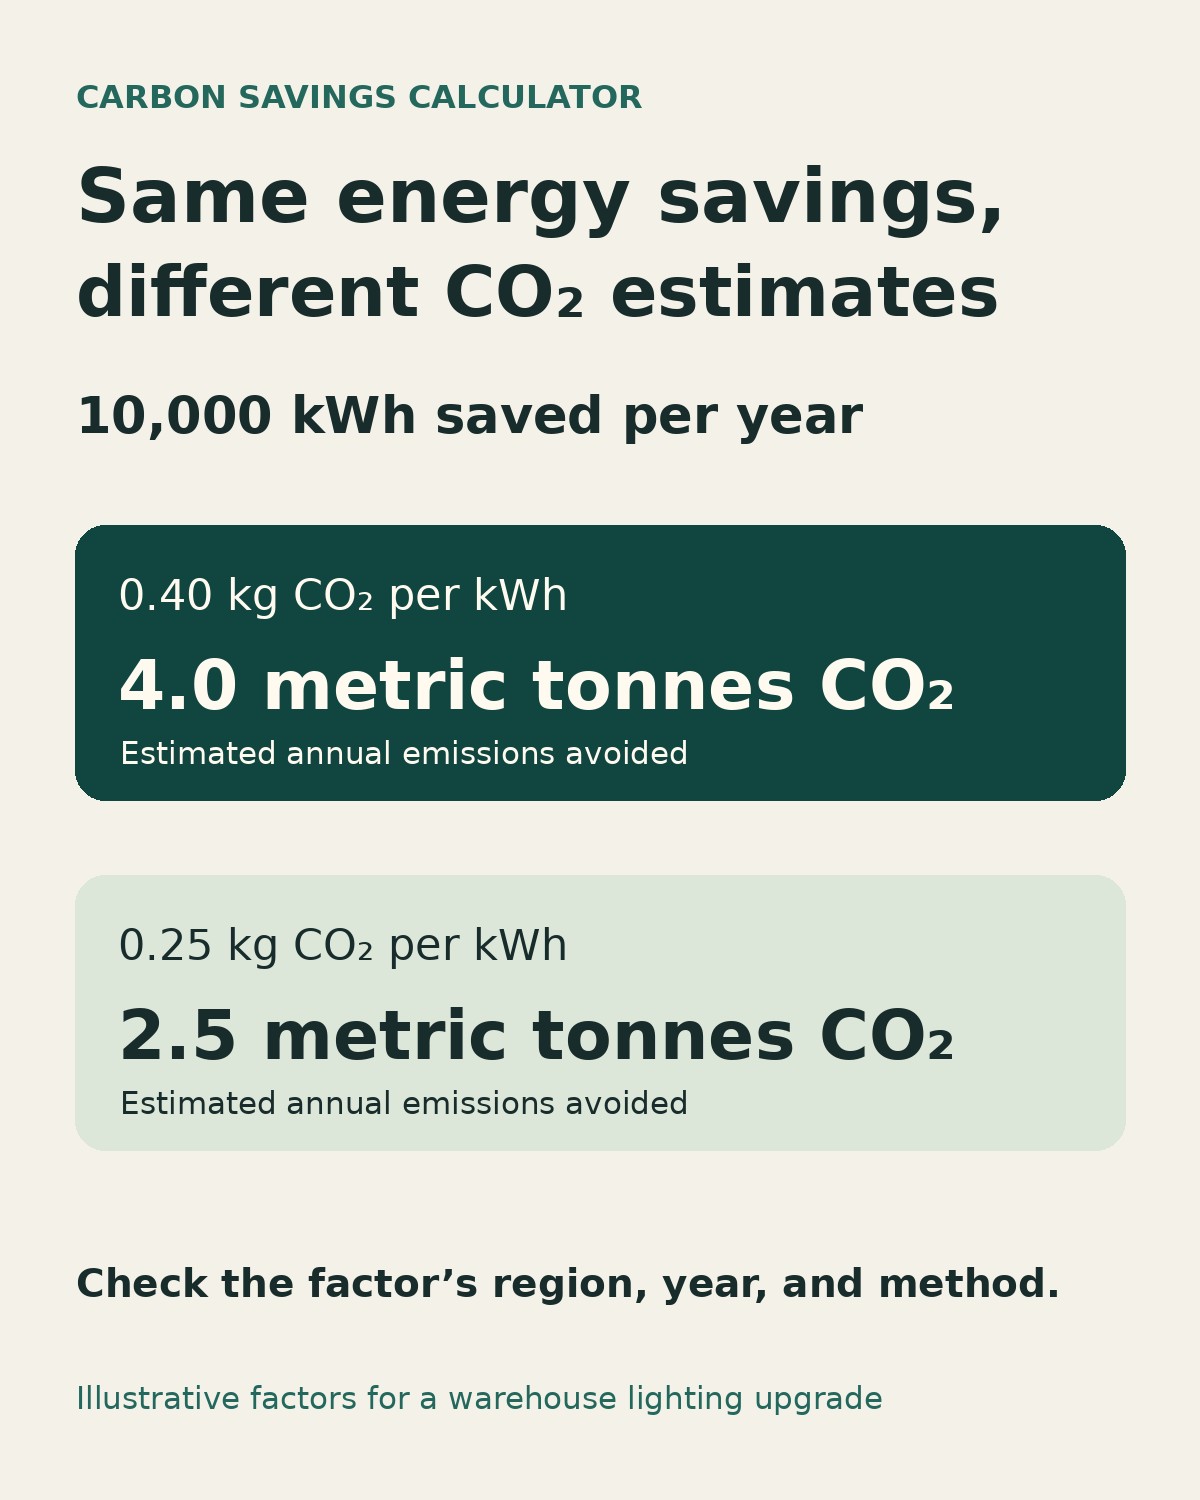
Recalculate the result with values you can defend as plausible. Start with runtime and the emissions factor in the warehouse example. At 10,000 kWh saved and an illustrative rate of 0.40 kg CO₂/kWh, the estimate is 4.0 metric tonnes of CO₂ per year. If reduced shifts bring savings down to 8,000 kWh and you use an illustrative rate of 0.25 kg CO₂/kWh, it becomes 2.0 tonnes.
| Scenario | Annual electricity saved | Illustrative factor | Estimated annual CO₂ avoided |
|---|---|---|---|
| Initial estimate | 10,000 kWh | 0.40 kg CO₂/kWh | 4.0 metric tonnes |
| Lower runtime only | 8,000 kWh | 0.40 kg CO₂/kWh | 3.2 metric tonnes |
| Lower factor only | 10,000 kWh | 0.25 kg CO₂/kWh | 2.5 metric tonnes |
| Both changes | 8,000 kWh | 0.25 kg CO₂/kWh | 2.0 metric tonnes |
These rates are hypothetical. The table shows how changing one input at a time helps identify where better evidence matters. If two technologies trade places under plausible scenarios, verify the inputs that drive the decision before treating either option as the clear winner.
7. Who can use the result, and what can they claim?
A project estimate is a comparison with a baseline. When an installer and a building owner both describe the same retrofit, they can identify their roles and the shared project. If a portfolio report combines results from both, the project should appear only once in the total. Give the calculation a project identifier and a defined reporting period so overlapping records are easy to spot.
Keep the estimate tied to its intended use. The GHG Protocol’s comparison of inventory and project accounting explains why project-based avoided grid emissions are reported separately from scope 2 inventory totals. A calculator result alone also establishes neither independent verification nor issuance of carbon credits. If the figure goes into a proposal, save the input values, factor source, date, baseline, exclusions, and model version alongside it. A colleague should be able to reproduce it when the proposal is reviewed.
Keep the assumptions with the estimate
A carbon savings calculator is most useful when someone can see how the number was built and update it as conditions change. Whether you are evaluating a warehouse upgrade or exploring everyday ways to lower household emissions, give the result a baseline, a period, a clear emissions boundary, and a factor that matches the question. If a change to one input materially shifts the answer, keep that range beside the headline estimate.