GA4 has dozens of reports, and most of them were built for marketers and ad buyers, not editors. After almost 10 years in SEO and content writing, including my time as acting editor at Editorialge, I have boiled it down to a short list. These are the GA4 reports; content teams need to decide what to write, what to fix, and what to leave alone.
Here are the eight, in the order I check them:
- Pages and screens
- Landing page
- Traffic acquisition (with the new AI Assistant channel)
- Google Organic Search Queries
- Google Organic Search Traffic
- Content groups
- Events and key events
- Dashboards
1. Pages and Screens: Why It Leads the GA4 Reports Content Teams Need
This is the first report I’ve opened. It shows every page on the site with views, users, and average engagement time. You find it under Reports > Engagement > Pages and screens.
The default view hides the most useful number. Engagement rate is not in the table by default, so add it with the Customize report. You need an editor or administrator role for that.
Why does it matter? GA4 counts a session as engaged if it lasts longer than 10 seconds, has a key event, or has two or more page views. So a page with high views and a low engagement rate is getting clicks but losing readers fast.
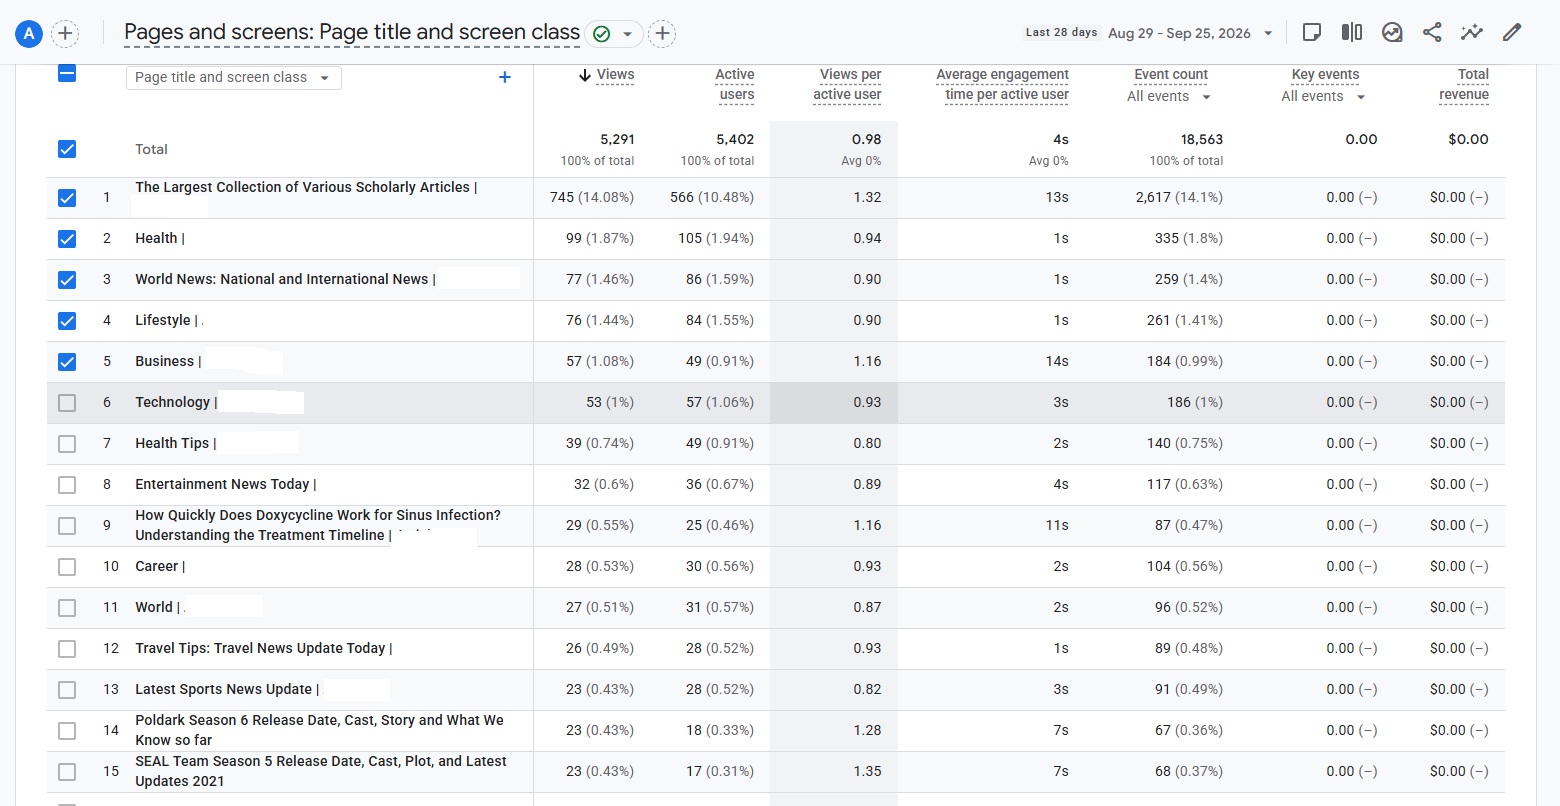
I have seen this on our own site. One page sat near the top of the views list, but readers left it quickly. Views alone would have called it a winner. When I see that pattern now, I check three things:
- Does the title promise something the first screen does not deliver?
- Is the answer buried under a long intro?
- Is the page slow or cluttered on mobile?
For a deeper look at which numbers to pair with views, see our guide to analytics metrics for SEO content.
2. Landing Page: The GA4 Reports Content Teams Need for Entry Points
Pages and screens count every view. The landing page report only counts the page where a session started. For content teams, that is the real front door.
A guide can look average in pages and screens but be a top entry point from search. That page deserves more care than its view count suggests. I use this report to pick refresh targets. If a landing page’s sessions drop month over month, it is often the first sign of content decay.
Set the comparison to the previous period or the same period last year. Seasonal topics will fool you if you compare the wrong months.
3. Traffic Acquisition: GA4 Reports Content Teams Need Now to Include AI Traffic
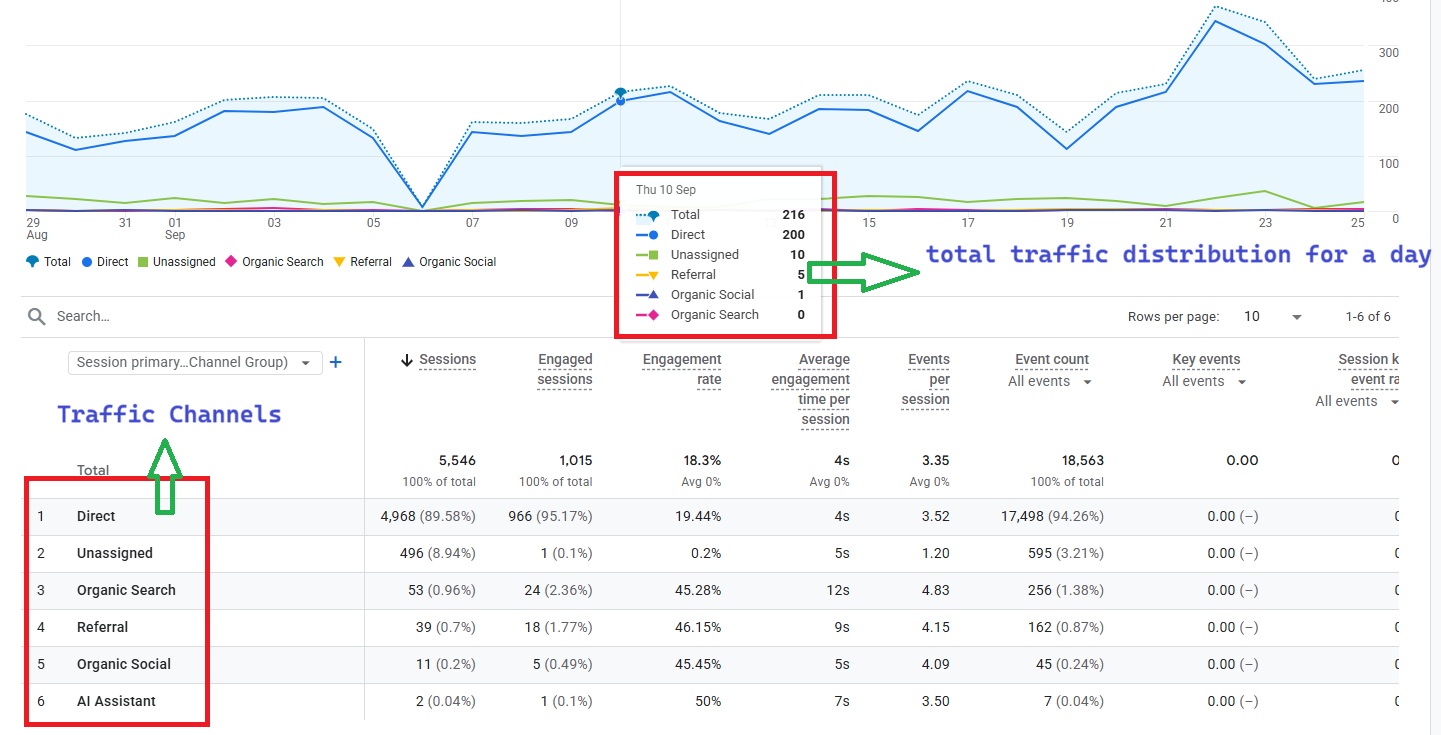
The traffic acquisition report shows where sessions come from, grouped by channel: organic search, direct, referral, organic social, and more.
The big change this year: on May 13, 2026, Google added an AI Assistant channel to the default channel group. Visits from recognized AI tools like ChatGPT, Gemini, and Claude now get the medium “ai-assistant” and their own channel. No setup is needed.
On the sites I manage, this channel started showing real visits soon after the rollout. That changed how I talk about “SEO traffic” with the team. Some readers now reach us through an AI answer, not a search results page.
Keep a few limits in mind:
- The channel only works when the AI tool passes a referrer. Visits without one still fall into Direct.
- Google’s own AI features, like AI Overviews, still count as organic search.
- Older AI visits stay in referral. If you want history, build a custom channel group.
If you want to go further than GA4 on this, read our piece on AI performance analytics.
4. Google Organic Search Queries: Keyword Data Among the GA4 Reports Content Teams Need
Once you link Search Console to GA4, you get two new reports. Many teams never see them because the Search Console collection is unpublished by default. Go to Library in the left menu and publish it.
The Google Organic Search Queries report shows the search terms that brought clicks and impressions, plus position and click-through rate. I use it to spot queries where we rank on page one but get few clicks. That usually means the title or meta description needs work.
Two things to know. Search Console data shows up about 48 hours late, and GA4 only keeps 16 months of it.
5. Google Organic Search Traffic: Clicks Plus Behavior in the GA4 Reports Content Teams Need
I find this one more useful than the queries report. It lists landing pages with Search Console metrics (clicks, impressions, position) next to GA4 metrics (engagement, key events).
That lets you ask a better question: not just “Does this page rank?” but “Do searchers stay once they arrive?”
A page with strong clicks and weak engagement has a promise problem. A page with strong engagement but low clicks has a visibility problem. The fixes are different, so this split saves time.
One catch: Search Console metrics only work with a few GA4 dimensions, such as Landing Page, Device, and Country. You cannot slice them by author or content group.
6. Content Groups: Hub-Level GA4 Reports Content Teams Need
Single pages tell you about single articles. Content groups tell you how a whole section is doing.
At Editorialge, we group pages by hub, like SaaS & Startups, EdTech, and Gaming. In Pages and screens, you can switch the main dimension to the Content group and compare hubs side by side. That helps with bigger calls, like where to put next quarter’s writing hours.
Content groups need setup. You send a content_group value with your page views through your site code or Google Tag Manager. They also do not fill in past data, so set them up early.
7. Events and Key Events: The Action Side of GA4 Reports Content Teams Need
Views and time only tell you someone was there. Events tell you what they did.
With enhanced measurement on, GA4 tracks scrolls (when a reader reaches about 90% of the page), outbound clicks, and file downloads without extra code. Content teams can then mark the actions that matter as key events. GA4 used to call these “conversions.”
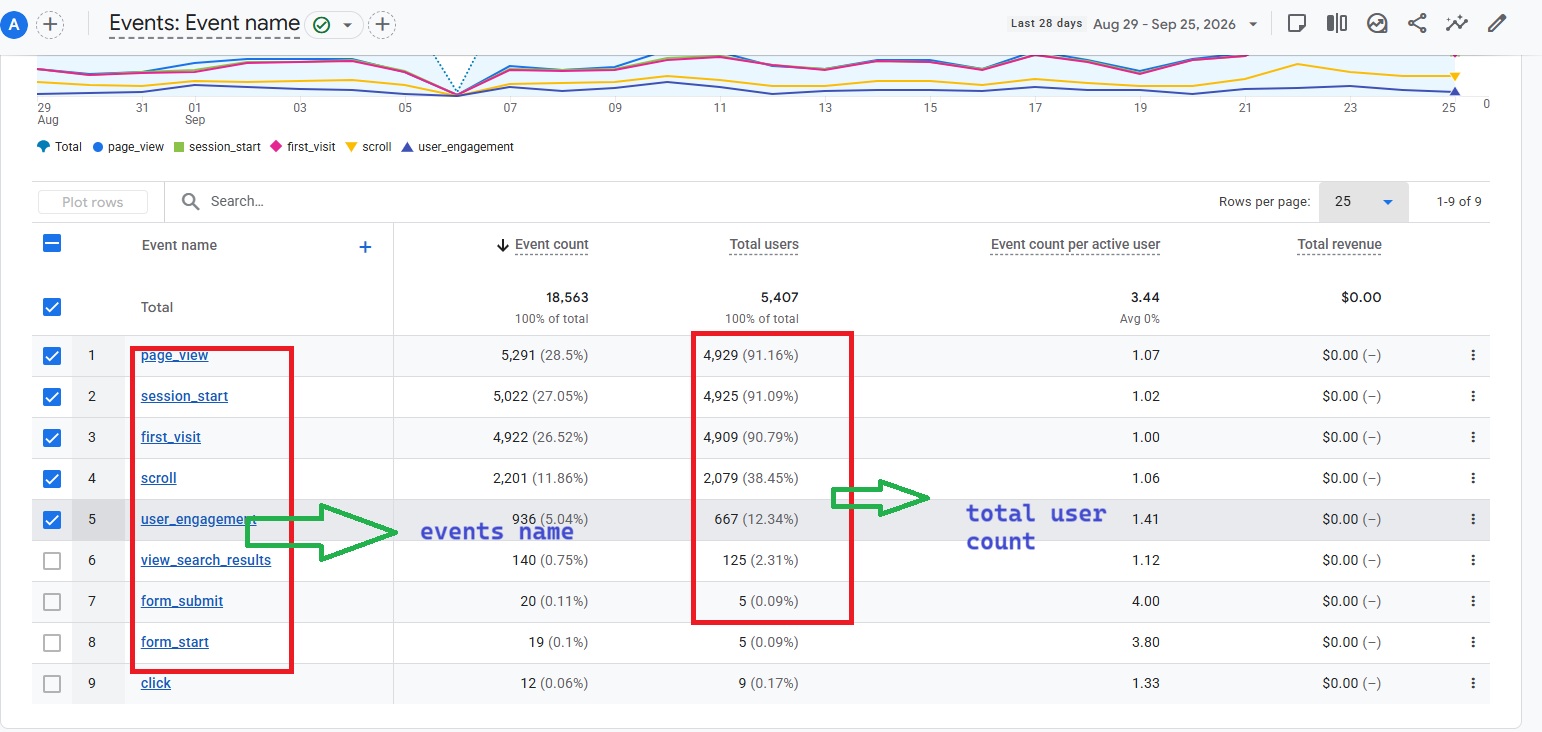
Good key events for content sites:
- Newsletter sign-ups
- Clicks to a product or tool page
- Internal clicks to a pillar page
If a long guide gets plenty of scrolls but no sign-ups, the content works and the call to action does not.
8. Dashboards: The Newest of the GA4 Reports Content Teams Need
Google launched Dashboards in GA4 on September 9, 2026. It is the first time you can build a one-page KPI view inside GA4 without Looker Studio.
You drag in scorecards, tables, line charts, bar charts, donut charts, and funnels. Once published, the dashboard sits in the Reports menu, and anyone with property access can view it.
My advice is to build one dashboard for the content team that pulls from the reports above: top landing pages, engagement rate, AI Assistant sessions, and key events. Keep in mind the limits. Standard properties get up to 15 cards per dashboard, and segments are not supported yet.
If GA4 still feels too heavy for a small team, it is worth comparing some Google Analytics alternatives.
Mistakes That Skew the GA4 Reports Content Teams Need
- Judging pages by views alone. High views with low engagement is a warning, not a win.
- Skipping the Search Console link. Without it, you miss query data inside GA4.
- Ignoring spam traffic. GA4 now supports hostname include filters, so only your approved domains can send data. Use them.
FAQs About GA4 Reports Content Teams Need
1. Which GA4 report is best for finding content decay?
The landing page report, compared against the previous period. Pair it with Google Organic Search Traffic to see if the drop comes from rankings or clicks.
2. Does GA4 show traffic from ChatGPT?
Yes. Since May 2026, recognized AI assistant visits have appeared in the AI Assistant channel in traffic acquisition. Visits without a referrer still show up as Direct.
3. Do I need Looker Studio for content reporting?
Not anymore for basic needs. GA4 Dashboards cover a simple KPI view. Looker Studio is still better for blending data from many sources.
Final Thoughts
You do not need every report in GA4. Start with Pages and screens and add engagement rate. Then publish the Search Console collection, check the AI Assistant channel, and set up content groups by section. Those steps alone cover most of the GA4 reports content teams need.
Once that is done, build one shared dashboard and review it every week. Consistent checks will teach you more than a dozen reports you open once a quarter.