
An SEO dashboard can look healthy while the content behind it does very little. Clicks and average position rise, yet qualified leads or sales remain flat. The numbers may be accurate; the report may simply favor what is easy to collect.
Useful analytics metrics for SEO content answer four questions: Did the page appear? Did searchers choose it? Did they find it useful? Did the visit contribute to a meaningful result? The order follows that journey rather than ranking the metrics. Evaluate individual landing pages or related content groups instead of relying on one sitewide average.
Indexing, crawl health, Core Web Vitals, and link acquisition still need attention, but they belong in separate technical or authority reports.
What a Neat SEO Dashboard Usually Hides
Google Search Console and Google Analytics 4 do not describe the same event. Search Console records impressions and clicks in Google Search. GA4 starts measuring after the page loads and its analytics setup collects data. One click therefore does not have to produce one session.
Privacy protections, processing, time zones, JavaScript availability, and tracking configurations can widen the difference. Use Search Console to judge search visibility and GA4 to examine behavior and outcomes. When comparing them, align dates, countries, devices, landing pages, and channel filters first.
9 Analytics Metrics for SEO Content Worth Tracking
Analytics Metrics for SEO Content reveal more than traffic growth. They show whether pages earn visibility, attract the right clicks, hold attention, and contribute to meaningful outcomes. Read these nine metrics together, since relying on rankings, sessions, or engagement alone can hide the performance problems affecting your content strategy.
1. Organic Clicks
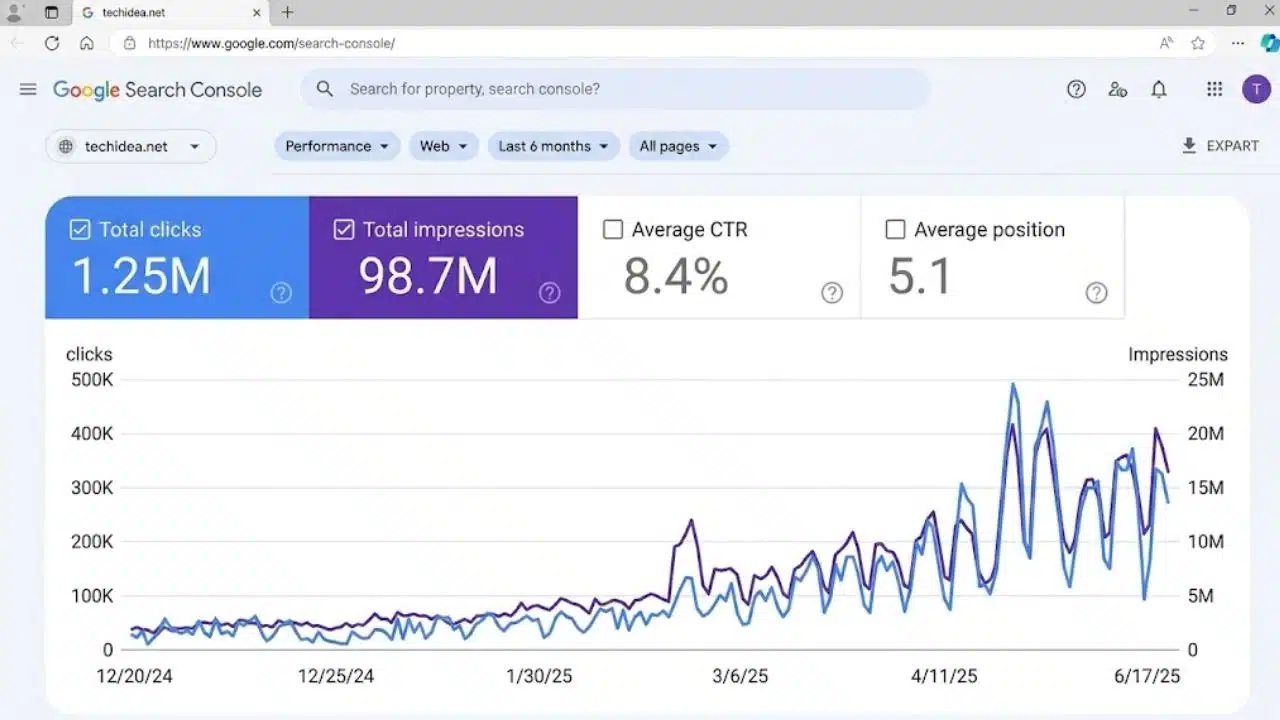
Organic clicks are the clearest starting measure of traffic earned from Google Search. An impression means a result appeared; a click means someone selected it.
Break clicks down by page, query, device, and country. Separate branded and non-branded searches where the available query data permits it. Growth from people already searching for a publication differs from growth across problem-led queries.
Account for seasonality. A holiday article may decline month over month while performing well year over year. If clicks fall, check impressions and position before rewriting. Demand may have dropped, visibility may have slipped, or the result may no longer attract attention.
2. Search Impressions
Impressions are underrated because they do not send anyone to the site. For new or updated pages, however, they can show that Google has started surfacing the content before meaningful click volume develops.
More impressions are not automatically good news. A page may appear for broad or weakly related searches. Rising impressions with flat clicks can point to emerging rankings, an unconvincing snippet, or a mismatch with search intent. Inspect the underlying queries.
Early impression growth may justify giving a new article more time. A sustained decline across an established page’s main queries calls for closer investigation.
3. Organic Click-Through Rate
Organic click-through rate, or CTR, is clicks divided by impressions. It measures how often searchers selected an appearing result.
Generic “good CTR” benchmarks are rarely useful. CTR changes with position, intent, device, brand familiarity, and search-result layout. A glossary page competing with direct answers cannot be judged like a commercial comparison page. Compare each URL with its past performance and similar pages.
Prioritize pages with substantial impressions, stable positions, and declining CTR. Their titles may be vague, dated, or misaligned with the query. Improve accuracy and specificity before making a bigger promise. A headline that earns the wrong click solves little.
4. Average Position, Used Carefully
Average position is the most overrated of these analytics metrics for SEO content. Search Console averages the topmost position associated with the selected property or page across its impressions. It can blend queries, countries, devices, and search features into one deceptively tidy number.
A move from 12 to 9 means little if it came from irrelevant queries. A page can also gain clicks while average position falls because it appears for more searches.
Use position at the page-and-query level, beside clicks and impressions. Treat it as a diagnostic clue, not a business outcome.
5. Organic Sessions
Search Console clicks end at the search result. Organic sessions in GA4 show visits attributed to organic search after site measurement begins. This connects landing pages with navigation, engagement, and key events.
Clicks and sessions will not match perfectly. Watch for abrupt changes instead. If clicks remain steady while GA4 organic sessions fall sharply, inspect the analytics tag, consent behavior, redirects, channel definitions, and affected templates.
For visit-level analysis, use Session default channel group or Session source/medium. First-user dimensions describe the original acquisition, not the current session.
6. Engagement Rate
In GA4, an engaged session lasts longer than 10 seconds, contains a key event, or includes at least two page or screen views. Engagement rate is the percentage meeting one of those conditions.
It is more useful than treating every single-page visit as a failure, but it is not a content-quality verdict. Someone can find a concise answer, leave satisfied, and still fail the test.
Compare similar formats. Calculators, news reports, and glossary entries invite different behavior. A sudden decline across one template deserves attention; a modest difference between unrelated formats may not.
7. Average Engagement Time per Session
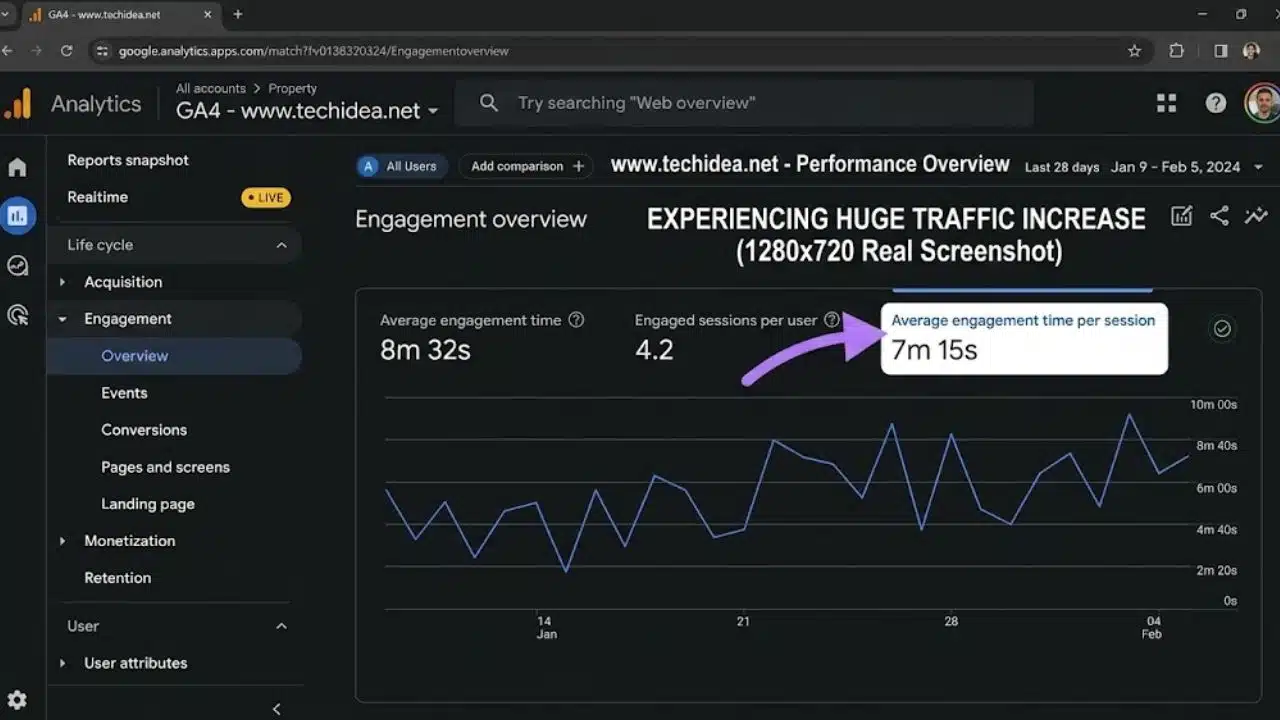
Average engagement time per session estimates how long the site was in focus in a browser or foreground on a device. An open tab alone does not represent active reading.
Longer is not automatically better. Read the metric beside content length, intent, scroll behavior, and key events. If a guide earns clicks but little engaged time, inspect its opening, mobile layout, and how far readers must go to reach the answer.
8. Organic Session Key-Event Rate
This is where analytics metrics for SEO content begin connecting visits with action. In GA4, session key-event rate is the percentage of sessions in which a user triggered a key event.
Choose actions that reflect the site’s purpose. Depending on the business model, that could mean:
- A qualified enquiry or booked consultation
- A purchase, paid subscription, or account creation
- A newsletter signup or completed tool interaction with clear value
Do not mark routine page views or minor clicks as key events to improve the rate. Test each event and separate actions with different values. A newsletter signup and a sales enquiry should not disappear into one flattering total.
9. Revenue or Qualified Lead Value from Organic Content
This is the hardest metric on the list and usually the most valuable. Ecommerce sites can connect organic landing pages with purchase revenue. Publishers may examine subscriptions or ad revenue. Lead-generation sites need CRM data and qualification because a submitted form says little about whether the enquiry became an opportunity.
Attribution complicates the picture. A reader may discover a guide through search, return through email, and convert later. Review landing pages alongside attribution paths before giving the final channel all the credit.
Smaller sites do not need a complicated value model immediately. Start by separating qualified from unqualified leads and recording which organic pages influenced them. That is more credible than attaching precise monetary values to weak data.
Final Thoughts
Start with a page-level report containing clicks, impressions, CTR, position, organic sessions, and one meaningful outcome. Add engagement metrics when they explain performance. Check anomalies weekly, but make editorial decisions from longer comparisons that account for seasonality.
The right analytics metrics for SEO content should lead to a decision: protect a strong page, improve a weak result, refresh lost visibility, repair measurement, or invest in qualified demand. If a number never changes what the team does, remove it from the dashboard.
FAQs
How often should SEO content metrics be reviewed?
Use weekly checks to catch tracking failures and sudden losses. Monthly reviews suit editorial decisions, while quarterly and year-over-year comparisons reveal seasonality and content decay. A few volatile days are rarely enough reason to rewrite a stable page.
Should bounce rate be included in an SEO content report?
It can be, but GA4 bounce rate is the inverse of engagement rate. Keeping both usually adds clutter. Choose the one your team interprets consistently and pair it with a useful outcome.
How long should a new article be measured before it is judged?
There is no fixed waiting period. Demand, competition, indexing, internal discovery, and seasonality affect the timeline. Watch early impressions and technical status, but avoid judging a page from a short window unless it has an obvious factual, indexing, or tracking problem.