
If you don’t know how to forecast SaaS revenue with limited data, start with the recurring revenue you already have and model the specific events that can change it: new customers, upgrades, downgrades, reactivations, and cancellations. Then estimate new revenue from real pipeline or conversion data and build several scenarios instead of relying on one confident-looking number.
I would choose a simple spreadsheet with clear assumptions over a complicated model built on weak evidence. Limited data makes uncertainty unavoidable. The goal is not to hide that uncertainty. It is to understand it well enough to make sensible decisions about hiring, spending, sales, and cash.
Decide What You Are Actually Forecasting
“Revenue” can describe several different numbers in a SaaS business. Mixing them together is one of the quickest ways to create an unreliable forecast.
| Metric | What it represents |
| Bookings | The value of customer commitments |
| Billings | The amount invoiced to customers |
| Collections | Cash the business has received |
| MRR | Normalized monthly recurring revenue |
| ARR | The annualized recurring revenue run rate |
| Recognized revenue | Revenue earned as the service is provided |
MRR and ARR are useful operating metrics, but they are not the same as accounting revenue.
Suppose a customer signs a $12,000 annual subscription on January 1 and pays the full amount upfront. The booking, billing, and collection may all be $12,000 in January. However, the subscription contributes $1,000 in MRR. For a straightforward SaaS subscription, the company would generally recognize the revenue over the period in which it provides the service.
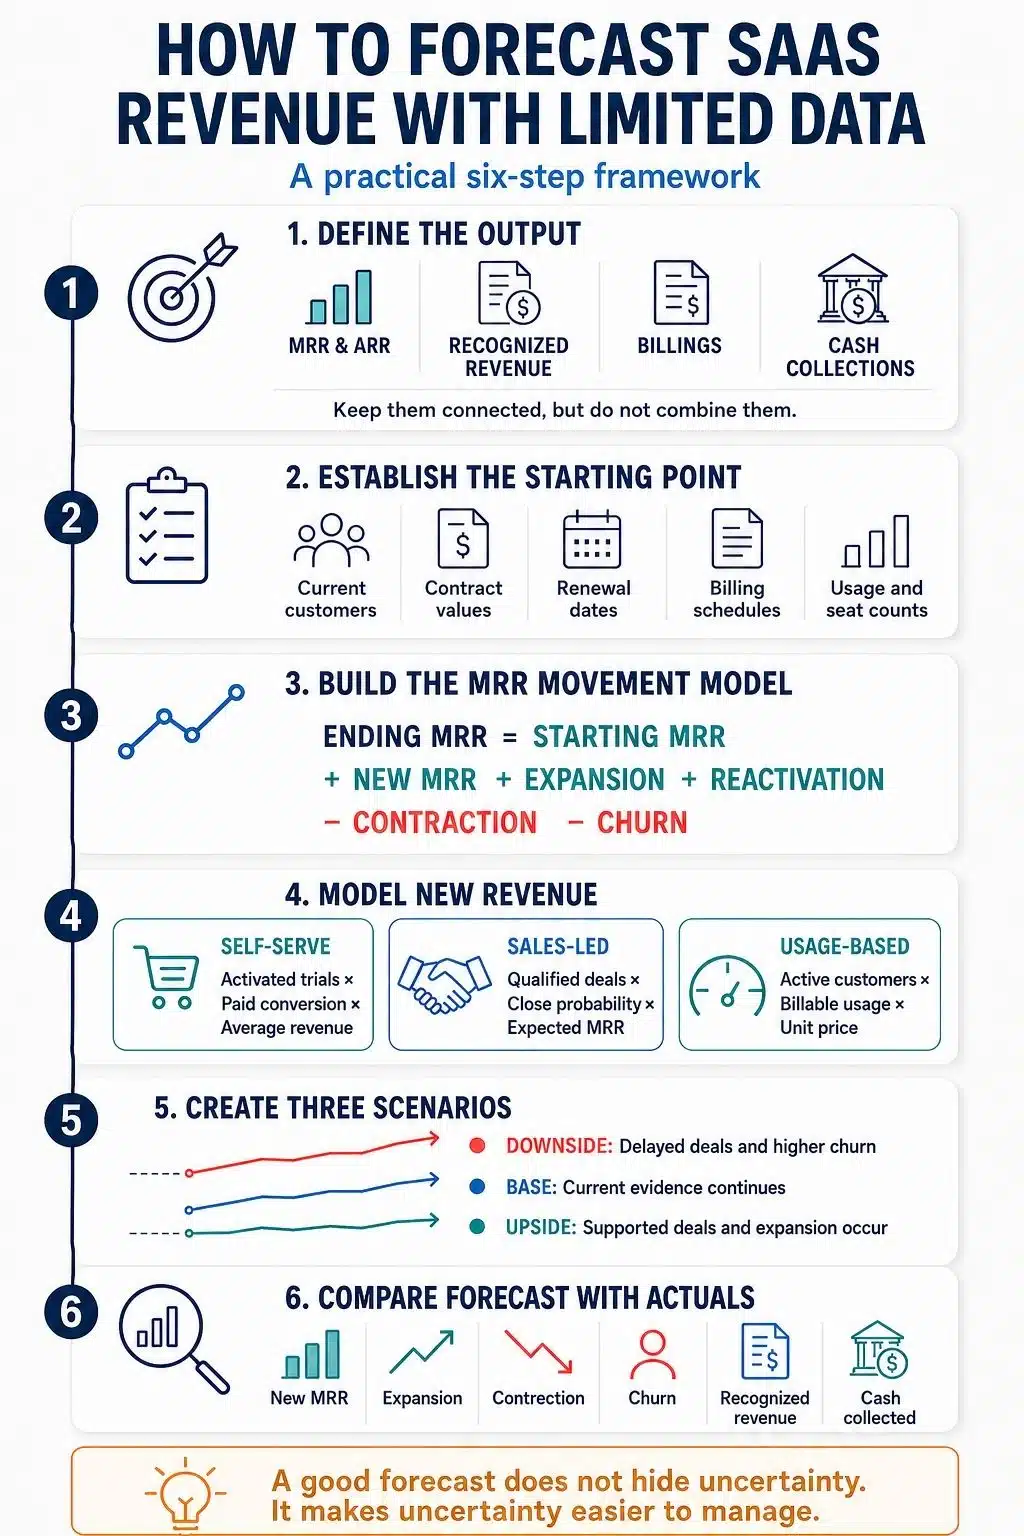
That is why I recommend keeping three connected forecasts:
- An MRR and ARR forecast
- A recognized revenue forecast
- A cash collection forecast
This separation prevents a strong month of annual prepayments from creating a misleading picture of ongoing revenue.
Gather the Minimum Data You Need
You do not need years of financial history to start forecasting. You do need a reliable baseline.
For every paying customer, collect:
- Current recurring contract value
- Plan or customer segment
- Contract start and renewal dates
- Monthly or annual billing schedule
- Subscription status
- Discounts and expected price changes
- Known upgrades, downgrades, or seat changes
- One-time fees separated from recurring charges
For new business, collect the information that matches your acquisition model. A sales-led company may need pipeline stages, deal values, expected close dates, and service-start dates. A self-serve company may need signup, activation, trial, and paid-conversion data.
If pricing depends on usage, track the billable units, committed minimums, effective rates, and recent consumption for each important customer.
The goal is not to collect every metric available. It is to find the few inputs that directly create or remove revenue.
Build the Forecast Around MRR Movements
A practical SaaS forecast begins with the MRR movement formula:
Ending MRR =
Starting MRR
+ New MRR
+ Expansion MRR
+ Reactivation MRR
− Contraction MRR
− Churned MRR
Each component tells a different part of the story:
- New MRR comes from newly acquired customers.
- Expansion MRR comes from upgrades, additional seats, or greater usage.
- Reactivation MRR comes from former customers who return.
- Contraction MRR is lost when customers downgrade or reduce usage.
- Churned MRR disappears when customers cancel completely.
Each month’s ending MRR becomes the following month’s starting MRR.
I prefer this approach to applying one general growth rate. A company may grow 8% in a month because it signed several large customers, even while churn quietly worsened. Extending that 8% growth into every future month would ignore what is happening underneath the total.
An MRR movement model shows not only how much the company may grow, but what must happen for that growth to occur.
Forecast Existing Customers Before New Sales
Current customers usually provide the most defensible part of an early SaaS forecast. Start with them before estimating revenue from people who have not bought anything yet.
When the customer base is small, forecast valuable accounts individually. For each account, consider:
- Current monthly value
- Remaining contract period
- Renewal date
- Cancellation rights
- Payment concerns
- Product usage
- Planned seat changes
- Renewal discussions
- Expansion or downgrade signals
This is more meaningful than applying one average churn rate to a tiny customer base.
Imagine a company with ten customers. If one customer cancels, its customer churn rate may be 10%. But if that account generates half of the company’s MRR, the immediate revenue loss is 50%.
Customer concentration should therefore be visible in the forecast. A realistic downside case might show what happens if the largest customer cancels, reduces usage, or delays renewal.
What If You Have Not Recorded Any Churn?
No recorded churn does not prove that future churn will be zero. Customers may not have reached their first renewal yet. Annual contracts can delay visible churn, while early customers may receive an unusual amount of attention from the founders.
When there is not enough churn history, I would use:
- Known account-level renewal information
- A conservative downside assumption
- A relevant external benchmark as a reference point
Benchmarks should not be copied without context. Retention varies according to contract value, customer type, product maturity, pricing, and sales model. A low-cost self-serve product should not assume it will retain customers like an enterprise platform with long contracts and dedicated account management.
As more data becomes available, customers can be grouped into meaningful cohorts based on signup period, plan, acquisition channel, company size, or contract type. However, dividing twelve customers into ten different segments creates detail without producing dependable insight.
Estimate New MRR From the Way You Acquire Customers
The right new-revenue model depends on how the company sells its product.
Self-Serve or Product-Led SaaS
A simple product-led forecast can begin with:
New MRR =
New Paying Customers
× Starting Average Revenue per Account
New paying customers may be estimated from the acquisition funnel:
Visitors
× Signup Rate
× Activation Rate
× Paid Conversion Rate
The formula is simple, but the inputs may not be. Multiplying several uncertain conversion rates can create a result that looks far more precise than it really is.
When data is thin, I prefer to forecast from the deepest reliable stage of the funnel. If activated trials consistently produce paid customers, forecast from activated trials rather than total website traffic.
Timing matters as well. People who arrive this month may not become paying customers until next month. The forecast should reflect the normal conversion delay instead of assuming that every step happens immediately.
Sales-Led SaaS
For a sales-led business, begin with named opportunities:
Expected New MRR =
Opportunity ACV ÷ 12
× Estimated Close Probability
× Expected Start Timing
A weighted pipeline can be helpful, but it needs context.
Suppose the pipeline contains one $100,000 opportunity with a 60% estimated chance of closing. Its weighted value is $60,000. That does not mean the company is likely to receive exactly $60,000. The practical outcomes are closer to winning the full deal, losing it, or seeing the decision move into a later period.
When the pipeline contains only a few large deals, model those outcomes separately. Do not let a probability-weighted total create the illusion of smooth, predictable revenue.
For periods beyond the current pipeline, new revenue can be estimated from:
Sales Capacity
× Ramped Productivity
× Expected Deal Value
This calculation should account for hiring dates, representative ramp time, average sales-cycle length, implementation delays, and onboarding capacity.
Hiring two salespeople does not double next month’s revenue if they need several months to become productive.
Treat Usage-Based Revenue Separately
Usage-based pricing requires a different approach because customer spending can change even when no one upgrades or cancels.
A useful starting formula is:
Usage Revenue =
Active Customers
× Expected Billable Usage per Customer
× Effective Unit Price
For a hybrid product, separate the predictable and variable components:
Total Forecast Revenue =
Committed Subscription Revenue
+ Forecast Usage Revenue
Committed minimums usually provide the safest baseline. Variable usage can then be estimated from recent customer behavior, known events, and reasonable ranges.
Tiered pricing needs additional care. If the price per unit changes after customers cross certain thresholds, multiplying total usage by one average price may produce the wrong result. The forecast should reflect the actual pricing structure.
I would also avoid declaring a seasonal pattern after one unusual month. A usage spike caused by a product launch, temporary campaign, or single large customer is not automatically evidence of seasonality.
Translate MRR Into Revenue and Cash
Once the MRR forecast is complete, translate it into recognized revenue, billings, and expected collections.
For a standard subscription, recognized revenue is generally spread across the service period. Annual prepayments may bring cash into the business immediately, but they do not normally become fully recognized revenue on the payment date.
One-time services should be handled separately. Implementation, training, consulting, and setup fees may follow different recognition schedules depending on what was promised and when the work is completed.
The MRR forecast can support planning, but it should not be used to invent accounting treatment for a complicated customer contract. When contract terms are unusual, the recognition schedule should be reviewed by someone qualified to interpret the relevant accounting rules.
Build Three Defensible Scenarios
A forecast based on limited data should show more than one possible outcome.
Downside Case
The downside case might assume:
- Important deals take longer to close
- A major renewal is lost
- Churn or contraction increases
- Expansion remains limited
- Customer usage declines
Base Case
The base case should reflect:
- Current customer and contract information
- Qualified pipeline rather than every lead
- Known renewal risks
- Supported expansion opportunities
- Current acquisition performance
Upside Case
The upside case may include:
- Specific high-quality opportunities closing
- Planned customer expansion occurring
- Sales capacity performing better than expected
- Usage increasing for identifiable reasons
An upside case should be supported by real possibilities. Simply adding 25% to the base forecast does not explain where the additional revenue will come from.
I also prefer changing only a few important assumptions between scenarios. If acquisition, pricing, churn, conversion, deal size, and usage all change at once, it becomes difficult to understand what is driving the difference.
A Simple SaaS Revenue Forecast Example
Consider a SaaS company with the following monthly numbers:
- Starting MRR: $20,000
- New MRR: $3,000
- Expansion MRR: $700
- Reactivation MRR: $100
- Contraction MRR: $400
- Churned MRR: $1,000
The ending MRR is:
$20,000
+ $3,000
+ $700
+ $100
− $400
− $1,000
= $22,400
The company added $2,400 in net new MRR.
Its month-end ARR run rate is:
$22,400 × 12 = $268,800
That $268,800 is an annualized snapshot of recurring revenue at the end of the month. It is not a guarantee that the company will recognize exactly that amount during the following twelve months. New customers, churn, expansion, contract timing, and usage will continue to change the result.
Compare the Forecast With Actual Results
A forecast improves when the company studies where it was wrong. At the end of every month, compare the original forecast with actual results for:
- New MRR
- Expansion
- Contraction
- Churn
- Ending MRR
- Recognized revenue
- Billings
- Cash collections
Do not overwrite the original forecast. Preserve it so you can see what the company genuinely expected at the time.
It is also important to inspect each revenue movement separately. The total forecast may appear accurate because two mistakes canceled each other out. For example, the company might overestimate both new MRR and churn. The final total looks correct even though the underlying assumptions are unreliable.
For a young company, a few simple accuracy measures are enough:
- Dollar difference between forecast and actual revenue
- Average absolute error
- Whether forecasts are consistently too high or too low
- How often results remain within the projected range
Percentage errors can become misleading when revenue is extremely low or zero. Dollar error and forecast direction are often easier to interpret at that stage.
A simple model should also remain the benchmark. If a complicated forecasting method cannot consistently improve on last month’s result or a basic rolling average, the extra complexity is not providing much value.
An Honest Forecast Is More Useful Than a Perfect-Looking One
Limited data does not prevent a SaaS company from forecasting. It simply limits how much certainty the company can reasonably claim.
Start with the recurring revenue already in place. Model important customers and renewals directly. Estimate new MRR from the acquisition process the company actually uses. Keep accounting revenue and cash timing separate, and show what happens when the most uncertain assumptions change.
The best way to forecast SaaS revenue with limited data is not to disguise uncertainty with elaborate calculations. It is to make that uncertainty clear enough that the business can still plan responsibly.
Frequently Asked Questions on How to Forecast SaaS Revenue with Limited Data
1. How much historical data do I need to forecast SaaS revenue?
There is no universal minimum. You can begin with current contracts, customer-level information, usage, and qualified pipeline data. More history helps only when it still represents the company’s current product, pricing, and sales process.
2. How should I forecast churn if no customers have left?
Do not automatically enter zero. Review upcoming renewals individually, identify revenue concentration, and create a downside scenario. External benchmarks can provide context, but customer-specific evidence should carry more weight.
3. Should I forecast MRR or total revenue?
Forecast both, but keep them separate. MRR shows recurring business momentum. Total recognized revenue may also include usage charges, implementation work, professional services, and other non-recurring items.
4. How often should I update a SaaS revenue forecast?
A monthly update works well for most SaaS companies. Sales-led teams may review pipeline expectations weekly, but the complete forecast should still be reconciled with closed monthly financial results.
5. Which assumption has the biggest effect on a SaaS forecast?
It depends on the business. New customer acquisition, churn, deal timing, average customer value, expansion, and usage are common drivers. A simple sensitivity test will show which assumption has the greatest effect on your forecast.