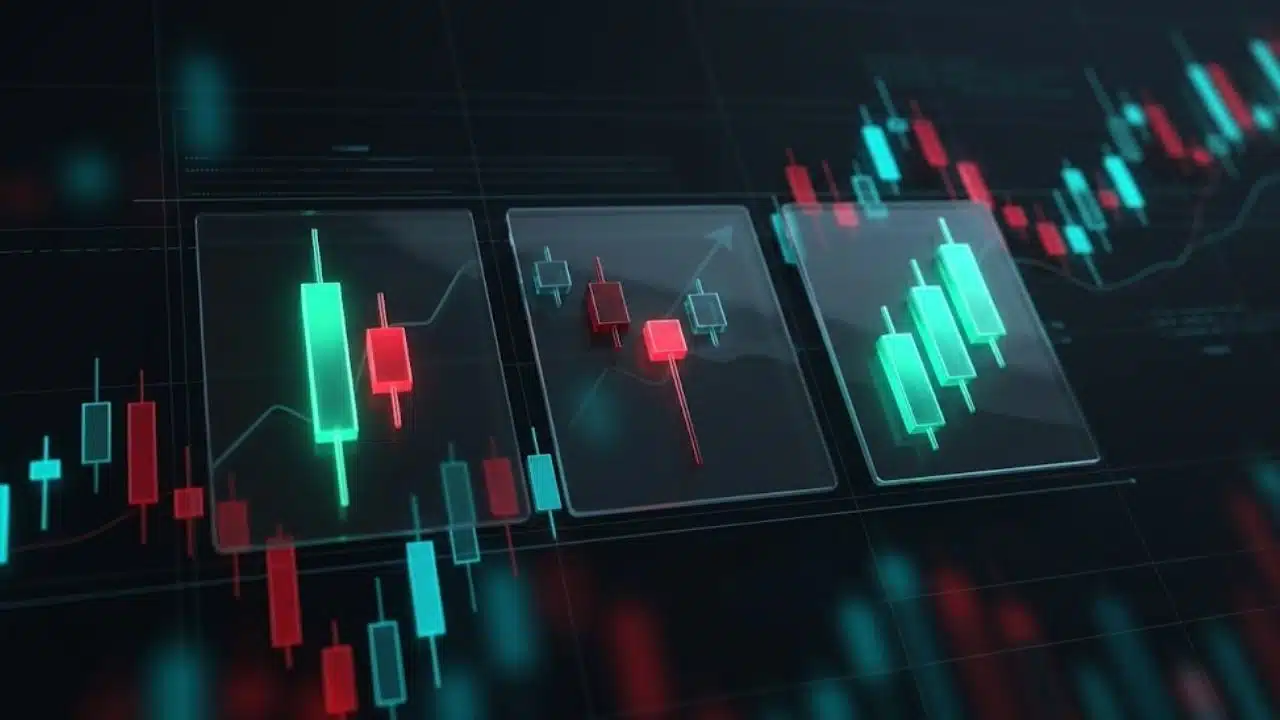
Candlestick patterns help traders understand how price moved during a specific period and what buyers and sellers may do next. Each candle shows the opening, closing, highest, and lowest prices, while combinations of candles can reveal momentum, hesitation, or a possible reversal.
Although no pattern can predict the market with certainty, learning to read these signals can make chart analysis clearer and more disciplined. This guide explains the most useful patterns, their meanings, and how to apply them responsibly and effectively.
- What are candlestick patterns? Candlestick patterns are graphical representations of price movements across a specified timeframe, displaying the open, high, low, and close (OHLC) prices within a candle body and wicks.
- Why do traders use them? They provide immediate visual cues regarding market sentiment, buying and selling pressure, and potential trend continuation or reversal zones.
- The hidden limitation: Traditional Japanese candle formations only show historical traded prices; they do not reveal resting liquidity, limit orders, or aggressive volume hidden within each candle.
- How to improve accuracy: Pairing candlestick price action patterns with visual order-flow platforms like Bookmap allows traders to verify institutional volume, detect absorption, and eliminate false breakout signals.
Foundations of Price Action and Market Charting
Financial market speculation relies on interpreting the continuous struggle between buyers and sellers. Before diving into specific formations, traders must understand the broader framework of market charting.
Technical analysis chart patterns
Technical analysis is rooted in the principle that historical price behaviour tends to repeat itself. Technical analysis chart patterns represent aggregate market psychology, capturing greed, fear, uncertainty, and institutional positioning. Whether examining traditional geometric shapes—such as head and shoulders, double bottoms, or ascending triangles—or individual bar formations, chart analysis provides a systematic framework for risk management and trade execution.
Charting techniques for financial markets
Modern charting techniques for financial markets have evolved significantly from manual point-and-figure charts on physical grid paper. Today’s traders utilise line charts for high-level trend clarity, bar charts for range assessments, and Japanese candlesticks for detailed intra-session dynamics. However, standard two-dimensional charts omit a crucial variable: depth-of-market liquidity. Incorporating market depth allows you to see the resting orders that actually dictate price boundaries.
Financial price action trading methods
Rather than relying solely on lagging mathematical oscillators like moving averages or the Relative Strength Index (RSI), financial price action trading methods focus directly on raw price movements. Price action traders study swing highs, swing lows, and structural shifts to determine whether the market is expanding, consolidating, or reversing. Japanese candle formations serve as the primary visual language for this discipline.
Market trend reversal indicators
Traders continually search for market trend reversal indicators to help identify when an existing trend is exhausting its momentum. While lagging indicators smooth out historical price data, candlestick formations reflect real-time shifts in session momentum. Identifying these turning points early allows traders to secure advantageous risk-to-reward ratios on entries.
Understanding Japanese Candlestick Formations
Developed in 18th-century Japan by rice merchant Munehisa Homma, candlestick charting remains the most popular visual format in retail and institutional trading.
Japanese candlestick chart patterns
Japanese candlestick chart patterns encode four critical data points for any given period: Open, High, Low, and Close (OHLC).
- The Real Body: The wide section between the open and the close. A green (or white) body indicates bullish expansion (close > open), while a red (or black) body denotes bearish pressure (close < open).
- Upper Shadow (Wick): The line extending above the real body, marking the highest traded price during the session.
- Lower Shadow (Tail): The line extending below the real body, marking the lowest traded price during the session.
Candlestick charting formations
Candlestick charting formations are classified by the number of candles involved:
- Single Candle Formations: Hammers, Shooting Stars, Dojis, and Marubozus that signal immediate localized exhaustion or strong directional conviction.
- Dual Candle Formations: Engulfing patterns, Piercing Lines, and Dark Cloud Covers that compare the current session’s balance of power directly with the previous one.
- Triple / Multi-Candle Formations: Morning Stars, Evening Stars, and Three White Soldiers that map out multi-session structural shifts.
Reading candlestick signals
Reading candlestick signals accurately requires looking beyond the shape of the candle and evaluating the market context. A bullish hammer formed in the middle of a tight, low-volume consolidation zone carries little statistical relevance. However, that same hammer printing directly at a major multi-day support level—accompanied by heavy aggressive buying—provides a actionable trade signal.
Candle pattern technical analysis
To apply candle pattern technical analysis professionally, you must understand what the wicks and bodies communicate about the underlying auction. Long wicks indicate price rejection, showing that aggressive participants attempted to push the market in one direction but met overwhelming counter-liquidity. Conversely, long full bodies with minimal wicks indicate one-sided dominance and strong trend continuation.
Clarifying Your Technical Analysis Strategy
Before risking capital, it is critical to tailor your charting approach to your target market, time horizon, and operational style.
Are you looking for reversal or continuation candlestick patterns?
Clarifying your directional objective determines the type of setups you should track:
- Reversal Patterns: Setups such as Hammer, Shooting Star, Bullish Engulfing, and Evening Star patterns aim to catch the inflection point where a prevailing trend ends and a new trend begins.
- Continuation Patterns: Formations like Rising Three Methods, Bullish Flags, and Marubozu candles indicate that the prevailing trend has paused for brief consolidation and is likely to resume with force.
Which market are you trading, such as stocks, forex, or crypto?
Different financial markets exhibit unique structural traits that influence pattern reliability:
- Equities & Indices: Frequently experience opening gaps due to overnight earnings and macroeconomic releases, making gap-based setups (like Morning and Evening Stars) highly visible.
- Foreign Exchange (Forex): As a continuous 24/5 decentralised market, forex rarely features intra-week price gaps. Candlestick patterns in forex rely almost entirely on wick rejections and overlapping candle bodies.
- Cryptocurrency: Characterised by 24/7 continuous trading, heightened retail participation, and sharp leverage liquidations, leading to frequent extended wicks and false pattern breaks.
Do you need a beginner guide to single candles or multi-candle pattern strategies?
If you are new to technical analysis, mastering single-candle setups (such as Dojis and Hammers) builds the foundation for interpreting multi-candle sequences. Single candles teach you how to evaluate the immediate balance between buyers and sellers, while multi-candle formations show how that balance evolves across multiple auction cycles.
High-Probability Candlestick Setups Across Asset Classes
Let us explore four of the most widely traded candle formations and examine how they perform in specific market environments.
Bullish engulfing candlestick pattern strategy
The bullish engulfing pattern is a two-candle reversal formation that frequently appears at the end of a downtrend.
- Structure: Candle 1 is a bearish candle reflecting the existing downward movement. Candle 2 opens at or below the prior close and aggressively rallies, with its real body completely “engulfing” the real body of Candle 1.
- Execution Strategy: Enter on the close of Candle 2 or on a minor retest of the engulfing candle’s midpoint. Set a stop-loss just below the low of Candle 2. To increase your win rate, use Bookmap to confirm that significant limit buy orders are resting directly beneath the entry zone, providing structural support.
Bearish evening star pattern in forex trading
The bearish evening star is a three-candle reversal pattern that signals the potential exhaustion of an uptrend.
- Structure: Candle 1 is a strong, bullish candle. Candle 2 is a small-bodied candle (or Doji) indicating indecision at the top of the range. Candle 3 is a large bearish candle that closes deeply into the lower half of Candle 1’s body.
- Forex Application: Because 24-hour forex trading rarely produces large physical gaps between candles, look for Candle 2 to print an extended upper wick that tests liquidity before Candle 3 drives downward with expanding volume.
Morning star pattern crypto trading guide
The morning star is the bullish inverse of the evening star, signalling a bottoming formation.
- Structure: Candle 1 is a long red candle confirming downward momentum. Candle 2 forms a small indecisive base near the swing lows. Candle 3 breaks out upward with strong green momentum, closing well above the midpoint of Candle 1.
- Crypto Application: In volatile crypto markets, Candle 2 often triggers stop-loss liquidations below obvious support levels. Checking order-flow volume confirms whether Candle 2 represented genuine institutional absorption rather than continued capitulation.
Three white soldiers candlestick formation rules
The three white soldiers formation is a robust multi-candle continuation or early reversal pattern.
- Rule 1: Three consecutive long-bodied bullish candles must form in sequence.
- Rule 2: Each candle must open within or near the real body of the preceding candle.
- Rule 3: Each candle must close near its high, leaving minimal upper shadows.
- Rule 4: The pattern should ideally emerge from an established consolidation base or after an extended downtrend to confirm genuine institutional accumulation.
Execution, Confirmation, and Pattern Reliability
Not all candlestick patterns carry equal predictive weight. Improving your edge requires understanding the factors that govern pattern reliability.
Which candlestick patterns are most reliable
Empirical market research and institutional backtests show that multi-candle patterns generally outperform single-candle formations. Dual and triple-candle setups—such as Engulfing patterns, Morning/Evening Stars, and Three Inside Up/Down formations—demonstrate higher statistical reliability because they require multi-period confirmation of directional follow-through.
How to trade hammer and doji candles
Hammers and Dojis are among the most frequently observed single-candle formations:
- The Hammer: Features a small real body near the top of the range and a long lower shadow (at least twice the length of the body). It shows that sellers drove price sharply lower during the session, but buyers absorbed the pressure and forced price back up to the open.
- The Doji: Occurs when the open and close are virtually identical, resulting in a cross-like appearance. A Doji represents absolute equilibrium and indecision.
- Trading Strategy: Never trade a Doji or Hammer in isolation. Always wait for the subsequent candle to confirm direction—a bullish close above the Doji high or a strong push away from the Hammer wick.
Combining candlestick patterns with volume indicators
Relying solely on price shapes without volume confirmation is a common pitfall for retail traders. Combining candlestick patterns with volume indicators provides critical context regarding institutional participation. If a bullish engulfing candle forms on below-average volume, it suggests a lack of institutional backing and carries a high risk of failure. Conversely, when a reversal candle prints with surging volume, it confirms that large market participants are driving the move.
Candlestick patterns cheat sheet pdf
Many traders rely on reference guides or a downloadable candlestick patterns cheat sheet pdf to memorize essential formations. The following table summarises the primary candlestick configurations:
| Pattern Name | Number of Candles | Trend Bias | Key Identification Criteria | Typical Market Context |
| Hammer | 1 | Bullish Reversal | Long lower wick (2x body), tiny upper wick | Swing low of downtrend |
| Shooting Star | 1 | Bearish Reversal | Long upper wick (2x body), tiny lower wick | Swing high of uptrend |
| Doji | 1 | Neutral / Indecision | Open and close at virtually identical price | Consolidation or trend peak |
| Bullish Engulfing | 2 | Bullish Reversal | Green body completely covers prior red body | Major support retest |
| Bearish Engulfing | 2 | Bearish Reversal | Red body completely covers prior green body | Major resistance retest |
| Morning Star | 3 | Bullish Reversal | Long red, small middle star, long green | Bottom of multi-day selloff |
| Evening Star | 3 | Bearish Reversal | Long green, small middle star, long red | Top of multi-day rally |
| Three White Soldiers | 3 | Bullish Continuation | Three consecutive long green candles, small wicks | Breakout from accumulation |
Comparing Analysis Methods: Candlesticks vs Order Flow
While traditional Japanese candlesticks remain an effective visual charting method, they possess inherent blind spots when used without supplementary market data.
| Feature | Standard Candlestick Charts | Bookmap Order Flow Visualisation |
| Data Shown | Historical Open, High, Low, Close | Real-time resting liquidity + traded volume |
| Volume Visibility | Aggregate bar volume at bottom of chart | Exact price-level volume bubbles + CVD |
| Order Book Depth | None (Blind to resting limit orders) | Full visual heatmap of Level 2/3 market depth |
| Absorption Detection | Guesswork based on wick size | Visible real-time tracking of passive limit absorption |
| Spoofing Detection | Impossible to detect | Visually reveals orders placed and pulled |
| Execution Precision | Delayed until the candle closes | Millisecond-level precision during live auction |
Why Choose Bookmap for Advanced Pattern Analysis
In modern electronic markets dominated by high-frequency trading (HFT) algorithms and institutional execution algos, trading off static candlestick charts alone leaves you operating with incomplete information. To trade with precision, you must see the mechanics behind each candle formation.
This is why serious retail and professional traders choose Bookmap. Bookmap is a premier market depth visualisation platform that transforms raw order book data into an intuitive, high-definition heatmap.
- See What Happens Inside Every Candle: Instead of waiting for a 5-minute or 1-hour candle to close, Bookmap displays the live auction unfolding inside each tick. You see exactly which price levels are attracting large market participants.
- Identify True Support and Resistance: Traditional candlestick analysis relies on past price highs and lows. Bookmap’s real-time heatmap visualises massive resting limit orders sitting in the order book, letting you spot genuine institutional liquidity walls before price arrives.
- Detect Institutional Absorption: When a candlestick forms a long wick, is it genuine price rejection or simply low volume? Bookmap reveals absorption in real time by displaying volume bubbles colliding with heavy liquidity, giving you immediate confirmation.
- Proven Community Authority: Supported by outstanding independent reviews on Trustpilot, Bookmap is trusted by active futures, equities, and crypto traders worldwide to upgrade their technical analysis and eliminate charting blind spots.
By connecting your broker data feed directly to Bookmap, you move beyond guessing what a candlestick shape means and start trading based on real market liquidity.
[Stop trading blind. Get started with Bookmap today and unlock true order book transparency.]
7 Essential Steps to Validate Candlestick Patterns with Order Flow
To filter out false signals and improve your execution consistency, follow this seven-step validation process:
- Identify the Macro Trend and Key Structural Levels: Locate major support and resistance zones on higher-timeframe candlestick charts before looking for trade entries.
- Spot the Candlestick Formation: Watch for high-probability setups—such as an Engulfing pattern, Morning Star, or Hammer—forming at your predefined structural levels.
- Inspect the Bookmap Heatmap: Check the order book depth around the candlestick’s location. Are there large resting limit orders backing your trade direction?
- Evaluate Volume Bubbles for Aggressive Participation: Confirm that aggressive market orders (represented by Bookmap volume bubbles) are expanding in your intended trade direction.
- Check for Liquidity Pulling and Spoofing: Ensure that resting limit orders supporting your setup are genuine and not being cancelled as price approaches.
- Execute with Precise Risk Boundaries: Place your order with a defined stop-loss anchored behind the validated liquidity level, rather than relying solely on a visual candle wick.
- Manage the Trade Based on Resting Liquidity: Use the Bookmap heatmap to identify where opposing institutional take-profit liquidity is resting, allowing you to set data-driven price targets.
Frequently Asked Questions
Are candlestick patterns accurate on their own?
On their own, candlestick patterns have limited predictive power because they only show past price results, not the underlying order flow that drove those results. Combining candlestick patterns with volume analysis, support/resistance levels, and order book depth tools like Bookmap significantly enhances their accuracy.
What is the best timeframe for trading candlestick patterns?
Higher timeframes (1-hour, 4-hour, daily) are generally more reliable for identifying major market trends and support/resistance zones, as they filter out intraday noise. However, intraday scalpers and day traders use 1-minute to 5-minute charts effectively when pairing candlestick patterns with real-time order-flow data.
What is the difference between a Hammer and a Hanging Man?
Both patterns share the exact same physical appearance: a small real body at the top of the range and a long lower shadow. The difference is their context: a Hammer forms at the bottom of a downtrend and signals a potential bullish reversal, whereas a Hanging Man forms at the top of an uptrend and signals potential bearish exhaustion.
Why do candlestick patterns fail?
Candlestick patterns frequently fail due to liquidity sweeps and stop-hunts engineered by institutional algorithms. If a pattern forms on low volume without genuine limit order support in the order book, aggressive sellers or buyers can easily overwhelm the level, leading to a false breakout.
How does Bookmap improve candlestick pattern trading?
Bookmap removes the ambiguity of static candlestick charts by visually displaying the full limit order book and live traded volume. It allows you to see whether a candlestick wick was caused by heavy institutional absorption or simply an absence of liquidity, enabling you to take trades with higher confidence.
Can I use candlestick patterns for crypto and forex?
Yes. Candlestick patterns apply across all liquid financial markets, including equities, forex, commodities, and cryptocurrencies. However, traders should adjust for market-specific traits—such as the continuous 24/7 nature of crypto and the absence of weekend gap opens in forex.
What is the most powerful reversal candlestick pattern?
Multi-candle patterns like the Bullish/Bearish Engulfing and the Morning/Evening Star are widely considered the most effective reversal patterns. They capture both the exhaustion of the prior momentum and the decisive initiation of new directional volume.
Upgrade your technical analysis with institutional-grade order-flow clarity. [Speak to an expert or get started with Bookmap today.]