
Ever stare at a traffic spike and still have no idea whether that post actually helped your business? Measuring Content Performance Effectively starts when you stop treating pageviews as the whole story and begin connecting reach, Engagement, Conversion Rates, and ROI.
Most dashboards give you plenty of numbers. They do not always give you answers.
In Content Marketing Institute’s 2026 research, measurement and reporting showed up as one of the factors that helped effective teams improve. So, grab the key Metrics that matter, and let’s turn them into a Content Strategy you can actually use.
What Is Content Performance?
Content performance is how well a piece of content helps you reach a real business goal, such as Brand Awareness, Lead Generation, subscriptions, pipeline growth, or sales. Good Performance Measurement does more than count visits. It shows whether the right people found the content, stayed with it, and took the next step.
I like to break it into four clear stages.
- Production: Did you publish the right topic, in the right format, at the right speed?
- Activation: Did readers notice the call to action, click, and move deeper into your funnel?
- Reach: Did the piece earn pageviews, impressions, and new visitors from search, email, or social?
- Conversion: Did it create leads, demo requests, downloads, or revenue?
Google defines an engaged session in GA4 as one that lasts longer than 10 seconds, triggers a key event, or includes at least two page or screen views. That is why pageviews alone can fool you. A quick bounce and a meaningful visit should never carry the same weight.
One practical way to measure all four stages is a simple weekly editorial loop. On Monday, plan the week and assign UTM tags to the pieces you expect to publish. On Tuesday, publish and tag CTA events so clicks, signups, and downloads land in Analytics. Midweek, give the strongest piece extra distribution. On Friday, review pageviews, engaged sessions, key events, conversion rates, and CRM leads, then choose one optimization move for next week.
The goal is not to collect more data. The goal is to make each piece earn attention first, then action.
If you want a cleaner view of trends, use benchmarking instead of gut feel. GA4 can compare eligible properties with peer groups, which helps you see whether a dip is your problem or a wider market pattern.
Why Measuring Content Performance Matters
If you do not measure content, you keep funding topics, formats, and channels that feel busy but do not move the business. Clear Analytics helps you see what to keep, what to fix, and what to stop.
Improves Content Strategy
Strong measurement makes editorial planning much sharper. Instead of asking, “What should we publish next?” you can ask, “What format keeps attention, what topic earns qualified traffic, and what CTA gets the next click?”
That change matters because Content Strategy gets better when you sort content by intent. A top-of-funnel article may deserve more updates and wider distribution. A bottom-of-funnel page may need tighter copy, stronger proof, or a clearer offer.
Maximizes ROI
HubSpot’s 2026 State of Marketing puts lead quality and MQLs at the top of the metrics marketers care about, ahead of lead volume alone. That is a useful gut check. A post that brings 1,000 visits and two poor-fit leads is weaker than a page that brings 150 visits and 12 sales-ready leads.
To make ROI easy to defend, track four numbers in one line: cost to create and promote the piece, leads generated, lead-to-customer rate, and revenue influenced. Once you see that chain, Optimization becomes much easier because you know exactly where the leak sits.
Enhances Audience Understanding
Behavior data tells you what readers actually do, which is often more useful than what they say in a survey. Scroll depth, returning users, on-page search behavior, and CTA clicks show where interest rises, where friction starts, and where people need a stronger next step.
- If time on page is strong but CTA clicks are weak, your article is useful but the offer is not clear enough.
- If traffic is high but lead quality is poor, the topic may be attracting the wrong intent.
- If readers reach only 25% of the page, your opening is not carrying them forward.
- If returning visitors convert better than new visitors, build more retargeting and email follow-up around that content.
That is where real Audience Insights come from. You are not guessing what your readers want. You are watching their choices and adjusting from there.
Key Metrics for Measuring Content Performance
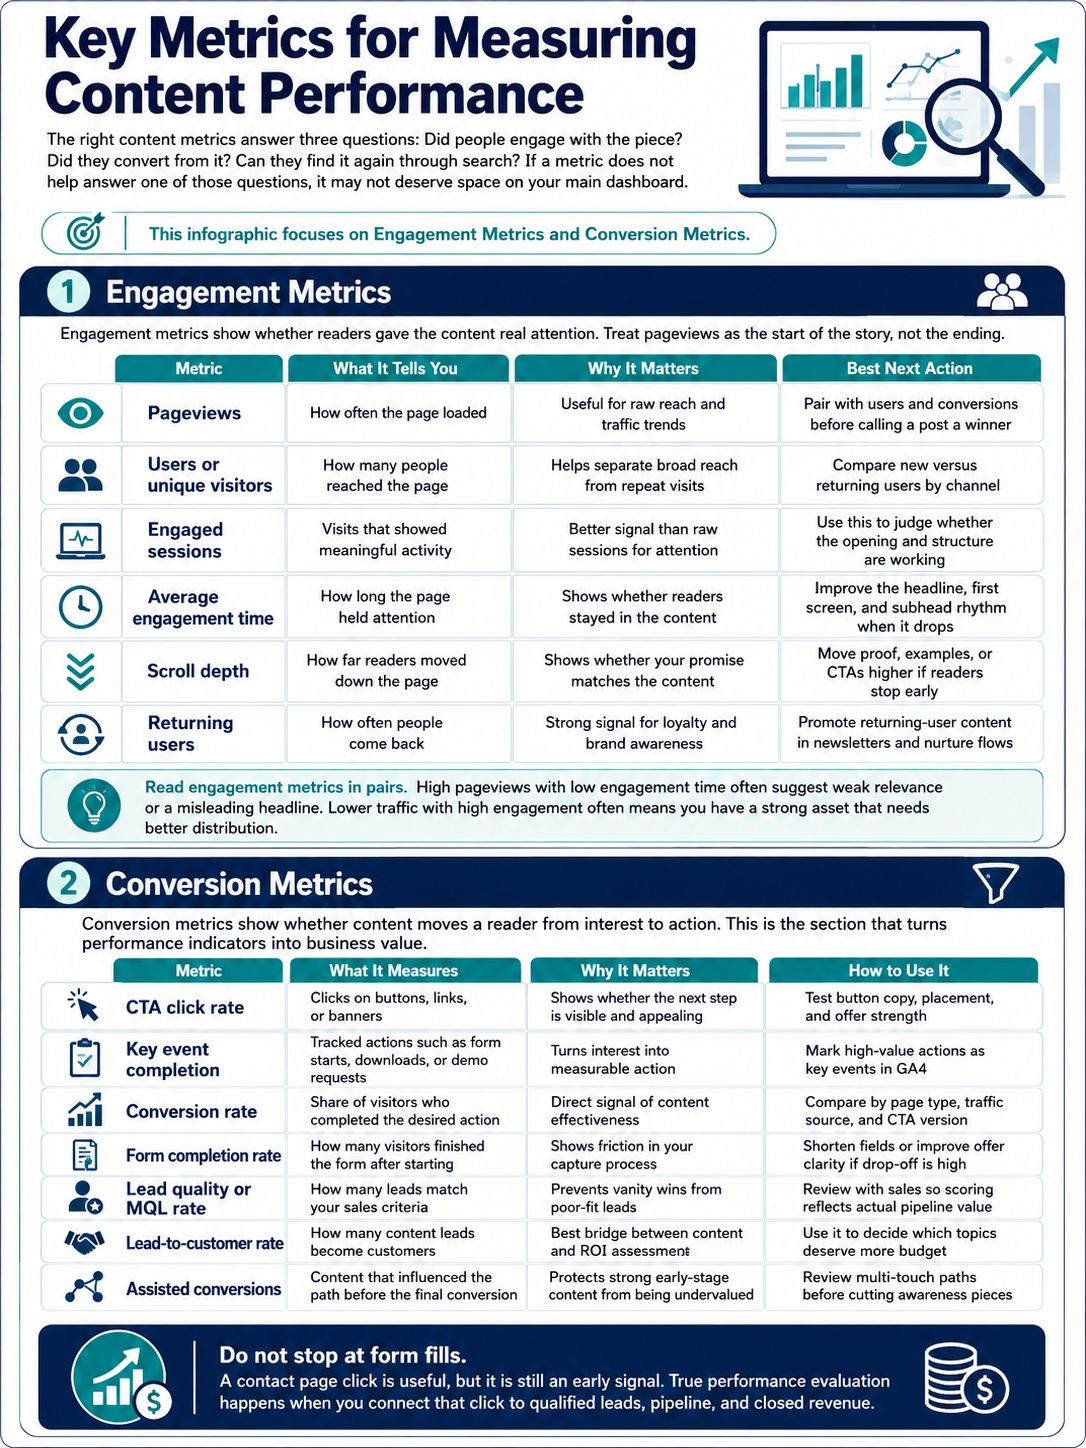
The right Content Metrics answer three simple questions. Did people engage with the piece, did they convert from it, and can they find it again through search? If a metric cannot help you answer one of those questions, it probably does not deserve space on your main dashboard.
Engagement Metrics
Engagement Metrics tell you whether readers gave the content real attention. Treat pageviews as the start of the story, not the ending.
| Metric | What It Tells You | Why It Matters | Best Next Action |
|---|---|---|---|
| Pageviews | How often the page loaded | Useful for raw reach and Traffic trends | Pair with users and conversions before calling a post a winner |
| Users or unique visitors | How many people reached the page | Helps separate broad reach from repeat visits | Compare new versus returning users by channel |
| Engaged sessions | Visits that showed meaningful activity | Better signal than raw sessions for attention | Use this to judge whether the opening and structure are working |
| Average engagement time | How long the page held attention | Shows whether readers stayed in the content | Improve the headline, first screen, and subhead rhythm when it drops |
| Scroll depth | How far readers moved down the page | Shows whether your promise matches the content | Move proof, examples, or CTAs higher if readers stop early |
| Returning users | How often people come back | Strong signal for loyalty and Brand Awareness | Promote returning-user content in newsletters and nurture flows |
A useful rule is to read these in pairs. Pageviews plus low engagement time usually points to weak relevance or a misleading headline. Lower traffic plus high engagement often means you have a strong asset that needs better distribution.
Conversion Metrics
Conversion Metrics show whether content moves a reader from interest to action. This is the section that turns Performance Indicators into business value.
| Metric | What It Measures | Why It Matters | How to Use It |
|---|---|---|---|
| CTA click rate | Clicks on buttons, links, or banners | Shows whether the next step is visible and appealing | Test button copy, placement, and offer strength |
| Key event completion | Tracked actions such as form starts, downloads, or demo requests | Turns interest into measurable action | Mark high-value actions as key events in GA4 |
| Conversion rate | Share of visitors who completed the desired action | Direct signal of content effectiveness | Compare by page type, traffic source, and CTA version |
| Form completion rate | How many visitors finished the form after starting | Shows friction in your capture process | Shorten fields or improve offer clarity if drop-off is high |
| Lead quality or MQL rate | How many leads match your sales criteria | Prevents vanity wins from poor-fit leads | Review with sales so scoring reflects actual pipeline value |
| Lead-to-customer rate | How many content leads become customers | Best bridge between content and ROI Assessment | Use it to decide which topics deserve more budget |
| Assisted conversions | Content that influenced the path before the final conversion | Protects strong early-stage content from being undervalued | Review multi-touch paths before cutting awareness pieces |
Do not stop at form fills. A contact page click is useful, but it is still an early signal. True Performance Evaluation happens when you connect that click to qualified leads, pipeline, and closed revenue.
SEO and Organic Reach Metrics
Organic search is where great content keeps paying you back. SEO Metrics tell you whether your pages are discoverable, attractive in search results, and aligned with search intent.
Search Console warns that property-level CTR and average position can look better than page-level numbers when more than one page from your site appears in search results, so export by page before you judge an individual article.
| Metric | What to Watch | Why It Matters | Smart Move |
|---|---|---|---|
| Impressions | How often the page appeared in search | Shows visibility before the click | If impressions rise but clicks do not, rewrite the title and description |
| Clicks | Visits earned from search | Shows whether searchers choose your result | Compare clicks against page intent and search queries |
| CTR | Clicks divided by impressions | Great for snippet testing | Improve titles, clarity, and search promise |
| Average position | Where your page tends to rank | Helps you find near-win pages | Prioritize pages sitting close to page-one visibility |
| Indexed pages | Whether Google can include the page in search | Content cannot perform if it is not indexed | Use URL Inspection after major updates |
| Organic conversion rate | Leads or sales from organic sessions | Links SEO to ROI | Favor keywords and topics that attract buying intent |
| Lead generation from organic traffic | How many leads came from search visits | Shows which search topics support the pipeline | Update and expand the pages that already convert |
One more practical tip: treat same-day Search Console swings carefully. The newest data can be preliminary, so it is smarter to judge trends over several days than to panic over a single dip.
- High impressions and low CTR usually point to a weak snippet.
- Strong CTR and weak conversions often point to the wrong search intent.
- Low impressions and strong conversions mean the page deserves fresh SEO work and stronger internal linking.
Tools for Tracking and Analyzing Content Performance
You do not need a giant stack to get useful answers. Most teams can build a strong Analytics setup by adding tools in layers, starting with traffic and behavior, then moving into lead tracking and deeper Data Analysis.
Microsoft describes Clarity as free forever, with unlimited heatmaps, websites, and team members. That makes it one of the easiest upgrades after GA4 if you want to see why users stall, rage click, or abandon a form.
| Tool | Best For | Most Helpful Detail | When to Use It |
|---|---|---|---|
| Google Analytics 4 | Core site measurement | Tracks engaged sessions, average engagement time, key events, and benchmarking | Start here for page performance, channel comparisons, and Conversion tracking |
| Google Search Console | Organic search performance | Shows impressions, clicks, CTR, average position, indexing status, and URL Inspection | Use it to judge discoverability and catch search visibility issues |
| Microsoft Clarity | Behavior analysis | Gives heatmaps, session recordings, frustration signals, and useful filters | Use it when numbers tell you something is wrong but not why |
| Looker Studio | Reporting and dashboards | Connects multiple sources so one report can show traffic, leads, and conversions together | Use it to build a simple weekly scorecard for your team |
| CRM or marketing automation platform | Lead quality and revenue tie-in | Connects content touches to MQLs, sales conversations, and closed deals | Use it once you need ROI and Lead Generation reporting, not just page stats |
| BigQuery | Advanced analysis | GA4 can export raw event data there for deeper modeling and custom attribution | Use it when standard reports stop answering your questions |
| Google Sheets or Excel | Editorial tracking | Still great for publish dates, owners, target keywords, update history, and weekly notes | Use it to keep the operating layer simple |
If you are building a lean stack, a very practical order is this.
- Set up GA4 for page, event, and conversion tracking.
- Add Search Console so you can see impressions, CTR, and indexing health.
- Install Clarity to understand friction on important pages.
- Connect your CRM so lead quality and revenue appear beside traffic.
- Build one dashboard in Looker Studio, then review it every week.
A common mistake is buying more software before your naming, tagging, and event setup is clean. In my experience, clear UTM rules, consistent CTA names, and reliable key event tracking do more for Optimization than another dashboard ever will.
Final Thoughts: Measuring Content Performance Effectively
Measuring Content Performance Effectively works best when you keep the system simple. Set one main goal for each piece, track reach, Engagement, and Conversion together, and review the numbers on a steady weekly rhythm.
Watch pageviews, engaged sessions, CTR, Conversion Rates, and lead quality side by side. Then update the near-winners, scale the pages that produce real ROI, and stop spending time on content that never earns attention or action.
Do that consistently, and your Metrics stop feeling like dashboard clutter. They become a clear path to better Content Strategy, stronger Performance Measurement, and more reliable Lead Generation.
FAQs about Measuring Content Performance Effectively
1. What key metrics show content performance?
Look at engagement, time on page, search traffic from SEO, and conversion rate, plus site exits for quick problems.
2. How often should I check content analytics?
Check weekly for trends, check monthly for strategy shifts, and check right after A/B testing or a big campaign.
3. How do I test what really works, A/B testing or user research?
Run A/B tests on headlines or calls to action, then watch the metrics. Talk to real users, with short surveys or quick chats, for the why. Together they cut guesswork, and help you move the needle.
4. How do I link content metrics to business goals?
Pick a clear goal, like more sales or more signups, then track the content metrics that match, such as conversion rate or lead volume. Use analytics to report ROI, tweak content, and repeat.