
Fintechzoom.com Russell 2000 is a free financial data hub that tracks the 2,000 smallest publicly traded U.S. companies in real time, offering charts, sector breakdowns, news, and analysis tools aimed at retail investors. It’s a solid supplementary resource for casual tracking and quick reads on small-cap sentiment, but serious traders should cross-check its numbers against primary sources like FTSE Russell, Bloomberg, or their broker’s official feed.
The Russell 2000 finally broke its four-year drought in September 2025, climbing past 2,453 for its first record close since November 2021. If you’re tracking that comeback through Fintechzoom, you’re using one of the few free dashboards that bundles real-time Russell 2000 charts, news, and analysis without asking you to log in.
Here’s what that combination actually gets you. The Russell 2000 covers roughly 2,000 small-cap U.S. stocks, making it the default benchmark for how smaller American companies are doing. Small caps tend to run hot during economic recoveries and cool off hard when conditions tighten, so the index swings more than the S&P 500 or Nasdaq 100. That volatility is exactly why a quick-glance tool like FintechZoom is useful and exactly why it shouldn’t be your only source.
This guide walks through how to read the index on Fintechzoom, what the numbers mean, and how beginners can get exposure through ETFs like IWM and VTWO without overcommitting.
What Is the Russell 2000 Index?
The Russell 2000 is a stock market index that measures the performance of about 2,000 small-capitalization U.S. companies. It’s a subset of the broader Russell 3000, representing roughly the bottom two-thirds by market value. FTSE Russell manages the index and reconstitutes it every June to keep the list fresh.
Think of it as the small-business barometer of the American stock market. When the Russell 2000 rallies, it usually signals investors feel good about domestic economic growth, since small caps are heavily tied to U.S. demand rather than global exports.
Key facts:
- Launched in 1984 by the Frank Russell Company
- Constituents range roughly from $300 million to $5 billion in market cap
- Financials, industrials, and healthcare typically dominate the sector mix
- Rebalanced annually on the last Friday of June
A quick decision rule: if you want exposure to the “next generation” of American companies, the ones still growing into their potential, the Russell 2000 is where they live.
How Do I Check Russell 2000 Price on FintechZoom?
To check the Russell 2000 price on Fintechzoom, visit fintechzoom.com, use the site search bar for “Russell 2000,” and open the dedicated index page. The current level, daily change, and interactive chart load at the top of the page.
Step-by-step:
- Go to fintechzoom.com in any browser (no account needed for basic data).
- Type “Russell 2000” into the search field at the top.
- Click the index result, usually labeled RUT or ^RUT.
- Review the live price ticker, percentage change, and intraday chart.
- Scroll down for sector breakdown, top gainers/losers, and recent news.
- Use the timeframe selector (1D, 1W, 1M, 1Y, 5Y) to zoom in or out.
For deeper analysis, the platform also lets you overlay technical indicators like moving averages and RSI directly on the chart.
Russell 2000 vs S&P 500: What’s the Difference?
The Russell 2000 tracks 2,000 small-cap U.S. companies, while the S&P 500 tracks 500 large-cap U.S. companies. Small caps are more volatile and more sensitive to the domestic economy; large caps are steadier and more globally diversified.
| Feature | Russell 2000 | S&P 500 |
|---|---|---|
| Number of stocks | ~2,000 | 500 |
| Market cap focus | Small ($300M, $5B) | Large ($15B+) |
| Volatility | Higher | Lower |
| Global revenue exposure | ~20% | ~40% |
| Best environment | Rate cuts, recovery | Steady growth |
| Popular ETF | IWM, VTWO | SPY, VOO |
Choose the Russell 2000 if you want higher growth potential and can stomach bigger swings. Choose the S&P 500 if you prefer stability and dividend-paying blue chips.
A common mistake: assuming both indices move in lockstep. During 2022’s rate hikes, the Russell 2000 fell harder than the S&P 500. In 2020’s recovery, it bounced back faster.
Is Fintechzoom Reliable for Russell 2000 Data?
Fintechzoom is reasonably reliable for casual tracking, news summaries, and quick chart checks, but it’s a secondary aggregator, not a primary data source. For trading decisions involving real money, verify prices against FTSE Russell’s official feed, your broker, or established platforms like Bloomberg or Refinitiv.
Where Fintechzoom works well:
- Fast, ad-supported access without a paywall
- Aggregated news headlines from multiple outlets
- Beginner-friendly charts and sector snapshots
- Educational commentary on market moves
Where to be cautious:
- Data may lag by seconds or minutes on certain pages
- Some articles are lightly sourced or written for SEO rather than depth
- No SEC registration as a broker-dealer or investment advisor
- Best used as a dashboard, not for executing trades
For anyone building a broader financial toolkit, it’s worth pairing Fintechzoom with your brokerage app and independent research. If you’re just starting out, guides on comparing UK stockbrokers for beginners offer useful context on choosing a reliable execution partner.
Russell 2000 ETF: How to Invest
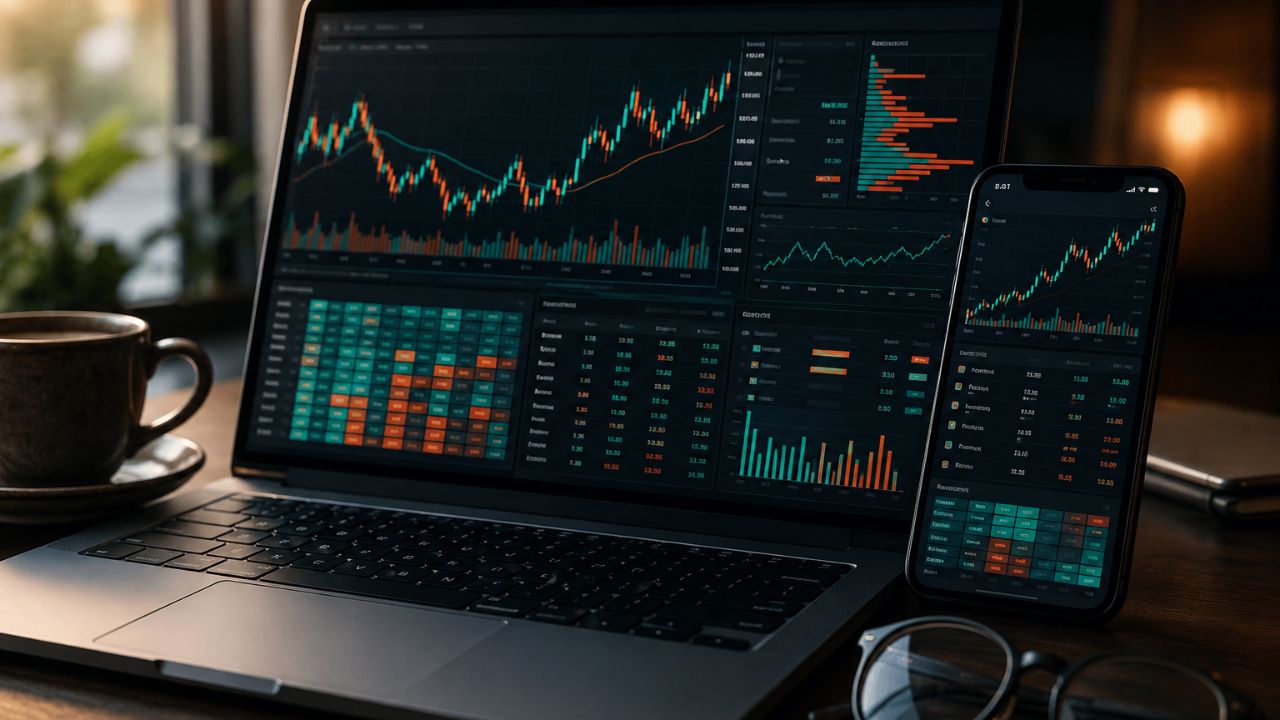
The easiest way to invest in the Russell 2000 is through an ETF that tracks the index. The two most popular are iShares Russell 2000 ETF (IWM) and Vanguard Russell 2000 ETF (VTWO). Both give you instant exposure to all ~2,000 companies with a single trade.
Step-by-step to invest:
- Open a brokerage account (Fidelity, Schwab, Robinhood, Vanguard, etc.).
- Fund the account via bank transfer.
- Search for the ticker, IWM or VTWO.
- Choose a market or limit order.
- Enter the number of shares and confirm.
- Set up automatic monthly contributions if you’re dollar-cost averaging.
Quick comparison:
- IWM, highest liquidity, expense ratio around 0.19%, great for active traders.
- VTWO, a lower expense ratio around 0.10%, is cheaper for long-term holders.
Rule of thumb: for buy-and-hold, VTWO’s cost advantage compounds. For frequent trading, IWM’s tighter spreads matter more.
Why Is Russell 2000 Down Today?
The Russell 2000 typically drops on days when interest rate expectations rise, banking sector stress spreads, or economic data disappoints. Small caps carry more debt relative to earnings than large caps, so rising rates hit them harder.
Common reasons for a down day:
- Hotter-than-expected inflation report
- Federal Reserve signals delayed rate cuts
- Regional bank concerns (financials are ~15% of the index)
- Weak retail sales or manufacturing data
- Broad risk-off sentiment tied to geopolitics
Fintechzoom’s daily market recap usually lists the specific catalyst near the top of the article. Cross-check with Bloomberg or CNBC for confirmation.
Edge case: sometimes the Russell 2000 falls while the S&P 500 rises. That divergence often signals investors are rotating into defensive mega-cap tech rather than betting on broader economic growth.
Fintechzoom Russell 2000 Chart: How to Read It
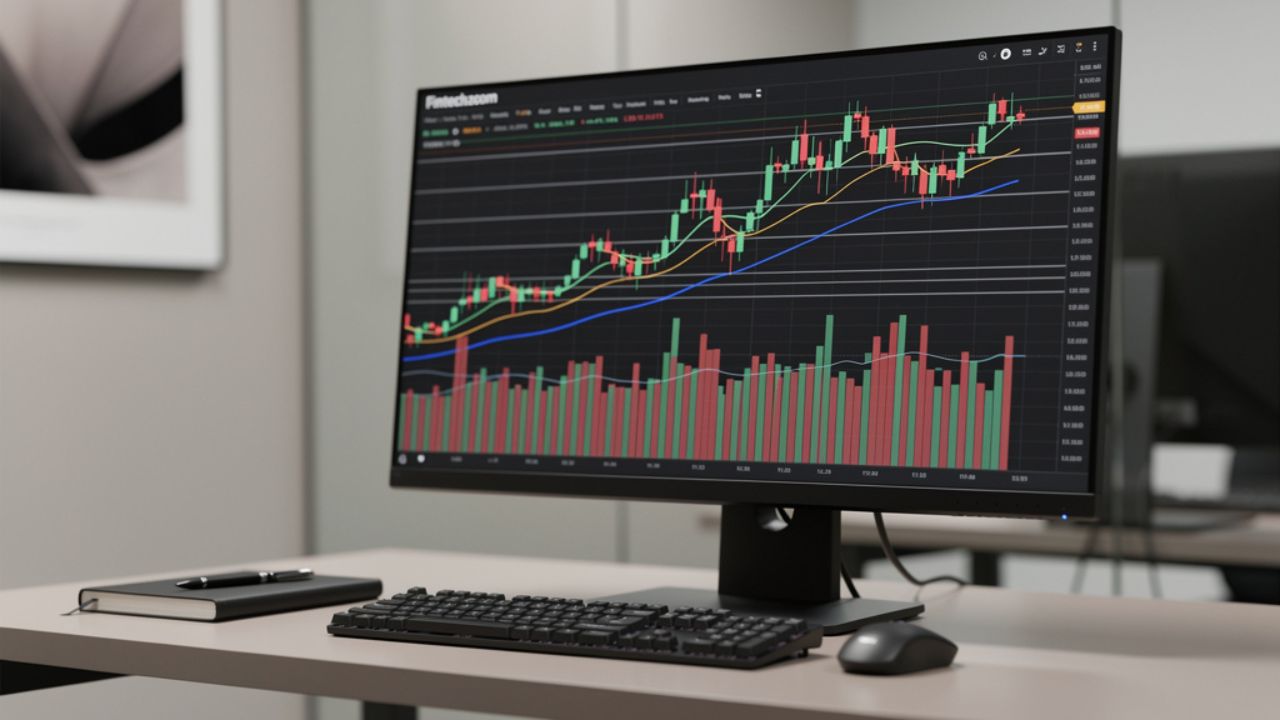
Reading a Russell 2000 chart on Fintechzoom comes down to four elements: price line, timeframe, volume bars, and technical overlays. Start with the big picture, then zoom in.
What to look at, in order:
- Timeframe: switch between 1D, 1M, 1Y, and 5Y to see short-term noise vs. long-term trends.
- Price line or candlesticks: green = up day, red = down day.
- Volume bars: high volume on a breakout confirms conviction.
- Moving averages: the 50-day and 200-day are the standard bull/bear signals.
- Support and resistance: horizontal lines where price repeatedly bounces or stalls.
Quick example: if the Russell 2000 breaks above its 200-day moving average on heavy volume after weeks of consolidation, that’s a classic bullish signal for small caps.
Don’t obsess over one indicator. Traders who stack three or four confirmations tend to make better decisions than those chasing a single line.
Russell 2000 Performance This Year
As of mid-2026, the Russell 2000 has continued its recovery narrative that took hold in late 2025. The index broke to a fresh all-time high above 2,453 in September 2025, its first record since November 2021, driven by Federal Reserve rate cuts, improving small-cap earnings, and attractive valuations relative to large caps.
Key drivers this cycle:
- Rate cuts easing debt-service costs for smaller companies
- Forward P/E around 16x, less stretched than mid- and large-cap peers
- Rotation out of concentrated mega-cap tech into broader market exposure
- Resilient U.S. consumer spending supporting domestic-focused firms
Bank of America Securities projected in August 2025 that small caps would keep outperforming, citing valuation gaps and improving earnings momentum. Whether that thesis holds in the second half of 2026 depends heavily on the Fed’s next moves.
Should I Invest in Russell 2000 Stocks?
Small-cap exposure makes sense for most long-term investors, but sizing matters. A common allocation is 10-20% of your equity portfolio in small caps, with the rest in large caps and international.
You should consider it if:
- Your investment horizon is 5+ years
- You can tolerate 20-30% drawdowns without panic selling
- You already own broad-market or S&P 500 funds
- You want higher long-term expected returns
Skip or reduce exposure if:
- You need the money within 2-3 years
- You’re already retired and drawing income
- You panic during volatility
Historical data shows small caps have delivered higher returns than large caps over multi-decade periods, but with significantly more volatility along the way. The classic Fama-French research documented this “small-cap premium,” though it’s been inconsistent decade to decade.
Russell 2000 vs Nasdaq: Which Is Better?
Neither is universally “better”; they serve different roles. The Russell 2000 gives you diversified small-cap exposure across every sector. The Nasdaq 100 gives you concentrated exposure to large-cap technology and growth companies.
Head-to-head:
- Composition: Russell 2000 = 2,000 small caps across all sectors. Nasdaq 100 = 100 large caps, heavily tech.
- Volatility: Both are volatile, but for different reasons. Small caps swing on economic data. Nasdaq swings on tech earnings and rate expectations.
- Concentration risk: Nasdaq’s top 5 stocks make up ~40% of the index. The Russell 2000 has no single stock above 1%.
- Best for: Nasdaq = tech bull, Russell 2000 = broader economic recovery bull.
Many investors own both. That’s not a bad approach if you want growth exposure without over-concentrating in a handful of mega-cap names.
Fintechzoom Russell 2000 Analysis Tools
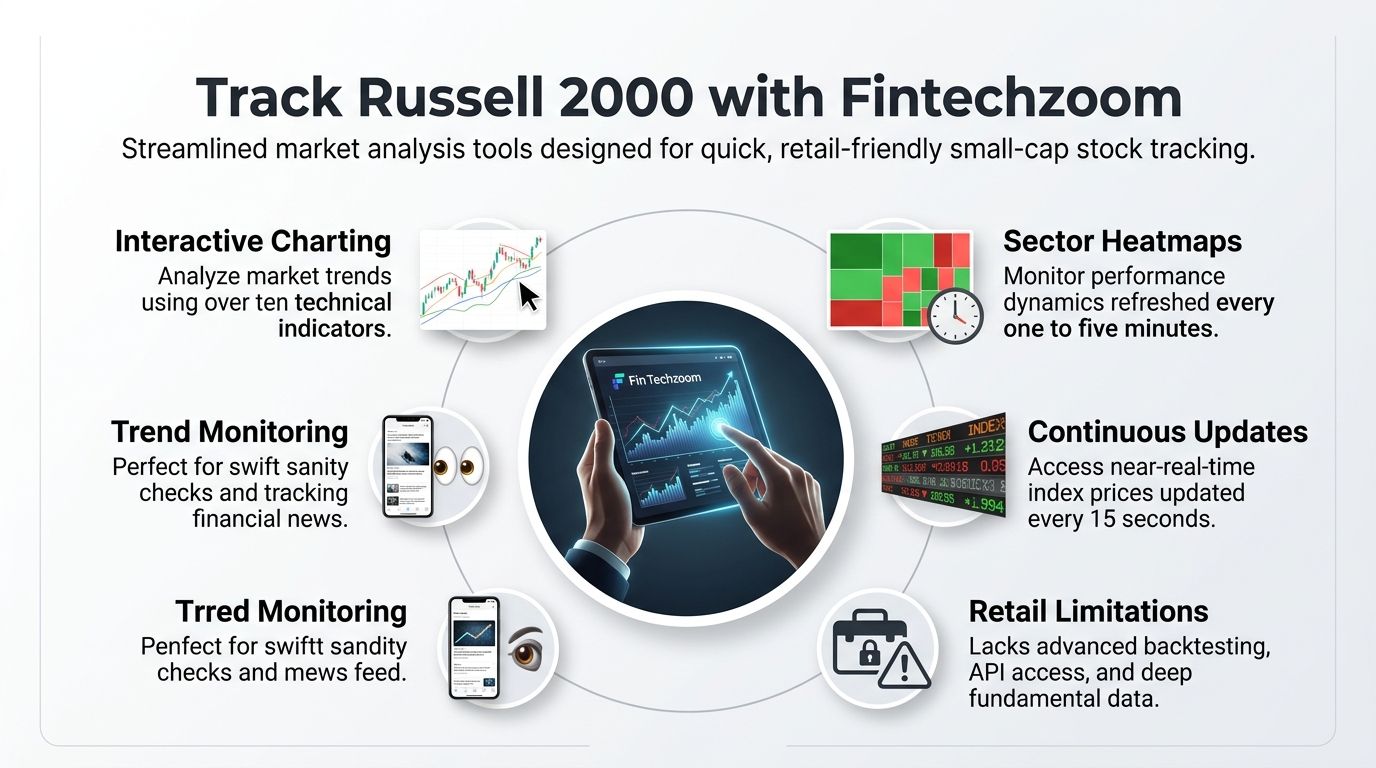
Fintechzoom’s analysis suite for the Russell 2000 covers charting, screening, news aggregation, and basic sector heatmaps. The tools are aimed at retail users who want more than a plain quote but less complexity than a Bloomberg terminal.
What you’ll find:
- Interactive charts with 10+ technical indicators
- Top gainers/losers within the index
- Sector-level performance heat maps
- Aggregated news feed from major financial outlets
- Basic screener filters (market cap, P/E, sector)
- Educational articles on small-cap strategy
What it lacks compared to premium platforms:
- No advanced backtesting
- Limited fundamental data depth
- No API access for custom builds
- No proprietary research or analyst ratings
If you need deeper fundamental analysis, pair Fintechzoom’s dashboard with your broker’s research or a paid service. For readers interested in how financial tech tools evolve, the piece on the best neobanks in New Zealand shows how similar fintech platforms are innovating in adjacent markets.
How Often Does the Russell 2000 Update on FintechZoom?
Fintechzoom updates Russell 2000 index data continuously during U.S. market hours (9:30 AM to 4:00 PM ET), with most price refreshes happening every 15-60 seconds on standard pages. The chart page typically shows the fastest updates; static article pages may lag by minutes.
Update frequencies to know:
- Live index price: near-real-time (with occasional 15-second delays)
- Sector heat maps: refresh every 1-5 minutes
- News feed: rolling, updated as articles publish
- End-of-day close data: posted within 30 minutes after 4 PM ET
For split-second execution decisions, use your broker’s platform. For monitoring trends, checking headlines, and running quick sanity checks, Fintechzoom’s cadence is more than adequate.
Russell 2000 Small-Cap Stocks: What Does It Mean?
“Small-cap” refers to publicly traded companies with a market capitalization typically between $300 million and $2 billion (some definitions stretch to $5 billion). Market cap = share price × total outstanding shares. The Russell 2000 is the standard benchmark for this segment in the United States.
Why small caps matter:
- They represent growing companies that could become the next Apple or Amazon
- They’re heavily tied to the domestic U.S. economy (roughly 80% of revenue is domestic)
- They tend to outperform large caps during economic recoveries
- They’re more sensitive to interest rates and credit conditions
Recent additions worth knowing:
- Energy Vault Holdings (NRGV) joined in June 2026
- Siebert Financial (SIEB) joined in July 2025 alongside a $50M ATM offering to fund AI and digital-asset initiatives.
Every June, hundreds of companies rotate in and out during the annual reconstitution. That churn is one reason the index reflects the current state of American entrepreneurship rather than yesterday’s winners.
Fintechzoom Russell 2000 Alternatives: Other Sites Worth Using
Fintechzoom isn’t your only option for tracking the Russell 2000. Depending on your needs, depth, speed, mobile experience, or professional-grade data, several alternatives cover the same ground with different strengths.
Top alternatives:
- Yahoo Finance, free, deep historical data, strong mobile app
- Google Finance, clean interface, integrates with Google account
- TradingView, best-in-class charts, huge community of chartists
- Bloomberg.com, professional-grade news and analysis (some paywalls)
- MarketWatch, strong editorial coverage and market commentary
- Investing.com, deep technical tools, economic calendar
- Seeking Alpha, analyst opinion and community research
Which to pick:
- Casual tracking → Yahoo Finance or Fintechzoom
- Technical analysis → TradingView
- Professional research → Bloomberg or Refinitiv
- Long-form analysis → Seeking Alpha
Most experienced investors juggle two or three of these. Pair a fast quote source (broker app) with a chart-heavy platform (TradingView) and a news aggregator (Fintechzoom, Yahoo, or MarketWatch).
Final Words
Fintechzoom.com Russell 2000 offers a solid free entry point for tracking small-cap U.S. stocks, real-time charts, sector snapshots, and news aggregation without a paywall. It’s a useful dashboard for casual monitoring and staying current on market sentiment, but not a replacement for primary data feeds or your brokerage platform when real money is on the line.
Frequently Asked Questions (FAQs) on Fintechzoom.com Russell 2000
1. Is Fintechzoom free to use?
Yes, Fintechzoom is free and ad-supported. No account is required for basic Russell 2000 data, charts, or news.
2. Can I trade Russell 2000 stocks directly on Fintechzoom?
No. Fintechzoom is an information site, not a broker. You’ll need a brokerage account to execute trades.
3. What ticker symbol represents the Russell 2000?
The index itself is often listed as ^RUT or RUT. The most popular ETF is IWM, followed by VTWO.
4. How many companies are in the Russell 2000?
Approximately 2,000, though the exact number fluctuates slightly around reconstitution each June.
5. Does the Russell 2000 pay dividends?
The index itself doesn’t, but many of its constituent stocks do. Russell 2000 ETFs like IWM pass those dividends through to shareholders quarterly.
6. Is the Russell 2000 riskier than the S&P 500?
Yes. Small caps historically show higher volatility and larger drawdowns during downturns, though they also tend to rebound faster.
7. When does the Russell 2000 get rebalanced?
Every year on the last Friday of June, in what’s called the “annual reconstitution.”
8. What was the Russell 2000’s all-time high?
It broke above 2,453 in September 2025, its first record since November 2021.
9. Can I set price alerts for the Russell 2000 on Fintechzoom?
Basic alerts may require creating an account. For robust custom alerts, your brokerage app or TradingView offers more control.
10. Are small-cap stocks good for beginners?
They can be, but only as part of a diversified portfolio. Beginners should typically start with broad-market or S&P 500 index funds before adding small-cap exposure.