Car insurance premiums vary significantly across the United States, influenced by a range of factors such as state laws, traffic density, and weather conditions. If you are wondering which US states with the most expensive car insurance lead the list, this article will provide a thorough breakdown.
By understanding the driving forces behind these high premiums, you can better navigate your own insurance options and even find ways to save.
Whether you live in an urban area prone to accidents or a state with extreme weather, the insights here will help you make informed decisions about your car insurance coverage.
What Determines Car Insurance Premiums Across the US?
Car insurance premiums are influenced by a complex mix of factors. Understanding these variables can help clarify why some states are notorious for their high rates while others remain affordable.
Key Factors That Affect Costs in US States With Most Expensive Car Insurance
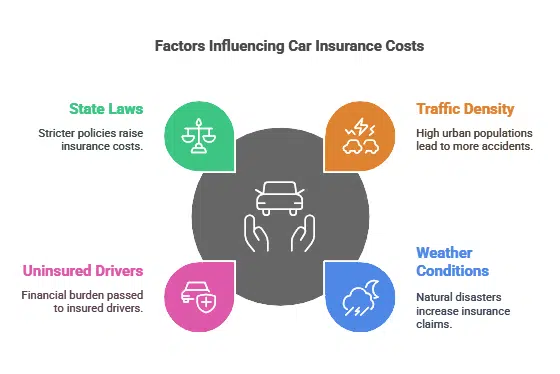
- Traffic Density: States with large urban populations often experience higher accident rates, leading to increased claims and, consequently, higher premiums.
- Weather Conditions: Frequent natural disasters such as hurricanes, hailstorms, and floods can drive up insurance claims, resulting in higher premiums.
- Uninsured Drivers: States with a high percentage of uninsured drivers pass the financial burden to insured drivers, raising their rates.
- State Laws: Some states have stricter insurance requirements, including mandatory no-fault policies, which tend to increase costs.
Why Some States Have Higher Car Insurance Premiums Than Others?
US states with most expensive car insurance often share traits like dense urban centers, extreme weather patterns, and higher uninsured driver rates. These factors significantly impact costs.
Ranking the Top US States With Most Expensive Car Insurance Premiums
To determine the rankings, we analyzed data from insurance industry reports, factoring in average annual premiums, accident rates, weather risks, and state regulations. Below is the list of the top 15 states with the most expensive car insurance premiums, ranked from highest to lowest.
| State | Average Annual Premium | Key Factors |
| Louisiana | $2,883 | High rates of uninsured drivers, frequent severe weather events, and increased repair costs. |
| Florida | $2,694 | Exposure to hurricanes, high accident rates, and a significant number of uninsured motorists. |
| California | $2,416 | High population density, expensive vehicle repairs, and increased risk of natural disasters. |
| Colorado | $2,337 | Rising accident rates, costly repairs, and severe weather conditions. |
| South Dakota | $2,280 | Increased accident frequency and higher repair costs. |
| Michigan | $2,266 | No-fault insurance system leading to higher claims costs. |
| Kentucky | $2,228 | High accident rates and medical costs. |
| Montana | $2,193 | High accident rates and costly medical claims. |
| Washington, D.C. | $2,157 | Dense traffic and higher likelihood of accidents. |
| Oklahoma | $2,138 | High rates of uninsured drivers and severe weather events. |
| Nevada | $2,060 | High vehicle theft rates and urban congestion. |
| Delaware | $2,063 | Dense population and higher accident rates. |
| New York | $1,870 | Dense urban traffic and higher likelihood of accidents. |
| Texas | $2,043 | High accident rates and severe weather conditions. |
| Georgia | $1,970 | High accident rates and medical costs. |
Detailed Analysis of the Top States
Before diving into the specific state breakdowns, it’s important to understand that the US states with most expensive car insurance often share overlapping challenges.
These include harsh weather conditions, higher traffic congestion, and insurance laws that amplify costs for drivers. Additionally, urbanization and repair costs play significant roles in pushing premiums higher across these states.
1. Louisiana
Drivers in Louisiana lead the rankings of US states with most expensive car insurance, paying an average of $2,883 annually. Key contributors include a high percentage of uninsured drivers and frequent severe weather events, such as hurricanes and flooding. The state’s legal environment also exacerbates costs due to higher litigation rates, increasing financial burdens on insurers and drivers alike.
| Factor | Impact on Premiums |
| Uninsured drivers | High risk for insurers |
| Severe weather events | Increased claims |
| Legal environment | Higher litigation costs |
2. Florida
Florida ranks as one of the top US states with most expensive car insurance, averaging $2,694 annually. The state’s susceptibility to hurricanes leads to frequent and costly claims, while nearly 20% of drivers remain uninsured, burdening insured motorists. No-fault insurance laws, requiring insurers to cover medical expenses regardless of fault, further drive up costs.
| Factor | Impact on Premiums |
| Hurricane risks | High claim frequency |
| Uninsured drivers | Higher financial risks |
| No-fault laws | Increased payouts |
3. California
California rounds out the top three with an average premium of $2,416. Several elements contribute:
- Population Density: Major cities like Los Angeles and San Francisco experience high congestion, leading to frequent accidents.
- Natural Disasters: Wildfires, earthquakes, and flooding result in significant vehicle damage claims.
- Expensive Repairs: Advanced vehicle technology, common in California, increases repair costs.
| Factor | Impact on Premiums |
| Traffic congestion | Frequent accidents |
| Natural disasters | High damage claims |
| Vehicle technology | Costlier repairs |
4. Colorado
Drivers in Colorado face an average annual premium of $2,337. Here’s why:
- Hailstorms: Colorado’s frequent hailstorms result in substantial vehicle damage claims.
- Urban Congestion: Cities like Denver see higher accident rates due to traffic.
- Advanced Repairs: Newer vehicle technology increases repair costs.
| Factor | Impact on Premiums |
| Hailstorms | Increased claims |
| Traffic congestion | Higher accident rates |
| Modern vehicles | Costlier repairs |
5. South Dakota
South Dakota’s annual premiums average $2,280. The main factors are:
- Rural Accidents: Long commutes on rural roads often lead to severe accidents.
- Weather Extremes: Snow and ice contribute to frequent wintertime claims.
- Medical Costs: Rising healthcare expenses increase claims.
| Factor | Impact on Premiums |
| Rural accidents | Severe collisions |
| Winter weather | Higher claims |
| Medical costs | Increased payouts |
6. Michigan
Michigan’s average annual premium is $2,266, ranking it sixth on the list. Contributing factors include:
- No-Fault Insurance: Michigan’s no-fault insurance law provides unlimited medical benefits for accident victims, significantly raising costs for insurers.
- Fraudulent Claims: High rates of insurance fraud inflate premiums for all drivers.
- Severe Winters: Icy roads and frequent snowstorms increase accident rates and claims.
| Factor | Impact on Premiums |
| No-fault insurance | Higher medical payouts |
| Fraudulent claims | Inflated premiums |
| Severe winters | Increased accidents |
7. Kentucky
Kentucky drivers face an average premium of $2,228. Reasons for the high costs include:
- Accident Rates: Kentucky has a higher-than-average accident rate, leading to more claims.
- Medical Costs: Rising healthcare costs contribute to increased claim expenses.
- Uninsured Drivers: A significant portion of drivers in Kentucky lack insurance, raising premiums for those who do.
| Factor | Impact on Premiums |
| Accident rates | More claims |
| Medical costs | Higher payouts |
| Uninsured drivers | Increased risks |
8. Montana
Montana has an average premium of $2,193, driven by several factors:
- Rural Collisions: High rates of accidents involving wildlife, particularly deer, increase claims.
- Long Distances: Rural areas often have longer commutes, leading to more severe accidents.
- Winter Weather: Snow and ice conditions contribute to higher accident rates.
| Factor | Impact on Premiums |
| Wildlife collisions | More claims |
| Long commutes | Severe accidents |
| Winter weather | Increased risks |
9. Washington, D.C.
Drivers in Washington, D.C., pay an average of $2,157 annually. Major factors include:
- Urban Density: High traffic congestion leads to frequent accidents.
- Theft Rates: Vehicle theft is more common in urban areas, increasing claims.
- Cost of Repairs: Repair shops in the capital tend to charge higher rates.
| Factor | Impact on Premiums |
| Urban congestion | Frequent accidents |
| Theft rates | Increased claims |
| Repair costs | Higher payouts |
10. Oklahoma
Oklahoma’s average premium of $2,138 is influenced by:
- Severe Weather: Tornadoes and hailstorms frequently cause vehicle damage.
- Uninsured Drivers: A high percentage of uninsured motorists increases costs for insured drivers.
- Rural Accidents: Many accidents occur on rural roads, which are often more severe.
| Factor | Impact on Premiums |
| Severe weather | Increased claims |
| Uninsured drivers | Higher premiums |
| Rural accidents | More severe collisions |
11. Nevada
Nevada’s average annual premium is $2,060. Key contributors include:
- Vehicle Theft: Cities like Las Vegas experience high vehicle theft rates, increasing claims.
- Urban Congestion: Dense traffic in urban areas leads to frequent accidents.
- Extreme Heat: Prolonged exposure to high temperatures can contribute to mechanical failures and claims.
| Factor | Impact on Premiums |
| Vehicle theft | Higher claims |
| Urban congestion | Frequent accidents |
| Extreme heat | Increased risks |
12. Delaware
Delaware drivers pay an average of $2,063 annually. Factors influencing this include:
- Small Geography: With a dense population in a small state, accidents are more frequent.
- Higher Repair Costs: Urban areas often have costlier repair services.
- Accident Rates: Delaware experiences a higher-than-average rate of vehicle collisions.
| Factor | Impact on Premiums |
| Dense population | Frequent accidents |
| Repair costs | Higher payouts |
| Accident rates | Increased claims |
13. New York
New York’s average premium of $1,870 is driven by:
- Urban Traffic: Dense traffic in cities like New York City leads to frequent collisions.
- Cost of Living: High costs for repairs and medical care increase premiums.
- Litigation: Higher rates of lawsuits in the state inflate insurance costs.
| Factor | Impact on Premiums |
| Urban traffic | Frequent accidents |
| Cost of living | Higher claims |
| Litigation rates | Increased premiums |
14. Texas
Texas has an average premium of $2,043, driven by:
- Severe Weather: Hailstorms and flooding frequently cause damage.
- Urban Accidents: High accident rates in cities like Houston and Dallas.
- Medical Costs: Rising healthcare expenses push up claim costs.
| Factor | Impact on Premiums |
| Severe weather | Increased claims |
| Urban accidents | More frequent claims |
| Medical costs | Higher payouts |
15. Georgia
Georgia’s average premium is $1,970. Key reasons include:
- High Accident Rates: Congested highways and urban areas contribute to frequent collisions.
- Weather Risks: Severe storms and flooding increase claim frequency.
- Medical Costs: Rising costs of healthcare inflate claims.
| Factor | Impact on Premiums |
| Accident rates | More claims |
| Weather risks | Increased payouts |
| Medical costs | Higher premiums |
Why Are These States the Most Expensive for Car Insurance?

Common Patterns Among the Top States
The US states with the most expensive car insurance premiums share these traits:
- Urbanization: More traffic leads to more accidents, pushing premiums higher.
- Weather Risks: States prone to hurricanes, hailstorms, or snowstorms see frequent and costly claims.
- Litigation Trends: Some states have legal environments that encourage more lawsuits, driving up costs for insurers.
How to Save on Car Insurance in Expensive States?
Smart Tips for Reducing Premiums
- Bundle Policies: Combine home and auto insurance to receive discounts.
- Maintain a Clean Driving Record: Avoid accidents and traffic violations.
- Increase Deductibles: Opt for higher deductibles to lower premiums.
- Shop Around: Compare rates from different insurers to find the best deal.
- Install Anti-Theft Devices: Vehicles with security enhancements often qualify for discounts.
- Utilize Usage-Based Insurance Programs: Drivers with safe driving habits can save by opting into telematics programs.
- Seek Employer or Membership Discounts: Many companies or associations offer discounted premiums for employees or members.
Wrap Up
Understanding the factors behind US states with most expensive car insurance helps drivers make informed decisions about coverage.
By exploring available discounts, shopping around, and adopting safe driving habits, you can reduce your premiums while maintaining essential protection. If you live in one of these states, take proactive steps to save and ensure the best value for your money.