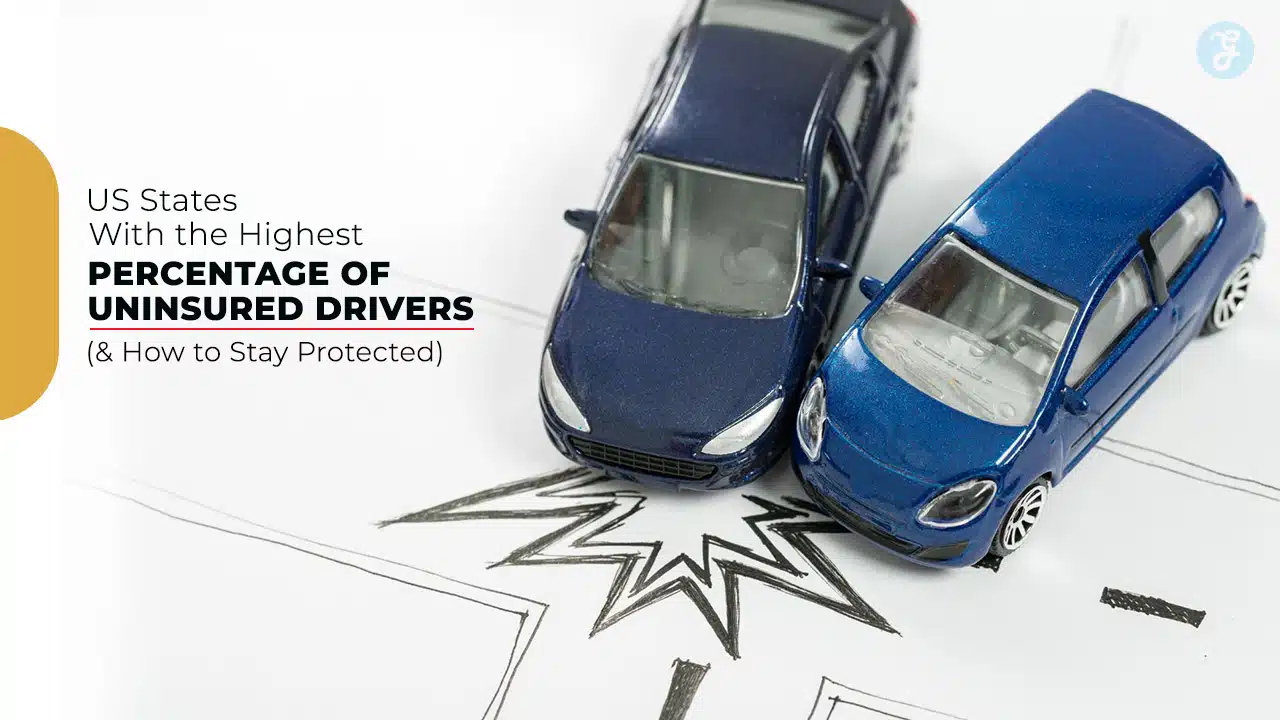
Uninsured drivers pose a significant financial and legal risk to insured motorists across the United States. Despite laws requiring auto insurance, millions of drivers continue to operate vehicles without coverage, increasing the likelihood of financial burdens in the event of an accident.
If you’re wondering which US states have the highest percentage of uninsured drivers and how to stay protected, this comprehensive guide will provide you with in-depth insights, statistics, and practical steps to safeguard yourself.
Recent data from the Insurance Research Council (IRC) indicates that in some states, more than one in four drivers is uninsured. The consequences? Higher insurance premiums, increased accident costs, and legal complications.
Understanding where these risks are highest and how to prepare can help you make informed decisions regarding your auto insurance policy.
What Does It Mean to Be an Uninsured Driver?
An uninsured driver is someone who operates a motor vehicle without carrying the legally required auto insurance. In some cases, drivers allow their policies to lapse due to financial hardship, while others deliberately avoid purchasing insurance due to high costs.
Why Are So Many Drivers Uninsured?
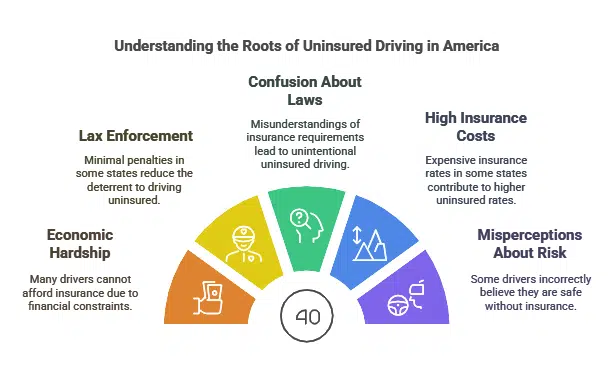
Several factors contribute to the high rate of uninsured drivers in certain states:
- Economic Hardship: Some drivers cannot afford high insurance premiums.
- Lax Enforcement: In some states, penalties for driving uninsured are minimal.
- Confusion About Laws: Some motorists misunderstand state insurance requirements.
- High Insurance Costs: States with expensive coverage rates often see more uninsured drivers.
- Misperceptions About Risk: Some drivers believe they are unlikely to be caught or involved in accidents, leading them to forego insurance.
Legal Consequences of Driving Without Insurance
Driving uninsured can lead to severe penalties, including:
- Fines and License Suspension
- Vehicle Impoundment
- Higher Future Insurance Costs
- Legal Liabilities in Accidents
| Consequence | Details |
| Fines | Can range from $100 to over $500, depending on state laws. |
| License Suspension | Many states impose suspension for repeated offenses. |
| Higher Premiums | Uninsured drivers pay significantly more when they try to obtain coverage later. |
| Legal Action | In case of an accident, uninsured drivers can be sued for damages. |
10 US States With the Highest Percentage of Uninsured Drivers
Below is the latest data ranking the top states with the highest percentage of uninsured drivers, according to the Insurance Research Council (IRC):
| Rank | State | Percentage of Uninsured Drivers |
| 1 | District of Columbia | 25.2% |
| 2 | New Mexico | 24.9% |
| 3 | Mississippi | 22.2% |
| 4 | Tennessee | 20.9% |
| 5 | Michigan | 19.6% |
| 6 | Kentucky | 18.7% |
| 7 | Georgia | 18.1% |
| 8 | Delaware | 18.1% |
| 9 | Colorado | 17.5% |
| 10 | Ohio | 17.1% |
1. District of Columbia (25.2%)
The District of Columbia has the highest percentage of uninsured drivers. High insurance premiums, combined with a transient population and expensive cost of living, make it difficult for many to afford auto insurance.
Additionally, enforcement of uninsured motorist laws is inconsistent.
| Factor | Impact |
| High Cost of Living | Residents prioritize other expenses over insurance. |
| Transient Population | Many drivers move frequently, avoiding coverage. |
| Weak Enforcement | Laws exist but are not strictly applied. |
2. New Mexico (24.9%)
New Mexico has a large number of uninsured drivers due to economic struggles and high rural populations where enforcement is limited.
Many people rely on older, unregistered vehicles, making it difficult to track insurance compliance.
| Factor | Impact |
| Rural Communities | Enforcement is weaker in less populated areas. |
| Poverty Rates | Many residents struggle with insurance affordability. |
| Lax Penalties | Limited consequences for uninsured drivers. |
3. Mississippi (22.2%)
Mississippi has consistently ranked among the highest states for uninsured drivers. Low-income levels and high insurance costs contribute to this problem. Furthermore, some residents take advantage of lenient registration and insurance laws.
| Factor | Impact |
| Low Incomes | Many cannot afford rising premium costs. |
| Limited Public Transport | Increases vehicle dependency and risk of uninsured driving. |
| Minimal Penalties | Fines and enforcement are not strict enough. |
4. Tennessee (20.9%)
Tennessee has experienced rapid population growth, leading to an increase in uninsured drivers. Many drivers struggle to keep up with high premiums, and penalties are often insufficient to deter driving without insurance.
| Factor | Impact |
| Population Growth | More uninsured drivers due to migration. |
| High Premiums | Coverage costs deter many from purchasing policies. |
| Weak Enforcement | Lack of consistent penalties for uninsured drivers. |
5. Michigan (19.6%)

Michigan’s high insurance costs, historically linked to its no-fault insurance system, have led to a large uninsured population. Recent reforms have aimed to lower costs, but affordability remains a challenge.
| Factor | Impact |
| No-Fault System | Historically led to extremely high premiums. |
| Recent Reforms | Changes have lowered rates but remain costly. |
| Economic Disparity | Many low-income drivers cannot afford coverage. |
6. Kentucky (18.7%)
Kentucky has a high number of uninsured drivers, partially due to economic difficulties that make insurance premiums unaffordable for many residents.
Additionally, weak enforcement policies contribute to the issue, as some drivers take the risk of driving uninsured rather than paying high premiums.
| Factor | Impact |
| Economic Hardship | High uninsured rates due to financial instability. |
| Insurance Costs | Higher-than-average rates contribute to non-compliance. |
| Enforcement | Weak penalties fail to deter uninsured driving. |
7. Georgia (18.1%)
Georgia’s urbanization has led to insurance rate disparities, with metro areas facing significantly higher premiums than rural regions. This has forced many low-income drivers to forgo coverage. Fraudulent claims also contribute to increased rates, making insurance less accessible.
| Factor | Impact |
| Urbanization | Higher insurance rates in metro areas. |
| Fraudulent Claims | Raises overall premium costs. |
| Strict Requirements | Some drivers cannot afford high minimum coverage. |
8. Delaware (18.1%)
Despite its small population, Delaware has a surprisingly high uninsured driver rate. Many residents find it cheaper to risk penalties than pay rising insurance premiums.
The state is actively working on enforcement strategies to address this growing concern.
| Factor | Impact |
| High Insurance Costs | Drivers choose to take the risk. |
| Penalties | Not always strictly enforced. |
| State Initiatives | Working on better enforcement policies. |
9. Colorado (17.5%)
Colorado has seen a rise in uninsured drivers due to increased living costs, forcing many to cut expenses, including car insurance.
In rural areas, enforcement is weaker, leading to higher rates of uninsured motorists.
| Factor | Impact |
| Cost of Living | High expenses push insurance to the bottom of priorities. |
| Rural Enforcement | Limited law enforcement in remote areas. |
| Premium Hikes | Rising costs make insurance unaffordable. |
1.0 Ohio (17.1%)
Ohio’s uninsured driver rate is influenced by economic disparities, with lower-income groups struggling to maintain coverage.
While penalties exist, they are not always enforced effectively, leading to persistent high rates of uninsured drivers.
| Factor | Impact |
| Economic Disparities | Lower-income individuals struggle with premiums. |
| Enforcement Gaps | Inconsistent penalties allow non-compliance. |
| Legislative Measures | Proposed policies to reduce uninsured rates. |
Takeaways
Uninsured drivers remain a serious issue in many US states, leading to increased costs and risks for insured motorists.
If you live in or travel through states with high uninsured rates, taking proactive steps—such as carrying uninsured motorist coverage and practicing defensive driving—can protect you from financial and legal troubles.
As uninsured driver rates continue to fluctuate, staying informed and ensuring you have proper coverage will provide peace of mind on the road.
Taking preventive measures now can save you from significant challenges in the future.