
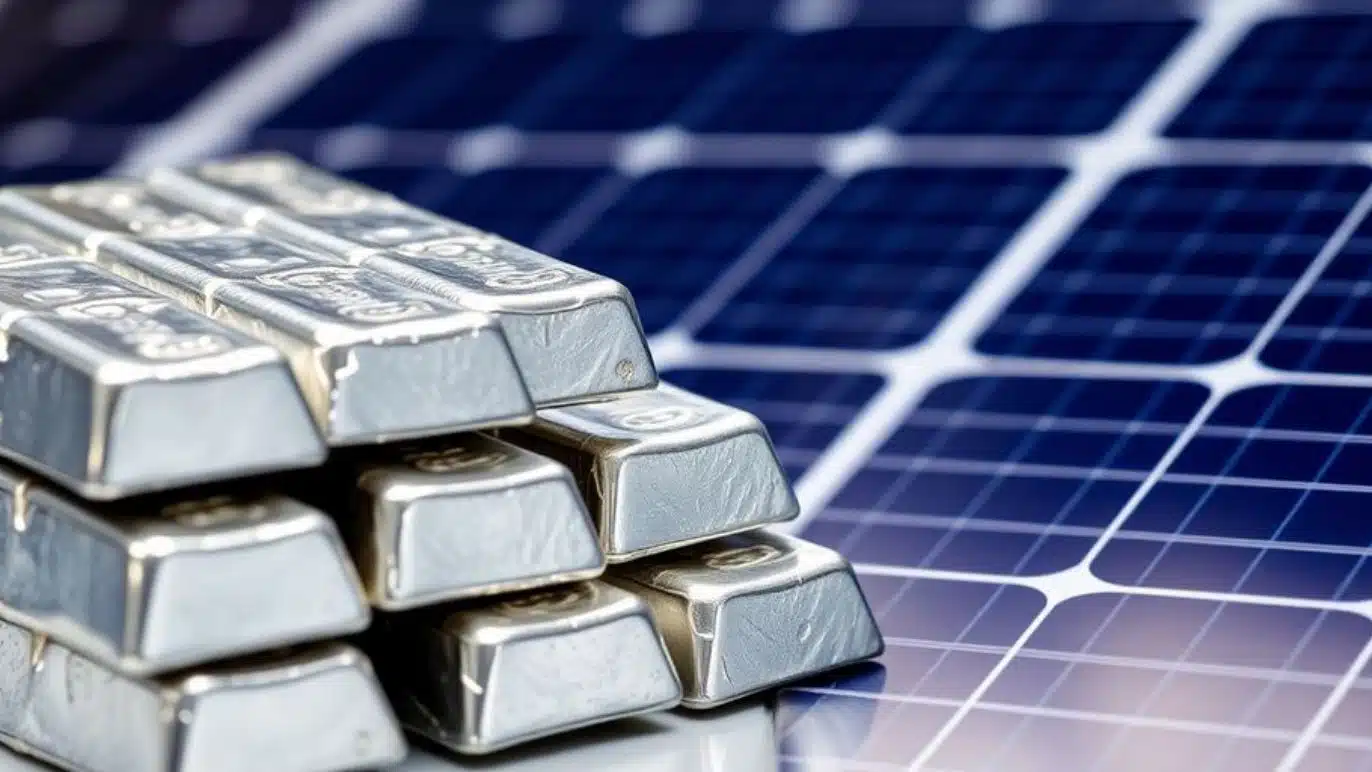
The global silver market faces its most severe supply crunch in decades, with a cumulative deficit approaching 800 million ounces since 2021 as industrial demand from solar panels and electric vehicles surges beyond production capacity. This structural imbalance has depleted inventories across exchanges and vaults, pushing prices to record highs above $65 per ounce amid tightening physical availability. As manufacturers scramble for metal and investors pile in, the crisis signals profound shifts in green energy supply chains and commodity economics.
The Scale of the Crisis
The silver market has logged five straight years of deficits, totaling nearly 800 million ounces—equivalent to almost a full year’s global production—through aggressive drawdowns on above-ground stocks. In 2024 alone, demand hit 1.16 billion ounces while supply reached just 1.01 billion, leaving a 149 million ounce gap that forced COMEX inventories down 70% from 2020 peaks to 82 million ounces. London vaults saw 40% stock reductions between 2022 and 2023, with industrial stockpiles now covering only 30-45 days of consumption versus historical 90-120 days.
This isn’t cyclical volatility but a fundamental mismatch: total 2025 supply forecasts at 1.05 billion ounces, up 3% to an 11-year high, yet demand holds steady at 1.20 billion, projecting another 149 million ounce shortfall—the fifth consecutive year. Exchange data shows backwardation in futures, where spot prices exceed forwards, signaling acute physical scarcity as dealers extend delivery times and regional premiums spike. ETF outflows of 118 million ounces in 2023 alone underscore how investors and industry alike tap dwindling reserves.
Industrial Demand Explosion
Industrial fabrication leads the charge, poised to top 700 million ounces in 2025 for the first time, up 3% year-over-year as silver’s conductivity powers the energy transition. Electronics and electrical uses dominate at 465.6 million ounces, growing 1% amid 5G rollouts that demand 28% more silver per antenna array than 4G. AI hardware and grid upgrades add tailwinds, with ethylene oxide catalysts and brazing alloys contributing modest gains.
Yet green tech steals the spotlight. Photovoltaics consumed 197.6 million ounces in 2024 despite thrifting that cut per-panel usage 25% since 2020 to 15mg, as global installations hit record 200+ gigawatts annually—each megawatt needing 2,000-3,000 ounces. BMO Capital pegs 2025 solar demand at 261 million ounces, up 5.5%, fueled by China’s $10 billion subsidies boosting output 5%. EVs amplify this: each vehicle requires about one ounce, double internal combustion engines, with forecasts exceeding 90 million ounces yearly as production scales to 18 million units and charging ports proliferate.
| Sector | 2024 Demand (Moz) | 2025 Forecast (Moz) | Growth Driver |
|---|---|---|---|
| Electronics/Electrical | 460+ | 465.6 | 5G, AI hardware |
| Solar (PV) | 197.6 | 195.7-261 | Installations, subsidies |
| Automotive/EVs | ~80 | 90+ | Electrification, batteries |
| Other Industrial | Varies | Rising | EO catalysts, brazing |
Total industrial hit 680.5 million ounces in 2024, a record, with 2025 set to eclipse it despite PV thrifting offsets.
Supply Struggles Mount
Mine production climbed 0.9% to 819.7 million ounces in 2024, led by Mexico, China, Peru, Bolivia, and Chile, with gold-mine by-product up 12% to 13.9 million ounces. Forecasts call for a seven-year high of 844 million ounces in 2025, up 2%, from ramps at Canada’s Keno Hill, Chile’s Salares Norte, and Morocco’s Zgounder. Yet lead-zinc output stays flat amid suppressed base metal prices, and Mexico faces a 0.2% dip to 231.8 million ounces as San Julián nears end-of-life in 2027 and closures hit Mercedes, Bolanitos, and others.
Structural hurdles persist: declining ore grades demand more processing for less yield, all-in sustaining costs rose 40% since 2020 on energy and labor inflation, and new mines take 7-10 years amid regulatory delays. Exploration yields fewer greenfield hits despite spending hikes, with reserve replacement lagging consumption. Recycling hit a 12-year high of 193.9 million ounces in 2024, up 6% from industrial scrap like EO catalysts and 11% silverware sales, projected to breach 200 million in 2025.
| Supply Source | 2024 (Moz) | 2025 Forecast (Moz) | Key Challenges |
|---|---|---|---|
| Mine Production | 819.7 | 844 | Grade decline, closures |
| Recycling | 193.9 | 200+ | Energy costs limit growth |
| Total Supply | 1.01B | 1.05B | By-product flatness |
These increments fall short, perpetuating deficits.
Solar and EV Drain Accelerates
Solar’s thirst defines the deficit. Global capacity additions exceed 200 gigawatts yearly since 2022, with each module’s 15-20mg silver paste enabling 22-25% efficiency gains critical for viability. China’s dominance—subsidized manufacturers—drives 5% consumption hikes, outpacing thrifting as installation volumes soar. India follows suit, amplifying Asia’s pull on reserves already strained by 161 million ounces in 2023 alone.
EVs compound the pressure. Traditional cars use ~0.5 ounces; EVs double that for conductive pastes, switches, and roof antennas, with solid-state batteries like Samsung’s eyeing 1kg per pack via silver-carbon layers. U.S. projections for 28 million charging ports by 2030 each demand silver-intensive components. As fleets grow—18 million battery EVs annually by 2025—90 million ounces vanishes into powertrains and infrastructure, inelastic to price spikes due to locked-in designs.
This duo consumed over 250 million ounces combined in 2024, projected higher in 2025 despite efficiencies, as policy pushes renewables even under U.S. tariff scrutiny.
Inventory Depletion Signals Alarm
Above-ground stocks bear the brunt: COMEX registered fell from 346 million to 82 million ounces since 2020; global ETFs shed 118 million in 2023. LME and London vaults hit historic lows, with industrial buffers at 30 days—versus 120 historically—forcing premiums and delays. U.S. defense stockpiles vanished in 2019, leaving no buffers.
Backwardation emerged as futures reflect physical tightness, with lease rates spiking on liquidity squeezes. Dealers report critically low positions, extending large-order timelines amid 15-20% spot liquidity siphoned by manufacturer offtake. This drawdown—800 million ounces total—alters dynamics irreversibly, as replenishment lags years behind.
Price Surge and Market Reactions
Silver shattered $65 in December 2025, up from $64 earlier, driven by deficits and short-covering ahead of Trump tariffs. Forecasts eye $35-40 by year-end, with banks averaging $56-65 for 2026; bulls push $72-88 if gold-silver ratio compresses to 83. Citigroup targets $43 short-term, UBS $42 mid-2026, WisdomTree $45+.
Investment rebounds 3% in 2025, with ETP inflows highest since 2020 amid diversification from U.S. debt, equities peaks, and real-rate drops. Yet jewelry/silverware dip 6-16% on India/China price sensitivity. Volatility reigns: tariffs could crimp industrial sentiment, but scarcity overrides.
Industry Adaptations Underway
Manufacturers pivot amid inelastic needs. Solar firms thrift via thinner pastes; EVs optimize wiring. Broader strategies include substitution R&D, diversified sourcing, strategic stockpiling, recycling advances (30% e-waste recovery potential), and long-term contracts. Offtake deals lock supply, shrinking spot markets 15-20%.
Price hikes pass through minimally—electronics absorb via margins—but delays hit: panel production slows if paste shortages bite. Miners gain pricing power, yet capex lags for new projects.
Investment and Policy Ripples
Portfolios diversify into silver’s dual industrial-monetary role, with 2025 physical investment up 3% in West offsetting India sales. Trump’s tariffs stoke uncertainty, boosting safe-haven flows but risking China growth and renewables. Geopolitics, debt worries sustain appeal versus equities.
Bullish alignment: supply tightness, green demand, technical breakouts unseen in a decade. Yet risks loom—thrifting acceleration, economic slowdowns.
Future Outlook: Tightrope Ahead
2026 could outshine with $40-45+ prices if deficits persist, though mine peaks and recycling caps offer slim relief. Long-term: production CAGR -0.9% to 2030 from closures in Mexico/Peru. Green megatrends lock demand, but innovation races supply.
Stakeholders face a repriced reality: silver’s scarcity redefines energy transitions, rewarding early adapters while challenging laggards. Industries must innovate; investors hedge; miners expand. The 800 million ounce hole underscores one truth—silver powers tomorrow, but tomorrow demands more today.