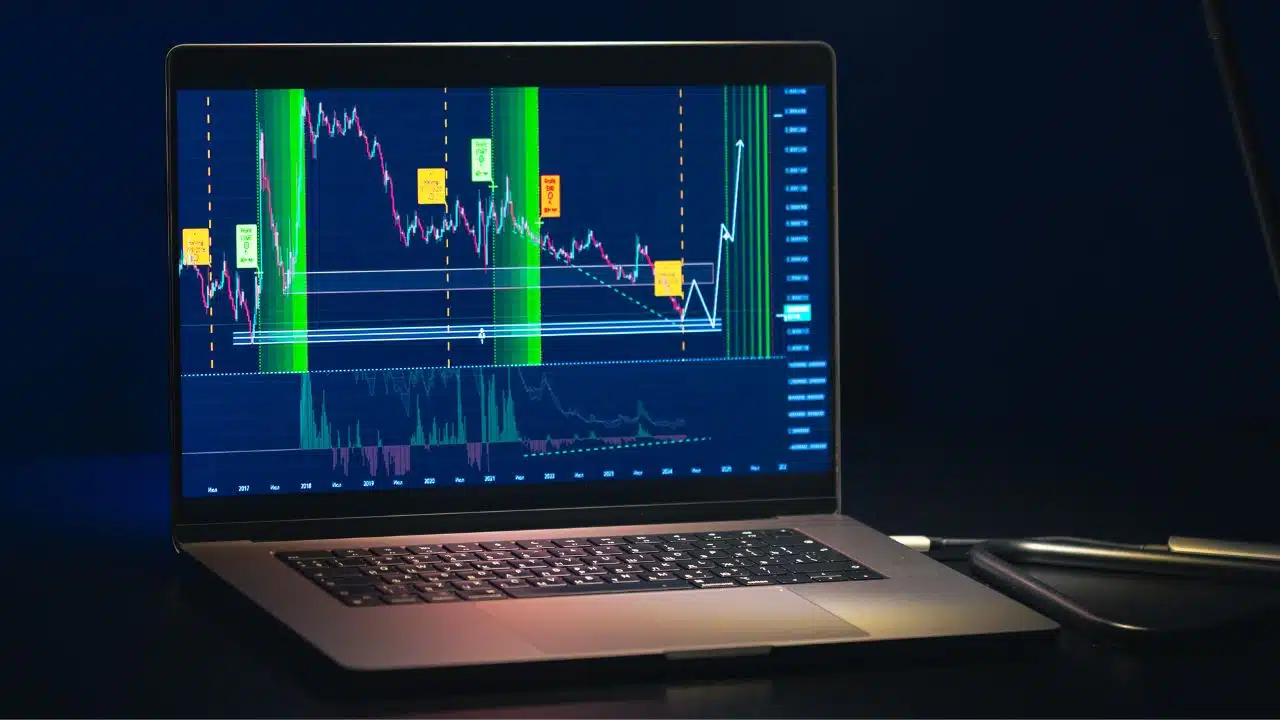
Traders have been dependent on visual chart patterns, intuitions, and experience for the past many years to make profitable decisions. And while this approach has been helpful and successful, the changing dynamics of the current market call out for better strategies to succeed. An amalgamation of chart reading with data-backed techniques is leading as one of the best ways to ensure traders success and goal achievements.
This is where Quantitative technical analysis comes in. With its capabilities to convert visual signals into programmable strategies, this technical analysis empowers traders to make informed decisions. What further sets it apart is that these accurate decisions are made on the basis of evidence and not assumptions.
Whether you have short-term moves or long-term positions in mind, a clarity on how to quantify candlestick patterns and price action is becoming an essential part of a trader’s toolkit.
Why Chart Patterns Still Matter and How Data Enhances Them
Chart patterns are visual representations of price movements over a period of time. The psychology of the market and its many moods such as fear, greed, momentum, and hesitation, can be better understood in the form of price bars and candlesticks.
Popular patterns like:
- Head and Shoulders
- Double Tops and Bottoms
- Bullish Engulfing or Hammer Candlesticks
Potential reversals or trends continuations can be better understood with these trends. However, its vital to know that not all these trends guarantee effectiveness. This is why quantifying their success rates through backtesting is a game-changer. By putting these visual cues into a quantitative framework, traders can validate their strategy and avoid confusions.
Getting Practical: From Pattern to Code
With QuantInsti’s Price Action Trading Course and Candlestick Patterns Course, traders today can learn how to:
- Use code to find patterns rather than visual inspection.
- Use pattern rules to establish entry and exit points.
- Historical data Techniques for backtesting using.
Metrics like the Win Rate, Drawdown, and Sharpe Ratio can be used to calculate performance.
Instead of merely recognising a Hammer candle, for instance, one can learn to apply Python logic to recognize it. Place a stop-loss beneath it, and determine whether buying at the close consistently yields profitable results.
With this kind of structured learning one not only saves time but also enables automation, accuracy, and execution assurance.
Real-World Success Story: Nikhil’s Journey into Quantitative Trading
Nikhil Channarayapattana Prakash, a Commerce graduate and Financial Analyst from Bangalore was looking for the most lucrative strategies post his first salary. And like many others, he was curious about the market.
Despite a background in finance, Nikhil was looking for more than just theoretical knowledge. He was looking for a strategy that enabled him to earn and trade like a professional. And for this strategy automation, live trading, and portfolio analysis, online resources didn’t seem enough.
That’s when he discovered EPAT by QuantInsti.
“I wanted to automate my trading ideas,” Nikhil says. “And EPAT helped me do just that with the right structure, the right tools, and guidance from actual practitioners.”
Today, as a Quantitative Analyst at a leading platform for automated trading, Nikhil handles live Algo Trades, optimising execution and client strategies. From a commerce graduate to a full-time quant his journey shows that with the right guidance, anyone can make it in algorithmic trading.
What You Can Learn from the Quantitative Approach
Quantitative technical analysis aims to remove human bias. Instead of assuming that a pattern “should” work, it is tested.
Following includes what traders focus on:
1. Candlestick Pattern Recognition
Short-term indicators of buying or selling pressure can be explained as candlestick patterns. Courses like the Candlestick Patterns Course by QuantInsti empower you to:
- Identify single and multi-candle setups. This includes Marubozu, Doji, Hammer, and Engulfing
- Use logic statements for code
- Attaining improved accuracy by combining multiple patterns
- Test the performance across different time frames
- Use strategies for stop loss and book profit in real market conditions
2. Chart Pattern Automation
Visual formations, such as Head and Shoulders or Double Tops, can be detected with defined price movement logic. Once identified, these patterns are tested over hundreds of samples to boost the success rates.
QuantInsti’s Price Action Trading Course offers downloadable codes to automate:
- Chart pattern detection
- Breakout and reversal confirmation
- Entry and exit rule implementation
- Risk and position sizing models
3. Support, Resistance & Fibonacci Tools
Traders use code to identify zones of interest instead of manually drawing trendlines, where prices tend to react frequently. Tools like:
- Pivot Points
- Fibonacci Retracement Levels
are made a part of the trading system to build strategies that adapt to both sideways and trending markets.
Role of Indicators in Quantified Trading
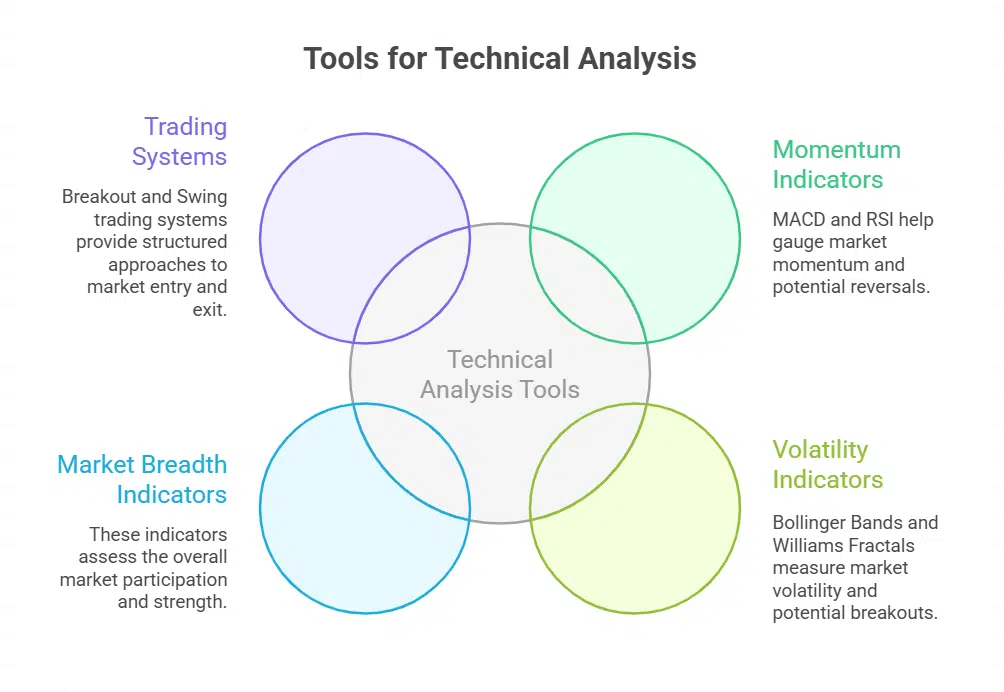
While chart patterns provide context, indicators help quantify momentum, volume, and the strength of the trend. In QuantInsti’s Technical Analysis Using Quantitative Methods track, learners explore:
- MACD, RSI, Bollinger Bands, Williams Fractals
- Market Breadth and Volume indicators
- Breakout and Swing trading systems
All these are taught with Python-based examples. It allows traders to customise their indicators and combine them with candlestick or chart pattern strategies.
The Power of Learning with QuantInsti
QuantInsti is not just another online learning platform. It’s a well-recognised global institute providing practical, hands-on learning for traders at diverse stages.
With users across 190+ countries, their mission is simple: to bridge the gap between financial theory and practical trading skills.
Here’s what makes QuantInsti stand out:
- Expert Faculty: Learn from real-world traders and quants
- Interactive Practice: Make the most of live trading, backtesting, and coding assignments
- Community Learning: Peer support and faculty engagement through forums
- Lifetime Access: Revisit content and get updates long after completing the course
Whether you’re a beginner who wants to learn from scratch or an analyst looking to upgrade your skills, a structured approach like this makes complex topics easy to grasp and apply.
A Future-Ready Way of Trading
Trading has evolved and is no longer dependent upon chances and hope. Only those traders that are data-driven, systematic, and constantly learning are on their way to success.
By quantifying chart patterns, coding trading signals, and backtesting strategies, thrive on the power of discipline and not emotions. And with platforms like QuantInsti, the journey is no longer intimidating.
From candlestick pattern recognition to price action automation, everything is taught in a way that’s practical, hands-on, and structured so that by the end of the course, you’re not just learning, you’re trading smarter.
Ready to Trade Like a Quant?
Explore QuantInsti’s specialised learning tracks and begin your journey with their Price Action Trading Course, Candlestick Patterns Course, or the full Quantitative Technical Analysis path. Discover how trading strategies are built, tested, and executed with clarity, confidence, and consistency.