The modern trading world is fast-paced and requires efficiency and alertness from traders. Missing important clues about market whereabouts usually costs dearly. From AI-powered algorithms disrupting markets to automated chart scanners, traders have to use smart tools to gain and maintain the edge. Despite machine learning and modern big data tools, few classic indicators remain potent. Parabolic SAR is among the most popular and powerful indicators, which is also quite old.
The indicator is a stop and reverse, and we will explain what it is and how you should use it in your trading to stay profitable.
Understanding the Parabolic SAR indicator
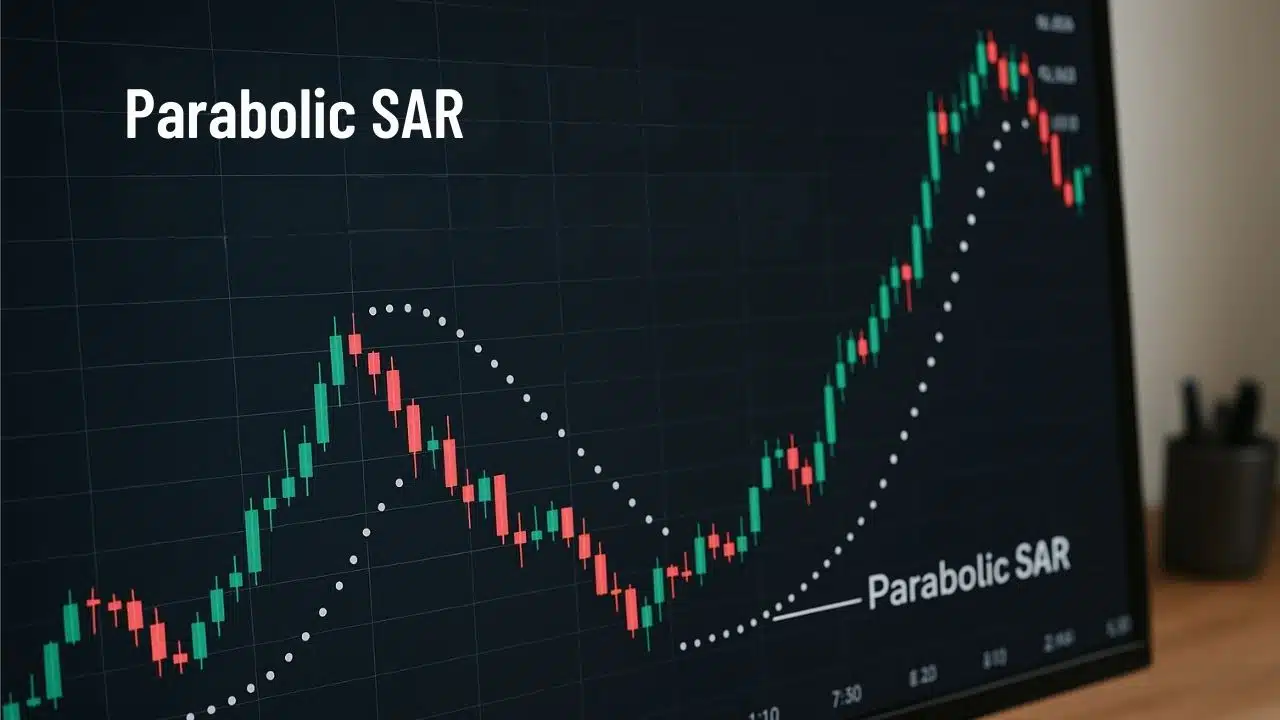
Parabolic SAR, or stop and reverse indicator, was developed by technical analysis pioneer J. Welles Wilder Jr. in 1978. It was designed to simplify the process of spotting potential trend reversals. The keyword here is potential, and it means that while parabolic SAR can erect reversals, not every signal will be played out, and traders should use this tool carefully in conjunction with other indicators and the broader market context. The indicator places a series of small dots, either above or below candles, depending on the direction of the current trend.
SAR in the Parabolic SAR actually stands for Stop and Reverse, highlighting the core function – signaling when the market might reverse, enabling traders to know when to reverse their positions or lock in profits using stop loss adjustments. The formula uses prior price extremes and acceleration values, but has a very simple purpose: follow the trend until it shows signs of exhaustion.
Unlike other indicators like moving averages that tend to smooth out price, or oscillators like RSI that measure momentum, the Parabolic SAR offers visual clarity. It tells traders where the price goes with just one glance and can prepare them for major changes in the trend.
How to apply the Parabolic SAR indicator to your chart
The process is super simple and similar across all major trading platforms:
- Open the chart of an instrument you want to trade, like EUR/USD
- Click on the indicators tab and under the trend indicators, find the Parabolic SAR
- Click OK, and you are all set, as the indicator usually does not need any tweaking
How Parabolic SAR works in real forex trading
The Parabolic SAR indicator can be applied to any financial instrument, including the EUR/USD major forex pairs. When you select it from the indicators menu and add it to your chart, you can visually see dots above or below the current price candles. The majority of modern trading platforms offer this indicator built in, and it does not require you to download or install anything, which makes it so appealing even for beginners. Another reason why the indicator is useful for beginners is that it visually shows where the price is going and enables you to spot trends easily.
Parabolic SAR dots appear below or above the candle. If the price is going up, then dots will appear below each candle, and vice versa. When the price begins to slow down and the dots suddenly flip above or below the current candle, it is an early signal that the trend might be switching direction.
Parabolic SAR performs best in strong trending markets. It can produce false signals in choppy or ranging markets, and this is why it is not recommended to use it as a standalone indicator. Traders often pair Parabolic SAR with the ADX (Average Directional Index) to confirm trend strength, or with MACD to confirm momentum shifts.
Pros and cons of the Parabolic SAR
There are certain unique strengths and weaknesses associated with this indicator, and knowing them is crucial to using this tool to its fullest potential. The biggest and most obvious strength of the Parabolic SAR lies in its ability to clearly show where the price is going, and it does this objectively. You do not need to rely on your gut feeling or subjective judgment; the indicator places the dot below the candle, which means the price is going up, and the opposite is true if the dot appears above the previous candle. Traders often use it to set trailing stop losses as the SAR dots naturally track price action, locking in profits as the trend develops.
Weaknesses of Parabolic SAR
However, no indicator is perfect, and the SAR also struggles in sideways or low-velocity markets. When constant flips occur, it can easily lead to whipsaws. During quiet phases of the forex markets or gold, it can issue premature reversal signals.
To mitigate this, professional traders apply filters like only using SAR when ADX is above 25, which indicates a clear trend is at play. They also confirm it with a higher time frame direction. A higher timeframe filter simply means, if you are trading on a 15-minute timeframe, only take trades when a higher timeframe, like 30-minute or 1-hour, agrees with your current signal.