In today’s dynamic business landscape, staying ahead requires more than just traditional strategies.
Small businesses, particularly in Italy’s competitive market, need innovative tools to thrive. One such tool is business mapping.
By visually representing processes, customer journeys, and market data, business mapping can transform how you operate, helping your business grow and adapt.
In this article, we’ll explore ten impactful ways business mapping can revolutionize your small business in Italy and provide actionable insights to help you get started.
What Is Business Mapping?
Business mapping involves creating visual representations of workflows, customer journeys, market data, or other essential business elements.
These maps simplify complex information, making it easier to analyze and act upon.
For example, a workflow map outlines each step in a business process, helping identify inefficiencies.
A customer journey map highlights every interaction a customer has with your brand, enabling better engagement strategies.
Why Business Mapping Matters for Small Businesses
Small businesses often operate with limited resources, making efficiency critical. Business mapping empowers owners to:
- Identify inefficiencies: Spot bottlenecks and redundancies in processes.
- Enhance decision-making: Use visual data to make informed choices.
- Align teams: Improve collaboration by ensuring everyone understands the workflow.
- Optimize customer experiences: Address pain points and improve satisfaction.
Challenges Facing Small Businesses in Italy
Italy’s small businesses face unique challenges, including:
- High competition: Italy’s market is saturated with small and family-owned businesses.
- Regulatory hurdles: Navigating complex bureaucracy can be time-consuming.
- Economic uncertainty: External factors like inflation and global market changes impact growth.
10 Ways Business Mapping Strategies to Transform Small Businesses in Italy
Let’s get started with the list:
1. Streamline Internal Processes
Inefficient processes can drain time and resources. With workflow maps, you can visualize each step of your operations, pinpoint delays, and implement improvements.
For example, a logistics company in Rome used process maps to reduce delivery times by 20%.
Workflow maps also make it easier to onboard new employees by providing a clear visual guide to daily operations.
This can lead to faster training times and fewer errors during initial tasks.
| Key Metrics Before Workflow Mapping | Key Metrics After Workflow Mapping |
| Average Delivery Time: 72 hours | Post-Mapping Time: 58 hours |
| Error Rate: High | Error Rate Reduction: 15% |
Key Tools: Lucidchart and Visio offer intuitive platforms to design detailed workflows and identify bottlenecks.
2. Improve Customer Experience
A customer journey map provides a comprehensive view of interactions between your business and customers. This enables you to enhance touchpoints like response times and personalized offers.
By identifying pain points, you can create a smoother customer experience, increasing loyalty and referrals.
Customer journey mapping is particularly beneficial for businesses in the hospitality and tourism sectors, where customer satisfaction is critical.
For instance, a boutique hotel in Venice used journey maps to improve check-in procedures, resulting in a 20% increase in positive online reviews.
Case Study: A local bakery in Florence leveraged customer journey mapping to identify delays in online order processing. By implementing automated responses and quicker delivery options, they increased customer satisfaction by 30%.
Before and After Mapping Customer Journeys:
| Metric | Before Mapping | After Mapping |
| Response Time | 48 hours | 24 hours |
| Customer Retention Rate | 70% | 85% |
3. Enhance Marketing Strategies
Marketing success relies on understanding your audience. Geographical and demographic maps allow you to target campaigns effectively.
For instance, a small pizzeria in Milan increased sales by 30% using hyper-local promotions based on population density.
Adding heatmaps to your strategy can show where your customers are most concentrated, allowing for hyper-focused advertising.
You can also analyze competitor locations to identify underserved areas.
Actionable Tips:
- Segment customers by location and preferences.
- Use demographic data to craft tailored campaigns.
Tools for Marketing Optimization:
| Tool | Purpose | Key Feature |
| Google My Maps | Geographic market analysis | Custom data visualization |
| Canva Maps | Social media campaign design | Easy map customization |
| HubSpot | Marketing and CRM integration | Automated email campaigns |
4. Optimize Supply Chain Management
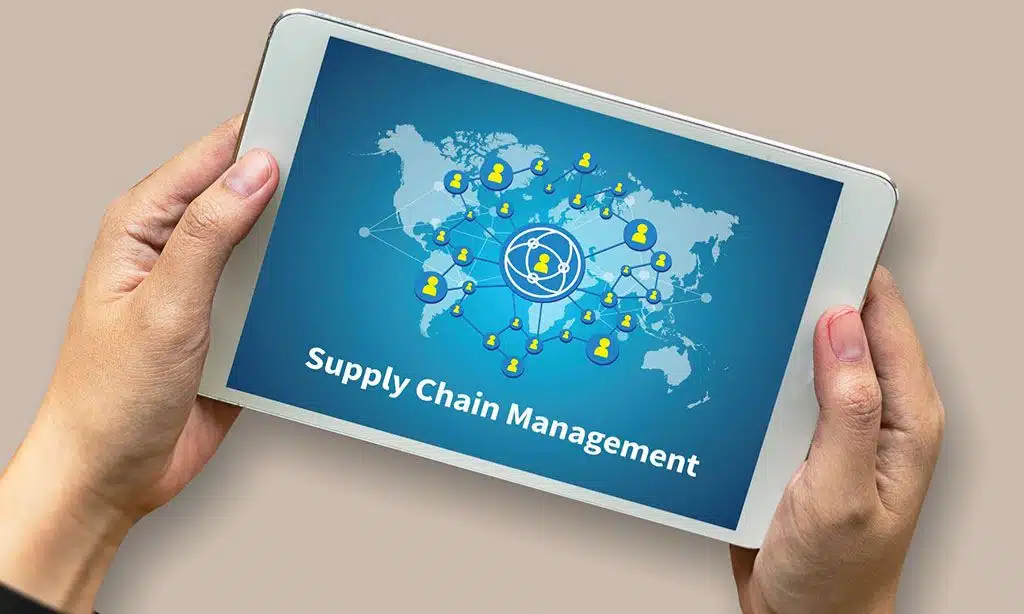
Visualizing supply chains helps reduce costs and improve delivery times. For instance, mapping local suppliers in Italy can save transportation expenses while supporting sustainability goals.
A small clothing manufacturer in Naples achieved 25% cost savings by sourcing from nearby suppliers.
By integrating supply chain mapping with inventory management systems, businesses can ensure stock levels align with customer demand, reducing overstock or shortages.
| Key Metrics for Supply Chain Mapping | Outcome |
| Transportation Costs | Reduced by 25% |
| Delivery Time | Improved by 15% |
| Inventory Accuracy | +10% improvement |
Pro Tip: Regularly update supply chain maps to reflect changes in supplier availability or transportation routes.
5. Boost Sales with Territory Mapping
Territory mapping ensures sales teams are assigned to the right regions, optimizing coverage and reducing overlap.
A tool like Badger Maps enables real-time visualization of territories, boosting sales by 25% for an electronics retailer in Florence.
Sales territory maps also help identify areas that require additional resources, ensuring no potential market is overlooked. Small adjustments in territory alignment can significantly increase overall revenue.
6. Identify New Market Opportunities
Mapping competitors and customer demographics reveals underserved markets. A boutique in Florence identified an untapped market for sustainable fashion by mapping eco-conscious consumers.
Targeted campaigns in these areas boosted revenues by 40% in six months.
Consider incorporating data from industry reports and local government resources to identify trends and predict future demand in specific regions.
This approach is particularly useful for new product launches.
Action Plan:
- Use competitor mapping to benchmark your positioning.
- Identify trends and gaps in customer needs.
7. Facilitate Collaboration Among Teams
Business maps help align remote and in-house teams, fostering collaboration and clarity. Tools like Miro and Asana integrate mapping features with project management, boosting team productivity.
By mapping workflows, an IT firm in Bologna reduced project delays by 30%.
Using team collaboration maps also encourages cross-departmental transparency, reducing miscommunication and fostering a stronger sense of ownership among employees.
Practical Tips:
- Host regular team sessions to update maps.
- Use color-coded maps for task prioritization.
8. Ensure Better Compliance and Risk Management
Regulatory mapping simplifies compliance with Italy’s complex legal requirements. For example, mapping GDPR regulations can help avoid hefty fines by ensuring data handling processes are compliant.
A local fintech startup in Milan reduced regulatory penalties by 50% using visual compliance maps.
For businesses operating internationally, compliance maps can highlight discrepancies in regional regulations, ensuring smooth operations across borders.
Regulatory Mapping Checklist:
| Step | Description |
| Identify Key Areas | Highlight compliance requirements. |
| Map Processes | Visualize regulatory workflows. |
| Regular Reviews | Ensure ongoing compliance updates. |
9. Enhance Decision-Making with Data Visualization
Business mapping transforms raw data into actionable insights. For instance, using Tableau, small wineries in Tuscany visualized sales trends to optimize their marketing efforts.
Data visualization also improved inventory management by 20%, reducing waste and boosting profits.
Integrating real-time data into visual dashboards ensures that decision-makers have access to up-to-date insights, improving responsiveness to market changes.
Tools for Data Visualization:
| Tool | Feature | Benefit |
| Tableau | Real-time dashboards | Quick trend identification |
| Power BI | Advanced analytics | Predictive insights |
| Qlik Sense | Interactive visualizations | Enhanced user experience |
10. Drive Innovation Through Visual Insights
Business mapping encourages brainstorming and innovation by presenting data visually.
An artisan shop in Venice expanded into e-commerce after mapping customer preferences for online shopping. This pivot increased their revenue by 60% in the first year.
Mind maps and innovation mapping can also help uncover potential partnerships, providing new avenues for growth.
Regular innovation sessions driven by visual insights can inspire fresh ideas.
| Metric | Value |
| Revenue Growth | 60% increase |
| Online Customer Base | Expanded by 40% |
Inspiration: Use mind maps to generate creative ideas during strategy meetings.
Tools and Software for Business Mapping in Italy
Best Mapping Software for Small Businesses
| Tool | Features | Pricing (Per Month) | Best For |
| Lucidchart | Workflow diagrams, team collaboration | €7.95 | Process Mapping |
| Badger Maps | Sales territory optimization | €35 | Sales Team Efficiency |
| Tableau | Data visualization and insights | €70 | Advanced Analytics |
| Maptive | Custom maps and geolocation analysis | €29.99 | Geographic Market Analysis |
Free vs. Paid Tools: Which Should You Choose?
- Free Tools: Ideal for startups with minimal budgets. Examples include Google My Maps and Canva Maps.
- Paid Tools: Offer advanced features and scalability, better for established businesses.
How to Get Started with Business Mapping
Step-by-Step Guide
- Define Your Business Goals: Identify areas where mapping can add the most value, such as improving customer experience or optimizing logistics.
- Choose the Right Tools: Select software that aligns with your needs and budget.
- Gather Relevant Data: Collect data on workflows, customer interactions, and market trends.
- Map Your Processes or Strategies: Create visual maps to understand the current state and identify opportunities.
- Analyze and Iterate: Regularly review maps to refine strategies and track progress.
Common Mistakes to Avoid
- Overcomplicating maps with too much detail.
- Neglecting to update maps regularly.
- Failing to involve your team in the mapping process.
Takeaway
Business mapping isn’t just a tool; it’s a transformative strategy that can elevate your small business to new heights.
From streamlining operations to identifying growth opportunities, the benefits are undeniable.
Start your business mapping journey today and unlock your potential in Italy’s vibrant market.