
If you spend enough time looking under the hood of subscription businesses, you start to see a pattern. Founders love to lead with vanity metrics, total sign-ups, website traffic, or “cumulative revenue.” But when I evaluate a SaaS company or review an editorial breakdown of a tech business, I skip right past those slides.
I want to know if the economic engine actually works. To figure that out, I only need to see three primary numbers, plus a couple of context checks.
Whether you are a founder trying to raise capital, a content strategist trying to understand the SaaS business model, or an operator trying to hit your targets, these are the SaaS metrics you actually need to master. Let me walk you through exactly what they mean, how people calculate them wrong, and how to put them into action.
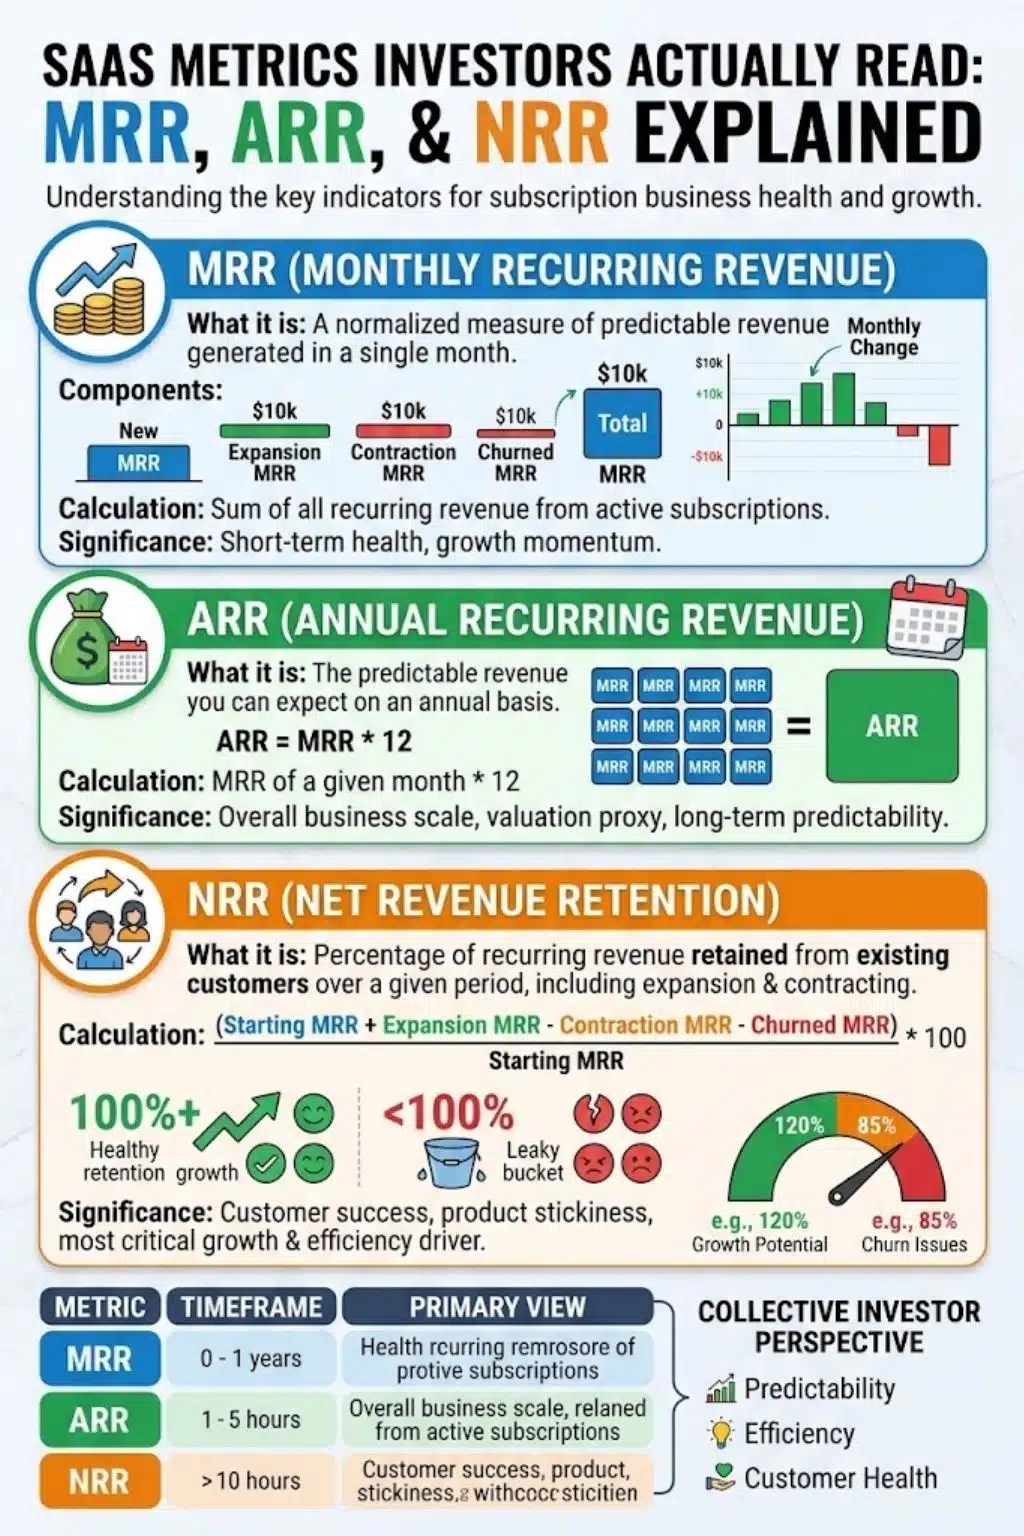
MRR (Monthly Recurring Revenue): The Heartbeat
MRR is the normalized, predictable revenue your business generates from active subscriptions in a single month. I like to think of it as the operational heartbeat of the company. It tells me exactly how the business is performing right now, today.
Where founders get it wrong
The biggest mistake I see is founders artificially inflating their MRR by throwing in one-time setup fees, consulting hours, or non-recurring usage charges. If a customer pays you a $5,000 implementation fee and $1,000 a month for the software, your MRR is $1,000. Full stop. Investors will strip out those one-time fees during due diligence anyway, so it is better to be brutally honest from the start.
The MRR Waterfall: I never just look at the top-line MRR number; I want to see the “waterfall.” I need to know how you arrived at that number.
- New MRR: Revenue from brand new customers.
- Expansion MRR: Revenue from existing customers upgrading or buying more seats.
- Contraction MRR: Revenue lost from existing customers downgrading.
- Churned MRR: Revenue lost from customers who canceled entirely.
If you are a seed or Series A startup, I am generally looking for a consistent month-over-month MRR growth rate of at least 10% to 15%.
ARR (Annual Recurring Revenue): The Valuation Anchor
Once a startup crosses about $1 million in revenue, we stop talking in terms of MRR and switch to ARR. ARR is the annualized run rate of your current active subscription base.
The golden rule of ARR: ARR is simply MRR multiplied by 12.
It is not a trailing twelve-month calculation of the cash you collected. It is a forward-looking metric. If you hit $100,000 in MRR on December 1st, your ARR is $1.2 million, even if you only collected $500,000 over the course of that year as you grew. It represents the size of your business if time froze and every current customer stayed for a year.
Why it matters: ARR is the anchor for your company’s valuation. In the private markets, SaaS valuations are almost exclusively discussed as a multiple of ARR.
NRR (Net Revenue Retention): The Holy Grail
If MRR is the heartbeat and ARR is the anchor, NRR is the rocket fuel. It is, without a doubt, the single most important metric for a late-stage SaaS company.
NRR answers one critical question: If your sales and marketing teams went on vacation for a year and you signed zero new customers, what would happen to your revenue?
The Formula: You take your starting recurring revenue from a specific cohort of customers, add their expansion revenue, and subtract their downgrades and churn. Then, divide that by the starting revenue.
Here is why NRR is magic: it proves whether your product is actually sticky.
- Below 100%: You have a leaky bucket. You are losing more money to churn and downgrades than you are gaining from upsells. You have to constantly acquire new customers just to tread water.
- 100% to 110%: This is healthy and normal, especially if you sell to small-to-medium businesses (SMBs) where a certain amount of churn is natural.
- 120%+ (The Holy Grail): At 120% NRR, your existing customer base is organically growing your revenue by 20% every year without you having to hunt for a single new logo.
The Context Metrics: Why ARR Needs CAC and LTV
You cannot truly evaluate the health of recurring revenue without knowing how much it cost to acquire it. If you tell me you have $10M in ARR, I will be impressed. If you tell me it costs you $20M in marketing to get there, I am terrified.
This is where Customer Acquisition Cost (CAC) and Lifetime Value (LTV) come in.
I want to see a healthy ratio between the two. The industry standard is 3:1, meaning a customer brings in three times more revenue over their lifetime than it cost you to acquire them. If your ratio is 1:1, you are burning cash. If it is 6:1, you actually aren’t spending enough on marketing and are leaving growth on the table.
How to Actually Track These Metrics
You might be wondering how founders keep track of all this math. The short answer is: they don’t do it manually.
Living in a spreadsheet is a recipe for disaster and broken formulas. Every modern SaaS operator connects their payment processor directly into an analytics tool designed specifically for these metrics. Industry standards like ChartMogul, ProfitWell, and Baremetrics automatically categorize your revenue, flag your churn, and build your MRR waterfalls in real-time. If you are serious about your data, you let the software handle the math.
Actionable Advice: How to Improve Your NRR
If you run your numbers and realize your NRR is sitting at a dismal 85%, you have a leaky bucket. Do not pour more marketing dollars into it until you fix the holes. Here is what I always recommend doing first:
- Shift to Value-Based Pricing: If you only charge a flat monthly fee, your NRR is capped at 100% (minus churn). Introduce pricing tiers based on usage, seats, or premium features so your best customers have a logical path to pay you more.
- Onboard Like Your Life Depends On It: Most churn happens because a customer never fully figured out how to use the software in the first 30 days. Build a guided onboarding sequence that forces them to reach their “Aha!” moment quickly.
- Quarterly Business Reviews (QBRs): Don’t just talk to your customers when they want to cancel. Schedule proactive check-ins to show them the ROI they are getting from your tool. This is also your prime opportunity for upsells.
The Bottom Line
When I look at a SaaS business, I am not looking for perfection. I am looking for a sustainable machine. MRR shows me if the machine is running smoothly day-to-day. ARR shows me how big the machine is. NRR shows me if the machine can grow on its own.
Master those three, understand your acquisition costs, and keep your tracking automated. If your numbers are tight, you will never dread an investor meeting, or a harsh editorial review, ever again.
Frequently Asked Questions (FAQs) on SaaS Metrics
1. What is the difference between NRR and GRR (Gross Revenue Retention)?
Think of GRR as your absolute floor. GRR measures how well you retain revenue without counting any upsells or expansions. It maxes out at 100%. NRR includes those upsells and expansions, which is why it can exceed 100%. I look at GRR to see if your core product is sticky, and NRR to see if your sales team knows how to expand accounts.
2. What is the “Rule of 40” I keep hearing about?
The Rule of 40 is a principle used by late-stage investors to balance growth and profitability. It says that a SaaS company’s growth rate plus its profit margin should equal 40% or more. If you are growing at 50% year-over-year, you can afford a -10% profit margin. If you are only growing at 15%, you better have a 25% profit margin.
3. Do one-time setup fees count toward ARR?
Absolutely not. ARR stands for Annual Recurring Revenue. If a fee doesn’t automatically recur, it stays completely out of your MRR and ARR calculations. Count it as total top-line revenue on your P&L, but keep it out of your SaaS metrics.
4. How do usage-based pricing models calculate MRR?
This is getting incredibly common with modern AI and API-first tools. For usage-based models, we typically look at an average of the last three months of a customer’s usage to calculate their normalized MRR. If the usage is wildly erratic, we apply a heavier discount to how we value that revenue.
5. What is a “good” churn rate?
It depends entirely on who you are selling to. If you sell to enterprise giants on annual contracts, your gross monthly logo churn should be under 1%. If you sell a low-cost tool to freelancers or tiny startups, a 3% to 5% monthly churn rate is entirely standard because small businesses naturally close down or pivot more often. Context is everything.