
If you want a clean picture of where Americans use Claude AI, ChatGPT, and Gemini the most, here’s the honest answer: the map is real, but the data isn’t equally detailed for all three tools. ChatGPT has a strong public state-level view for college-aged users. Claude now has one of the best public state-by-state datasets in the market. Gemini is huge, but Google still hasn’t published a comparable 50-state leaderboard for the standalone app.
That means a smart state-wise analysis has to use three different lenses instead of pretending there’s one perfect chart. For ChatGPT, the clearest state signal comes from OpenAI’s February 2025 report on U.S. users ages 18 to 24. For Claude, Anthropic’s September 2025 Economic Index gives both raw state usage and population-adjusted usage. For Gemini, the best public clues come from Google’s product updates, U.S. consumer surveys, and traffic data rather than a direct state ranking.
So this article does two things at once. First, it shows the strongest state-level signals we do have. Second, it explains what those signals actually mean, so you don’t confuse search interest, student adoption, app installs, and per-capita usage as if they were all the same thing. That distinction matters if you’re a publisher, marketer, educator, employer, or just trying to understand the real U.S. AI adoption map.
Where Americans Use Claude AI, ChatGPT, and Gemini the Most: How to Read This Data
Three different datasets are shaping the map
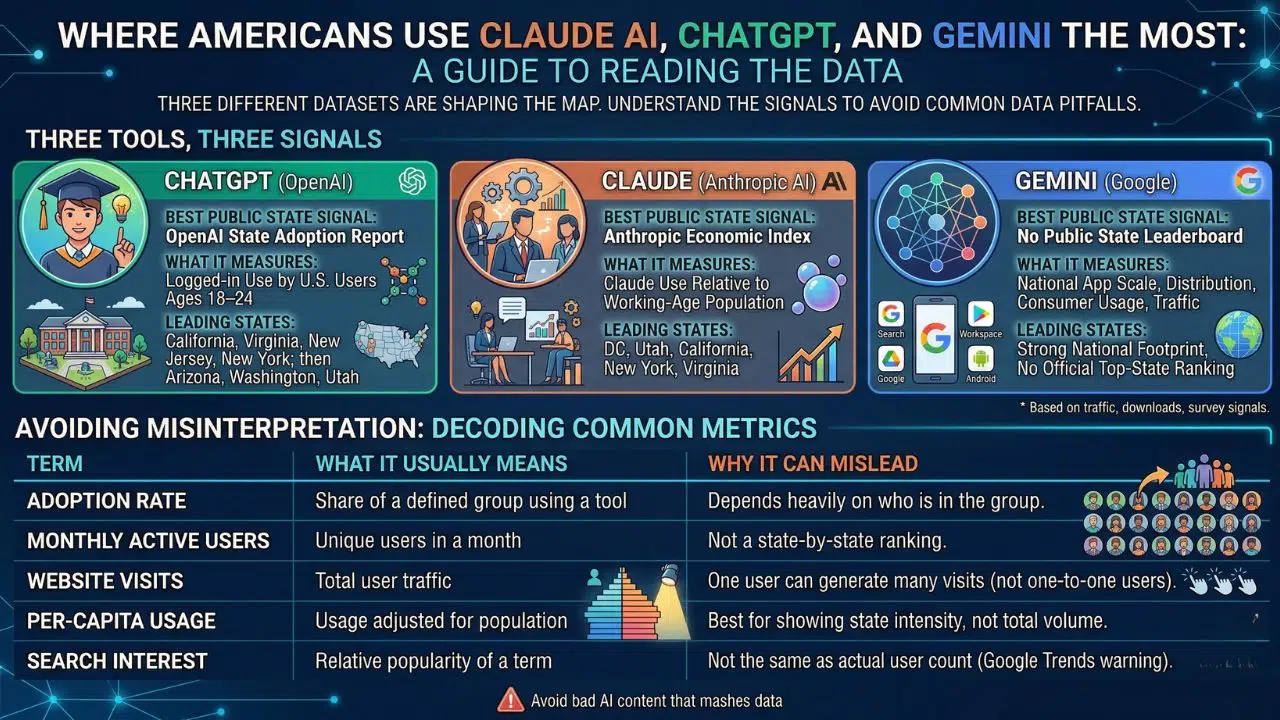
The first thing to know is that there is no single public scoreboard that ranks all 50 states for ChatGPT, Claude, and Gemini side by side. OpenAI’s public state data focuses on college-aged users. Anthropic’s public state data looks at Claude conversations and adjusts them against working-age population. Google, by contrast, has shared big national milestones for Gemini, but not a public state-by-state usage table for the Gemini app.
That sounds messy, but it still gives us a useful read. ChatGPT is easiest to track in education and early-career usage. Claude is easiest to track in knowledge-work intensity and per-capita concentration. Gemini is easiest to track through Google’s broader product reach, consumer survey data, app downloads, and traffic growth. In other words, each tool reveals a different slice of the U.S. market.
| Tool | Best public state signal | What it measures | Leading public states/signals |
| ChatGPT | OpenAI state adoption report | Logged-in use by U.S. users ages 18–24 | California, Virginia, New Jersey, New York; then Arizona, Washington, Utah |
| Claude | Anthropic AI Usage Index | Claude use relative to working-age population | DC, Utah, California, New York, Virginia |
| Gemini | No public state leaderboard | National app scale, distribution, consumer usage, traffic | Strong national footprint, but no official top-state ranking |
Table summary based on OpenAI’s U.S. student adoption report, Anthropic’s Economic Index, and Google plus third-party usage signals.
What “most used” really means here
A lot of bad AI content on the web mashes together downloads, visits, app users, and survey awareness. That’s how you end up with clean-looking maps that don’t really say much. Google Trends itself warns that regional interest is adjusted popularity, not raw volume, and a state not lighting up doesn’t mean nobody there uses the term.
So when we talk about where Americans use Claude AI, ChatGPT, and Gemini the most, we have to be precise. ChatGPT’s public state chart is about younger users. Claude’s state chart is about working-age-population-adjusted usage. Gemini’s public footprint is more about broad distribution across Search, Workspace, Android, and the Gemini app than a disclosed state ranking.
| Term | What it usually means | Why it can mislead |
| Adoption rate | Share of a defined group using a tool | Depends on who is in the group |
| Monthly active users | Unique users in a month | Not a state ranking |
| Website visits | Total traffic | One user can generate many visits |
| Per-capita usage | Usage adjusted for population | Better for state intensity, not total volume |
| Search interest | Relative popularity of a term | Not the same as actual user count |
This framing follows how the underlying sources define their measures.
ChatGPT State Wise Analysis: Where ChatGPT Looks Strongest
The states leading ChatGPT adoption
OpenAI’s public state-level report says the highest ChatGPT adoption among Americans ages 18 to 24 is in California, Virginia, New Jersey, and New York, followed by Arizona, Washington, and Utah. On the low end, the report names Wyoming, Alaska, Montana, and West Virginia as relatively low-adoption states for that same age group. That is the clearest public state chart we currently have for ChatGPT inside the U.S.
The bigger national backdrop makes that state pattern more believable, not less. Pew found that 34% of U.S. adults had used ChatGPT by early 2025, and usage was much higher among younger adults, with 58% of adults under 30 saying they had used it. OpenAI’s own consumer-use research also said ChatGPT had reached 700 million weekly active users and that most consumer usage centered on practical guidance, information, and writing.
OpenAI’s education report adds another useful clue: more than one-third of college-aged young adults in the U.S. use ChatGPT, and roughly a quarter of messages from that age group are tied to learning and school. Top student use cases include starting papers, summarizing texts, brainstorming, exploring topics, and revising writing. That helps explain why states with strong student adoption are such a big part of the ChatGPT map.
| ChatGPT state signal | What the public data says |
| Highest adoption states among 18–24 users | California, Virginia, New Jersey, New York |
| Next tier | Arizona, Washington, Utah |
| Lower-adoption states named by OpenAI | Wyoming, Alaska, Montana, West Virginia |
| Strongest national demographic | Adults under 30 |
| Leading use cases | Learning, writing, information seeking, work tasks |
Table summary compiled from OpenAI and Pew data.
Why ChatGPT wins early in these states
The ChatGPT pattern looks a lot like a student-and-knowledge-work map. OpenAI itself frames these state gaps as a workforce-readiness issue, warning that uneven student adoption could later show up in productivity and economic-development gaps. The report also points to policy momentum in places like Utah and New York, where institutions have taken more proactive steps around AI integration in higher education.
There’s another reason ChatGPT stays sticky: it is still the default general assistant for a lot of Americans. Menlo Ventures found that 28% of Americans had used ChatGPT in the past six months, compared with 23% for Gemini, and said most users reach for a favorite general AI tool first before trying anything more specialized. That default behavior helps ChatGPT keep its lead in education, work, and everyday tasks.
And the work angle is now hard to ignore. Pew found that the share of employed U.S. adults who say they use ChatGPT for work rose to 28%, while younger workers were even more likely to use it on the job. So when you see California, Virginia, New Jersey, and New York on the student map, it’s fair to read that as more than a campus story. It is also an early-career and white-collar adoption story.
Claude AI State Wise Analysis: Where Claude Is Hottest Per Capita
Claude’s strongest states depend on whether you use raw volume or per-capita intensity
Anthropic’s data gives us a more layered state picture than most AI companies have shared. In raw U.S. volume, California leads with 25.3% of Claude usage, followed by New York at 9.3%, Texas at 6.7%, and Virginia at 4.0%. That looks like a classic big-state, tech-hub pattern.
But the more interesting number is Anthropic’s population-adjusted AI Usage Index. On that measure, the District of Columbia leads at 3.82, with Utah close behind at 3.78. After that come California at 2.13, New York at 1.58, and Virginia at 1.57. In plain English, Claude is not just big in the obvious places. It is unusually concentrated in a few knowledge-heavy, white-collar markets.
Anthropic also makes a broader point that helps explain the map: within the U.S., each 1% increase in state GDP per capita is associated with a 1.8% increase in Claude’s usage index, but income alone explains less than half the variation. The rest seems to come from the shape of the local economy itself. That’s why Utah can punch above its size and why DC can beat California on a per-capita basis.
| Claude measure | Leading states |
| Raw U.S. usage share | California, New York, Texas, Virginia |
| Per-capita usage index | DC, Utah, California, New York, Virginia |
| Highest U.S. AUI values named by Anthropic | DC 3.82, Utah 3.78, California 2.13, New York 1.58, Virginia 1.57 |
Table summary compiled from Anthropic’s Economic Index and report.
What people are actually doing with Claude in those places
Claude’s state data gets even more useful when you look at task mix. Anthropic says software engineering remains the most common use in every state, but the overrepresented tasks change by local economy. In DC, Claude users over-index on document editing, information provision, and job applications. In California, the overrepresented requests are IT-related help, digital marketing, and translation. In Florida, Anthropic sees heavier use around business advice and fitness.
That makes Claude’s U.S. map feel less like a popularity contest and more like a labor-market signal. Anthropic even notes that the highest-use states are not necessarily the ones where coding dominates most. Mature adoption tends to bring more diverse use across education, science, business operations, admin work, and writing.
This also helps explain why Claude feels especially strong in serious work settings. Similarweb’s August 2025 analysis still showed ChatGPT as the overall web and app leader, but Claude stood out as the fastest-growing major AI site that month, with roughly 18.7% month-over-month website traffic growth. In short: Claude is smaller than ChatGPT, but it is punching hard in high-intent, knowledge-heavy use cases.
| State | Claude pattern highlighted in public data |
| DC | Document editing, information help, job applications |
| Utah | Very high per-capita adoption intensity |
| California | IT requests, digital marketing, translation |
| New York | Strong finance-related task profile in Anthropic’s summaries |
| Florida | Business advice and fitness over-index |
Table summary based on Anthropic’s published state analysis.
Gemini State Wise Analysis: What We Can Say, and What We Can’t
Gemini is massive, but Google hasn’t published a state leaderboard
This is the part where a lot of articles start making things up. Google has shared big Gemini milestones, but it has not published a simple public ranking of the top U.S. states using Gemini. So any clean “top five Gemini states” list you see online should be treated carefully unless the source shows its methodology plainly.
What Google has shared is still important. At I/O 2025, Google said the Gemini app had over 400 million monthly active users. Google also said AI Overviews scaled to 1.5 billion monthly users in 200 countries and territories, which matters because Google’s AI footprint is far bigger than the standalone Gemini app alone. On top of that, the Gemini web app is available in more than 70 languages and over 230 countries and territories.
The U.S. signal is strong even without a state chart. Menlo Ventures found that 23% of Americans had used Gemini in the past six months. Similarweb’s August 2025 data showed 723.3 million Gemini visits, 47.56 million app MAUs, and more app downloads than ChatGPT that month, though Gemini’s daily stickiness was much lower. A separate 2025 Gemini stats roundup using Similarweb data also said the United States was Gemini’s top traffic source in October 2025.
| Gemini public signal | What it tells us | Limitation |
| 400M+ monthly active users | Gemini has real scale | Not broken out by state |
| 23% of Americans used it in past six months | Strong U.S. consumer penetration | Survey-based, not state-level |
| U.S. is top traffic source | America is a core Gemini market | Country-level, not state-level |
| 50-state Google Workspace campaign | Gemini use cases exist nationwide | Marketing signal, not usage ranking |
Table summary compiled from Google, Menlo Ventures, and Similarweb-based reporting.
The best state-level read on Gemini is indirect
So what’s the practical takeaway? Gemini likely runs strongest in places where Google already owns the workflow: Android phones, Gmail, Docs, Sheets, Meet, Chrome, and Search. That makes its adoption feel less concentrated around a handful of “AI states” and more distributed through daily habits, school accounts, and business tools. Google’s own “50 states, 50 stories” Workspace campaign leaned into exactly that idea, showing Gemini use cases in one business from every state.
That doesn’t mean Gemini is winning everywhere. Similarweb’s numbers still showed ChatGPT far ahead in app MAUs and overall usage intensity, even though Gemini had impressive download momentum. But it does mean Google has a different kind of advantage: built-in distribution. Gemini doesn’t need to win the “open a separate AI app” battle in every state if it keeps showing up inside products people already use.
If you need a clean answer to where Americans use Claude AI, ChatGPT, and Gemini the most, the honest line is this: ChatGPT and Claude have named state leaders in public data; Gemini has broad U.S. adoption and giant distribution, but no official public state ranking yet.
Comparing the State-Wise Patterns Across the Three AI Assistants
The map is starting to show clear regional personalities
Put the three datasets together and a pattern starts to show. California and New York keep popping up because they are large, high-income, knowledge-heavy markets. Virginia and DC matter because government, contracting, education, and white-collar work create dense demand for writing, search, admin, and research tasks. Utah stands out because it overperforms on per-capita AI use in both OpenAI’s student narrative and Anthropic’s Claude index.
ChatGPT’s public state signal is more youth- and education-heavy. Claude’s public state signal is more work- and economy-heavy. Gemini’s signal is more distribution-heavy, tied to Google’s ecosystem and default placement across products. None of those pictures cancel each other out. They describe different doors into the same AI market.
And the national mood backs this up. Menlo says 61% of American adults have used AI in the past six months. Elon University’s survey found 52% of U.S. adults use LLMs like ChatGPT, Gemini, Claude, and Copilot. This is no longer a niche story. The real question now is less “are people using AI?” and more “which assistant fits the way a state learns, works, and searches?”
| Region or state type | Tool that looks strongest publicly | Why |
| Big coastal knowledge hubs | ChatGPT and Claude | Scale, students, white-collar work |
| DC and policy-heavy markets | Claude | Strong document and information workflows |
| Student-heavy fast adopters | ChatGPT | Strong 18–24 adoption signal |
| Google-first everyday users | Gemini | Embedded across Search, Android, Workspace |
| Broad national general-use market | ChatGPT | Strongest default assistant behavior |
Table summary based on the combined public datasets discussed above.
The real drivers behind the map
Three forces seem to matter most. First, age and education: younger and more educated Americans are still the fastest adopters of general AI tools. Second, economic structure: states with more knowledge work, admin work, technical work, and research intensity produce heavier assistant usage. Third, distribution: the tool that shows up where people already work has a major edge.
That’s why ChatGPT leads where general-purpose use is already normalized. It’s why Claude over-indexes in places where writing, research, and technical workflows are dense. And it’s why Gemini can feel bigger than its standalone state data suggests: it rides on the back of Google Search, Gmail, Android, Chrome, and Workspace.
What Publishers, Marketers, Schools, and Employers Should Do With This
If your audience leans ChatGPT-heavy
If you publish for students, young professionals, or general consumers, ChatGPT should still be your starting point. The strongest public ChatGPT state signals cluster around early adoption, learning, writing, and work. Content that wins here tends to be practical: explainers, templates, study help, how-tos, comparisons, and task-based workflows. That lines up with both OpenAI’s use-case data and Pew’s work-and-learning survey results.
If your audience is more Claude- or Gemini-shaped
Claude-heavy markets look like places where people want serious help doing serious work. That means long-form research, coding support, editing, document workflows, and information-heavy tasks. Gemini-heavy audiences are a little different. They are easier to reach through Google-native contexts: Search visibility, Workspace use cases, Android habits, and business productivity content.
The practical play is not to bet on one assistant only. It’s to match the content to the audience. ChatGPT is still the broadest general front door. Claude has real pull in high-intent work settings. Gemini benefits from default distribution at massive scale. That means publishers and brands should think in terms of user context, not brand loyalty alone.
| Audience | Best content angle | Why it fits |
| Students and early-career readers | Guides, study content, writing help | Strong ChatGPT education footprint |
| Technical and knowledge workers | Research, editing, coding workflows | Strong Claude task profile |
| Small businesses and Google-native teams | Workspace, Gmail, Docs, Search workflows | Gemini distribution advantage |
| Broad consumer audience | Simple task-based AI use cases | General assistants still dominate |
This table turns the public usage signals into editorial and content strategy.
Final Thoughts
The cleanest takeaway from this where Americans use Claude AI, ChatGPT, and Gemini the most analysis is that the U.S. AI map is already splitting into distinct lanes. ChatGPT looks strongest where general-purpose use, student adoption, and early-career workflows are already normal. Claude looks strongest where knowledge work is dense and task intensity matters more than pure scale. Gemini has national reach and huge built-in distribution, but its public state map is still less transparent than the other two.
So the real winner is not one tool in every state. It’s the tool that fits the local habit. That’s the part many flashy “state-wise analysis” posts miss. The better question is not just where Americans use AI the most, but how they use it once it becomes part of work, school, search, and daily life. And on that front, the map is only getting more interesting.
FAQs on OpenAI, Anthropic, Google, Pew, Menlo, and Similarweb-backed reporting
Is ChatGPT still the most-used AI assistant in America?
Based on the public numbers in hand, yes. Pew says 34% of U.S. adults have used ChatGPT, Menlo says 28% of Americans used it in the past six months, and Similarweb still shows ChatGPT far ahead of major rivals in visits and app MAUs.
Why doesn’t Gemini have a clean top-state list yet?
Because Google has shared scale and product reach, not a public state breakdown. We know Gemini is large, nationally distributed, and deeply embedded in Google products, but Google has not publicly released a 50-state ranking comparable to Anthropic’s Claude index or OpenAI’s student map.
Why is Claude so strong in DC and Utah?
Anthropic’s explanation is that local economic structure matters. DC’s mix of document-heavy, information-heavy, white-collar work helps it over-index. Utah’s high per-capita intensity suggests a smaller but unusually active user base rather than sheer population size.
Are app downloads the same thing as actual adoption?
No. Gemini, for example, can post strong download numbers and still trail ChatGPT badly on monthly active users and daily stickiness. Downloads are interest. Habit is something else.
Which AI assistant has the strongest student footprint in the U.S.?
Publicly, ChatGPT has the clearest student footprint. OpenAI’s report directly measures state-by-state logged-in usage among 18–24-year-olds and ties a large share of their activity to learning and education tasks.