Rolling blackouts used to dictate exactly how millions of people lived and worked in South Africa. If you ran a business or lived there just a few years ago, you knew the stressful routine perfectly. Diesel generators roared loudly outside restaurants, expensive inverter batteries beeped constantly in homes, and massive factory production lines simply stopped halfway through the day. But the situation changed completely, and it happened much faster than anyone anticipated. Driven by pure economic survival, South Africa renewable energy capacity expanded at a breakneck speed that shocked global analysts.
The national grid stopped relying entirely on a single, struggling state-owned utility and pivoted hard toward a decentralized, reliable power model. Private companies and everyday homeowners took the power supply into their own hands. Let us break down exactly how this dramatic transformation happened, look at the hard numbers driving the change, and explore why this massive shift matters for the future of the entire African continent.
The Dawn of a New Era in the South African Energy Sector
For well over a decade, Eskom fought a losing battle to keep the country illuminated with a deteriorating fleet of old coal-fired power stations. Constant, scheduled power cuts hit the local economy incredibly hard, shrinking annual growth and frustrating everyday citizens who just wanted to keep their refrigerators running. The crisis reached a boiling point that eventually forced the national government to strip away the complex red tape surrounding private power generation. What followed right after was an absolute boom in solar and wind projects across all nine provinces. Today, the nation stands as a masterclass in rapid energy transition, moving swiftly away from a centralized point of failure.
17 Surprising Facts About South Africa’s Renewable Energy and Grid Recovery
The sheer speed at which the country added brand new power sources caught global market analysts completely off guard. Massive commercial farms, heavy industrial factories, and regular households poured billions of rands into their own off-grid solutions. This aggressive expansion of South Africa renewable energy capacity gave Eskom the critical breathing room it desperately needed to fix broken plants. Let us look at the detailed statistical milestones, physical infrastructure changes, and strategic market shifts that cured the national energy deficit.
1: A 4,000MW Drop in Grid Demand Equals Permanent Stage 4 Relief
One of the absolute biggest developments in fixing the national grid was the massive, permanent drop in daytime demand placed on Eskom. Between 2022 and early 2026, the average hourly electricity demand on the entire network dropped by roughly 4,000 megawatts. Historically, the utility had to implement severe Stage 4 load-shedding just to shed exactly that amount of demand from the system to prevent a total collapse.
This sudden drop did not happen because the economy shrank or factories closed their doors. Heavy electricity users transitioned completely to self-generation. Massive mining operations, car manufacturing plants, and giant commercial shopping malls simply moved off the national grid during peak daylight hours. They generated their own power, leaving enough state power for everyone else.
| Demand Metric | Pre-Crisis Level | Current Level | Grid Impact |
| Avg. Midday Demand | ~28,000 MW | ~24,000 MW | Massive reduction in baseline strain |
| Primary Demand Driver | Grid-reliant industry | Self-generating industry | Allowed daytime plant maintenance |
| Load-Shedding Equivalent | Stage 4 required | No load-shedding needed | Saved billions in economic losses |
2: Private Capacity Registrations Hit a Staggering 18,000MW
When the South African government finally decided to lift the bureaucratic licensing threshold for private power generation, it instantly opened the floodgates for independent investment. Within a few short years, the national energy regulator quickly processed and registered a staggering 18,000 megawatts of generation capacity strictly from private commercial projects.
These new installations were primarily massive, large-scale solar arrays built by private mining conglomerates and tech companies looking to secure their own operational certainty. Because the country geographically enjoys some of the best, most intense solar radiation levels on the planet, these independent plants deliver massive energy yields. They fundamentally altered the national energy mix without needing a single cent of taxpayer funding or government bailouts.
| Registration Data | 2021-2022 | 2023-2025 | Primary Source Type |
| Total MW Registered | ~2,500 MW | ~18,000 MW | Utility-Scale Solar PV |
| Licensing Threshold | Capped at 1 MW | Cap completely removed | Wind & Battery Storage |
| Funding Source | State/Debt | 100% Private Equity | Corporate PPAs |
3: Rooftop Solar Tripled in Just Four Years
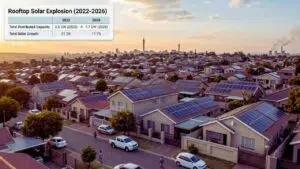
While industrial corporate giants built massive solar farms out in the dry Northern Cape desert, everyday citizens transformed their suburban rooftops into mini power plants. Driven by the deep, exhausting frustration of daily power cuts and dropping global equipment prices, rooftop solar adoption exploded in major cities like Johannesburg, Pretoria, and Cape Town.
Domestic rooftop solar accounted for roughly 2.5 gigawatts of power just a few years ago, but that figure recently skyrocketed to nearly 7.7 gigawatts. The power generated by regular households right now essentially equals the total maximum output of two massive traditional coal-fired power stations. Neighborhoods that used to go dark every evening now generate, store, and consume their own clean energy seamlessly.
| Rooftop Solar Growth | 2022 Capacity | 2026 Capacity | Equivalent Output |
| Residential Sector | ~1.5 GW | ~4.5 GW | One large coal station |
| Commercial Sector | ~1.0 GW | ~3.2 GW | One medium coal station |
| Total Distributed | ~2.5 GW | ~7.7 GW | Massive grid relief |
4: Over 340 Consecutive Days Without Load-Shedding
The most visible, celebrated sign of recovery for the average citizen on the street is the total end of scheduled rolling blackouts. Eskom recently achieved over 340 consecutive days without turning off the national power supply. This incredible milestone was practically unthinkable back in 2023 when the country suffered through a devastating 330 days of outages in a single calendar year.
The return to a highly stable supply allowed small businesses to finally throw away their noisy, expensive diesel generators. It brought immense financial relief to residential neighborhoods across the entire country, allowing restaurants to keep food cold and schools to keep their lights on. This single streak of stability restored a massive amount of consumer confidence.
| Outage Statistics | 2023 Worst Period | 2025-2026 Period | Economic Result |
| Days with Outages | 330 Days | 0 Days | Boost in consumer spending |
| Worst Stage Reached | Stage 6 (6,000MW shed) | No shedding required | Manufacturing recovery |
| Backup Power Cost | Extremely High | Minimal/Zero | Improved profit margins |
5: The Energy Availability Factor Reached the 70 Percent Milestone
You measure a power utility’s true operational health by its Energy Availability Factor (EAF), which tracks the exact percentage of time its power plants are online and actually producing electricity. During the absolute worst, darkest days of the crisis, this critical metric crashed down to a dismal 54 percent. But following a strict internal recovery plan and aggressive maintenance schedules, plant reliability began to climb steadily upward.
The overall fleet availability recently recovered well past 65 percent. The generation fleet even successfully crossed the highly coveted 70 percent threshold on dozens of occasions during the summer months. Hitting that 70 percent mark means the old coal machines are running smoothly again, providing a solid baseline of power for the night hours.
| EAF Progression | Crisis Low Point | Recovery Target | Current Performance |
| Average Fleet EAF | ~54% | 65% | Frequently hits 65-70% |
| Impact on Grid | Severe deficits | Balanced grid | Surplus during off-peak |
| Maintenance Approach | Reactive/Emergency | Proactive/Scheduled | Highly stable output |
6: Unplanned Power Plant Outages Were Slashed by 7.1GW
Sudden, catastrophic breakdowns of old power generation units caused most of the severe historical blackouts that crippled the nation. At the absolute peak of the crisis, unplanned breakdowns regularly stripped over 16 gigawatts of power from the grid all at once, throwing the control room into total chaos. Engineers managed to reduce these unexpected losses dramatically by sticking strictly to scheduled, preventative maintenance plans.
The volume of unexpected breakdowns was slashed by more than 7.1 gigawatts in a very short time. This represented a massive, critical recovery of baseline capacity that keeps the lights on reliably when the sun goes down and solar panels stop working. The fleet is simply breaking down much less often than before.
| Outage Breakdown | 2023 Average | 2026 Average | Improvement Achieved |
| Unplanned Outages | ~16,000 MW | ~8,900 MW | Recovered 7,100 MW |
| Planned Maintenance | ~3,000 MW | ~5,500 MW | Increased proactive care |
| Grid Status | Highly Volatile | Predictable | Safe operating margins |
7: Billions of Rands Saved on Diesel Consumption
Eskom used to rely heavily on emergency Open Cycle Gas Turbines (OCGTs) to keep the lights on during the busy, high-demand evening peak hours. These massive turbines burn vast amounts of highly expensive diesel fuel, which cost the government tens of billions of rands every single year just to avoid higher stages of load-shedding.
Because plant reliability improved and private solar lowered daytime demand so much, the need to run these expensive emergency turbines dropped remarkably fast. Financial reports show diesel savings easily exceeding 26 billion rand over the last few financial quarters. The utility smartly redirects those saved funds directly toward paying off historical debt and fixing neglected transmission lines.
| Diesel Usage Data | Crisis Spending | Post-Crisis Spending | Primary Use Today |
| Annual Fuel Cost | R30+ Billion | Under R4 Billion | Strict emergency backup only |
| Turbine Usage Rate | Daily running | Rare/Intermittent | Grid frequency stabilization |
| Financial Impact | Drained state funds | Massive cash savings | Reinvested into grid expansion |
8: A 13GW Private Project Pipeline by 2029
The incredible momentum of private clean energy investment shows absolutely no signs of slowing down anytime soon. Financial analysts and civil engineers tracking the local market note that developers plan to bring an additional 13 gigawatts of private generation capacity strictly online by the year 2029.
These massive upcoming projects include giant wind farms along the windy Eastern Cape coastlines, massive solar arrays in the dry Karoo region, and heavy-duty battery storage facilities. This long, well-funded project pipeline ensures the total energy pool will keep growing totally independently of state construction timelines. It essentially guarantees that power supply will outpace future economic demand for the next decade.
| Project Pipeline | Tech Type | Expected Capacity | Timeline to Completion |
| Utility Solar PV | Solar | ~7.0 GW | 2026-2028 |
| Onshore Wind | Wind | ~4.5 GW | 2027-2029 |
| Battery Storage | BESS | ~1.5 GW | 2026-2029 |
9: Offsetting 8GW of Retiring Coal Power Stations
The massive rush of alternative energy sources arrived just in time to stop another completely different disaster from happening. Several of the oldest, dirtiest coal-fired power stations in the country are reaching their strict, mandatory retirement dates right now. Approximately 8 gigawatts of legacy coal capacity will shut down permanently and safely before the end of the decade because the machines are simply too old to fix.
The rapid expansion of private solar and wind farms is perfectly timed to replace this specific lost power watt for watt. It prevents the country from slipping backward into another terrible era of supply deficits while smoothly transitioning away from heavy fossil fuels.
| Retiring Stations | Status | Retiring Capacity | Replacement Strategy |
| Komati Power Station | Decommissioned | 1,000 MW | Solar & Battery repurposing |
| Hendrina & Camden | Phasing out | ~3,500 MW | Private wind/solar offsets |
| Grootvlei | Scheduled closure | ~1,200 MW | Just Energy Transition plans |
10: Lower Costs Driven by Mega Solar Installations
Simple economies of scale made self-generation highly, undeniably profitable for heavy industries across the country. As corporate consortiums and large mining houses build mega solar installations, the effective price they pay per unit of electricity drops incredibly fast. For deep-level gold, platinum, and diamond mines that consume massive, continuous amounts of power, making their own electricity via solar is now substantially cheaper than buying it directly from Eskom.
This pure, undeniable cost efficiency drives even faster adoption across the commercial sector. Companies are not just doing this to be green; they are doing it because it heavily protects their bottom-line profits from annual municipal tariff hikes.
| Cost Comparison | Source Type | Cost Trend | Business Benefit |
| Eskom Grid Power | Coal/Nuclear | Rises 10-15% annually | Subject to heavy price shocks |
| Private Solar PV | Renewable | Drops continuously | Locked-in, predictable costs |
| Corporate PPA | Mixed Green | Highly competitive | Massive long-term savings |
11: 600,000 Smart Meters Installed to Combat Illegal Connections
National generation capacity looks fantastic today, but local street-level infrastructure still struggles heavily with illegal wiring and dangerously bypassed meters. These local power overloads make street-corner transformers explode violently, leaving entire neighborhoods completely in the dark for days while waiting for repairs.
The utility launched a massive, aggressive modernization drive to stop this exact issue. They successfully installed over 600,000 smart meters across highly vulnerable municipalities. These brilliant digital devices let control room technicians manage local power loads remotely and instantly cut off illegal taps before the physical hardware heats up and burns down.
| Smart Infrastructure | Previous Problem | Smart Solution | Impact on Community |
| Mechanical Meters | Easily bypassed/stolen | Anti-tamper smart tech | Accurate billing restored |
| Transformer Health | Frequent explosive failures | Remote load limiting | Massive drop in replacement costs |
| Grid Visibility | Blind to local faults | Real-time data tracking | Faster repair response times |
12: The Phasing Out of Localized Load Reduction
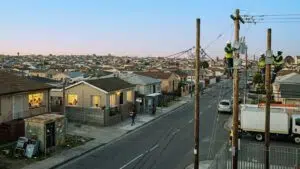
Load reduction is a highly localized, highly frustrating strategy used to cut power to specific neighborhoods where electricity theft heavily threatens to destroy local transformers. It is very different from national load-shedding but equally annoying for the honest people who actually pay their utility bills in those specific areas.
Thankfully, the new smart meter rollouts and local grid wire upgrades are aggressively phasing out this practice. Several large provinces recently stopped their load reduction schedules entirely. This change gave hundreds of thousands of households their reliable, uninterrupted power back, restoring normal daily routines in densely populated urban townships.
| Load Reduction Data | Mechanism | Historical Frequency | Current Status |
| Purpose | Prevent local fire/damage | Daily during winter peaks | Heavily reduced |
| Targeting | High-theft neighborhoods | Broad block outages | Pinpointed smart-cuts |
| Resolution | Upgrading mini-substations | Slow physical fixes | Automated grid protection |
13: Distributed Energy Resources Are Strengthening Local Grids
The entire electrical network is becoming wonderfully decentralized right before our eyes. Instead of relying entirely on massive coal plants located hundreds of kilometers away in a single province, the country is plugging thousands of smaller energy resources directly into local municipal grids. This local injection of clean power helps stabilize dangerous voltage drops at the very end of long, rural transmission lines.
It essentially creates safe micro-environments of energy security. This means rural farming towns and remote industrial parks experience far fewer localized faults and electrical dips than they did just five years ago, protecting sensitive electronic equipment from damage.
| Grid Architecture | Pre-2023 Structure | Modern Structure | Reliability Impact |
| Generation Location | Highly centralized (Mpumalanga) | Highly distributed (Nationwide) | Lower transmission losses |
| Voltage Stability | Weak at line-ends | Supported locally by solar | High power quality |
| Failure Risk | Single massive points of failure | Multiple redundant sources | Highly resilient networks |
14: GDP Growth Recovers from Severe Outage Losses
You simply cannot overstate the devastating economic damage caused by unreliable electricity. Leading economic models proved beyond a doubt that rolling blackouts wiped billions of rands and full percentage points off the national GDP during the worst crisis years. Factories completely missed international shipping orders, agricultural packhouses let tons of fresh food rot, and small corner shops went bankrupt buying expensive diesel.
The full restoration of grid stability essentially erased these heavy economic constraints. Local businesses can finally forecast their earnings accurately, hire new permanent staff, and expand their daily operations with total confidence once again.
| Economic Metrics | Crisis Impact (2023) | Recovery Impact (2026) | Long-Term Outlook |
| GDP Growth Penalty | -1.5% to -2.0% annually | Penalty fully erased | Steady upward trajectory |
| Business Confidence | Historic all-time lows | Rapidly climbing | High investment appetite |
| SME Survival Rate | Heavily compromised | Stabilized and growing | Returning to profitability |
15: The Unintended Consequence of Lower Carbon Emissions
Most business owners installed solar panels just to keep their lights on, not to save the planet or win environmental awards. Basic energy security was the real, undeniable driving force. But the sheer volume of green capacity added to the grid had a huge, highly positive impact on national greenhouse emissions anyway.
Because solar panels carry the absolute heaviest load during the bright midday hours, Eskom can safely idle some of its dirtiest, most polluting coal units during the day. This operational shift caused a measurable, massive drop in localized air pollution and heavily improved the country’s international climate standing with global trade partners.
| Emissions Impact | Pre-Solar Boom | Post-Solar Boom | Environmental Benefit |
| Midday Coal Usage | Pushed to maximum limits | Throttled down significantly | Lower daily CO2 output |
| Air Quality Index | Poor near power stations | Measurable improvement | Reduced respiratory issues |
| Climate Goals | Missing COP targets | Re-aligning with targets | Better global trade optics |
16: A Massive Surge in Green Economy Jobs
Importing, transporting, installing, and fixing thousands of megawatts of solar equipment created a booming, highly lucrative new economic sector practically overnight. Thousands of high-paying jobs opened up immediately for local electricians, roofers, warehouse logistics coordinators, and corporate sales teams.
Technical training programs for renewable energy installers became highly sought after by high school graduates looking for secure careers. This green boom provided a vital, incredibly important employment lifeline in a developing country that historically struggles heavily with terrible youth unemployment rates.
| Job Creation Area | Skill Level Required | Employment Trend | Economic Value |
| Panel Installation | Entry to Mid-Level | Explosive growth | Grassroots income generation |
| Grid Engineering | Highly Specialized | High demand/Shortage | Brain-drain reversal |
| Maintenance & Tech | Mid-Level | Steady, long-term growth | Sustainable career paths |
17: The Creation and Strategy of Eskom Green
Eskom executives realized very quickly that they were losing their highest-paying commercial and industrial customers to independent solar developers. The state utility rapidly adapted its corporate strategy to survive the changing market. They launched a division called Eskom Green to pivot directly away from defending a dying coal monopoly.
They are now actively playing and competing in the renewable market. The utility smartly uses its own vast tracts of empty land around existing high-voltage substations to build massive, state-owned clean generation facilities. They absolutely have to do this to remain financially viable and competitive in a newly modernized electricity landscape.
| Eskom Strategy | Legacy Approach | Modern Pivot (Eskom Green) | Future Goal |
| Primary Focus | Protect coal monopoly | Build state renewables | Mixed-portfolio utility |
| Land Utilization | Coal ash dumping | Solar arrays near grid ties | Maximize existing grid access |
| Market Position | Sole provider | Major market competitor | Financial self-sufficiency |
Why Private Solar Adoption Changed the Game?
To truly grasp how South Africa fixed its broken grid, you have to look closely at when people actually use electricity during the day. The national demand profile spikes incredibly hard in the early mornings when millions of people boil kettles, run geysers, and shower before work. It spikes again aggressively in the late evenings when people cook dinner and turn on electric heaters. But the demand during the middle of the day is relatively flat, consistent, and predictable.
When big businesses and rich households bought billions of rands worth of solar equipment, they essentially unplugged themselves entirely from the Eskom grid from sunrise to sunset. Massive solar arrays hit their maximum peak output perfectly when the sun is highest in the sky. This cleanly and quietly covers the heavy daytime energy needs of giant office parks, sprawling shopping centers, and massive manufacturing factories without touching a single drop of state power.
This daylight exodus gave Eskom engineers a massive daily operational buffer they never had before. Instead of running broken coal plants at absolute maximum capacity around the clock just to meet baseline daytime demand, they finally got the physical space to take generation units offline for real, deep maintenance. Furthermore, the excess generation capacity available during the bright days allowed the utility to efficiently pump water back up into its massive hydroelectric storage dams. They ensure those mountain dams are totally full and ready to generate massive power the moment the sun goes down and the tricky evening peak begins.
The Future of Electricity in South Africa
The devastating load-shedding crisis practically forced South Africa to modernize its physical infrastructure at a rapid pace the government could never have managed alone. The future of electricity here is now definitively, permanently hybrid. Nobody expects a return to a single, sluggish state entity controlling every single watt of power in the country. The era of the absolute state energy monopoly is dead and buried.
The landscape is now defined completely by a highly competitive, fast-moving diversified market. The national utility will still play a big, important role in providing the heavy baseline stability required for nighttime consumption and dark, cloudy days. They will keep using their best, most reliable coal, nuclear, and pumped hydroelectric assets to anchor the grid. But independent power producers will gladly take over a much bigger, highly profitable slice of the total energy pie going forward.
The very next major technological hurdle for the country is grid-scale battery storage. Because South Africa renewable energy capacity keeps growing so fast, the country now generates a heavy surplus of electricity during midday hours. Capturing that cheap, totally abundant solar energy in massive grid-scale battery parks and releasing it smoothly during the evening peaks is the ultimate goal. Investment in large battery infrastructure is accelerating right now, setting up a highly resilient, low-carbon future for the whole southern region.
Final Thoughts
The incredible transformation of the national grid stands as one of the most impressive infrastructural comebacks in recent global history. A developing country severely crippled by daily power cuts managed to completely rewrite its energy rulebook in under five short years. The rapid, aggressive scaling of South Africa renewable energy capacity proved beyond a doubt that when the private sector and sensible government deregulation align, massive problems get solved fast.
Eskom found the critical breathing room it needed to fix its failing coal fleet, while businesses eagerly took full control of their own power supply. The lights are finally back on, the economy is moving forward again, and the future looks remarkably bright.
Frequently Asked Questions (FAQs) About South Africa Renewable Energy Capacity
Are lithium-ion batteries environmentally safe in South Africa?
With millions of heavy batteries installed in homes and businesses, end-of-life disposal is a growing concern. South Africa currently exports many dead batteries for international recycling, but local e-waste recycling plants are quickly expanding to handle the influx of lithium-ion waste safely right here at home.
How does the wheeling framework operate in South African municipalities?
Wheeling allows a private solar farm situated in a sunny province to sell electricity directly to a factory located in a completely different province. They use the state-owned grid to transport the power, and the seller pays Eskom or the local municipality a small, regulated fee to use their transmission lines.
Can tenants benefit from rooftop solar in South Africa?
Yes, property developers and commercial landlords increasingly install large solar systems on their roofs and sell the generated power back to their tenants at rates slightly cheaper than the standard municipal tariff. This smart move creates a secondary revenue stream for the landlord and instant energy security for the tenant.
What happens to old solar panels in South Africa?
Solar panels degrade very slowly over 20 to 25 years. While the local consumer market is still quite young and panels are mostly brand new, specialized recycling companies are already setting up advanced operations in Johannesburg and Cape Town. They aim to easily recover the valuable glass, aluminum, and silver from damaged or aged panels.
Does weather affect the national grid differently now?
Yes, absolutely. Because the grid now relies heavily on private solar output, a long week of severe overcast weather across the entire country can noticeably increase the demand placed right back onto Eskom. However, improved coal fleet reliability and massive pumped hydro storage reserves currently manage these sudden weather-related fluctuations very smoothly.