
Your website loads slowly, and visitors bounce away fast. You feel frustrated, right? Like trying to catch a bus that never stops. This hurts your user experience and SEO rankings.
Many site owners face this daily grind. Core Web Vitals measure how well your page performs, focusing on speed, responsiveness, and visual stability. They tie directly to Google Search results.
Did you know Interaction to Next Paint, or INP, replaced First Input Delay in March 2024? It checks delays between clicks and page updates. This blog post guides you through optimizing Largest Contentful Paint, Cumulative Layout Shift, and more.
You’ll learn tools like Google PageSpeed Insights and Chrome DevTools for real fixes. Picture your site as a smooth ride, not a bumpy road. Ready to boost your web performance?
What Are Core Web Vitals?
Picture your website as a busy storefront, where folks expect quick service and no surprises. Core Web Vitals act like Google’s scorecard for page experience, tracking performance metrics that make sites load fast, respond smoothly, and stay steady, so you keep users coming back for more.
Largest Contentful Paint (LCP)
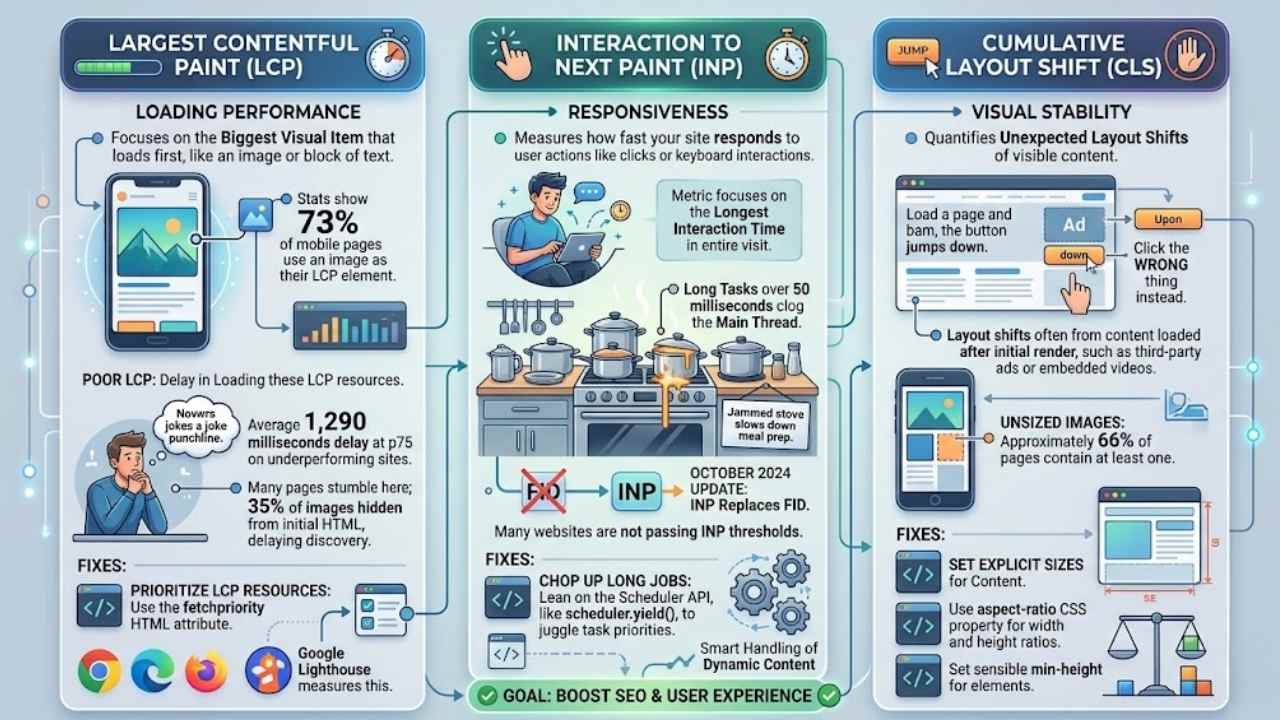
Largest Contentful Paint, or LCP, tracks loading performance of a webpage as a key performance metric in Core Web Vitals. It focuses on the biggest visual item that loads first, like an image or block of text.
You know, that hero image that grabs attention right away? Well, stats show 73% of mobile pages use an image as their LCP element. Poor LCP pages spend less than 10% of their p75 LCP time downloading that key image, which hurts page experience and SEO.
Delays in loading these LCP images average 1,290 milliseconds at the 75th percentile on those underperforming sites. Ouch, that’s like waiting an extra beat too long for the punchline in a joke.
Many pages stumble here; 35% of images stay hidden from the initial HTML response in sites with images as LCP. Plus, 15% of eligible pages delay discovering LCP images, which tanks loading performance and user engagement.
If your site is like a stage and the main act shows up late, visitors might just walk out. To fix this, browsers like Chrome version 102, Edge version 102, and Firefox version 132 now support the fetchpriority HTML attribute for prioritizing LCP resources.
Tools from Google Search Central, such as Google Lighthouse, help measure this. But watch out: if a page holds off on images until CSS or JavaScript fully loads, good LCP slips away, per performance best practices on web.dev.
Interaction to Next Paint (INP)
Interaction to Next Paint, or INP, measures how fast your site responds to user actions, like clicks or keyboard interactions during browsing. This metric focuses on the longest interaction time spotted in a user’s entire visit.
Sites often fail INP thresholds for solid user experiences, especially when stacked against the now-deprecated First Input Delay, or FID. Picture your page as a busy chef in a kitchen; long tasks over 50 milliseconds clog the main thread, much like a jammed stove slows down meal prep.
These tasks include rendering, layout, and parsing work by the browser. They hurt responsiveness, leaving visitors frustrated, you know?
Many websites are not passing INP thresholds for good user experiences, particularly compared to its deprecated predecessor First Input Delay (FID).
October 2024 brought big shifts with INP taking priority over FID in SEO and technical SEO circles. Google reversed advice on using the isInputPending API to split long tasks. Instead, lean on the Scheduler API, like scheduler.yield(), to juggle task priorities and chop up those lengthy jobs.
Tools such as Google Search Console and Chrome DevTools help track this. Dynamic content demands smart handling to boost interactivity. Widespread flops in meeting INP baselines open doors for website performance optimization, even in e-commerce setups with edge compute or managed CDN support.
Cumulative Layout Shift (CLS)
CLS measures visual stability. It quantifies unexpected layout shifts of visible content. Think of it like this, you load a page and spot a button you want to click. But bam, the button jumps down because an ad pops in above it.
You end up clicking the wrong thing instead. CLS considers any movement of visible elements between frames. Layout shifts often come from content that loads after the initial page render, such as third-party ads or embedded videos.
Approximately 66% of pages contain at least one unsized image, which boosts these issues for seo and user experience.
Set explicit sizes for any content loaded on the page to prevent layout shifts. This acts as the main strategy to boost stability. You can use the aspect-ratio property, a CSS feature that helps set explicit width and height ratios for images and non-image elements.
It improves layout stability across the board. Plus, setting a sensible min-height for elements cuts down on those pesky shifts. Tools like Google Search Console and Chrome DevTools help you track CLS metrics, tying into broader crawling and indexing efforts.
How to Optimize Largest Contentful Paint (LCP)
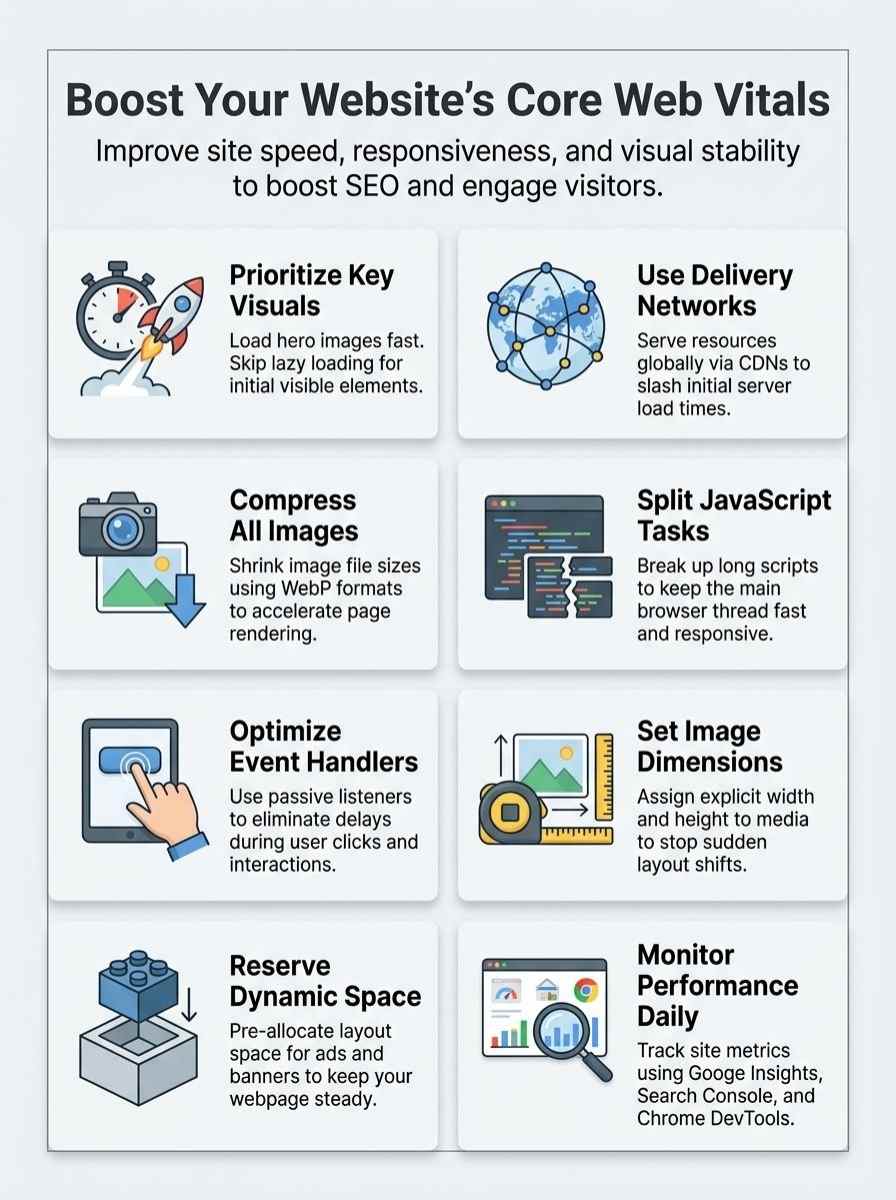
Speed up your site’s main content load, and watch visitors stick around longer, like glue on a hot day. Grab a content delivery network to serve images fast, then compress those files with an image optimizer to cut wait times short.
Prioritize key visual elements
You know, prioritizing key visual elements can make your website load like a rocket, boosting that all-important Largest Contentful Paint score for better SEO. It’s like giving your hero image the VIP treatment, so visitors stick around instead of bouncing.
- Load your main images with the standard
element and src or srcset attributes to keep things speedy, ditching those clunky data-src options that rely on JavaScript and slow down the show; after all, stats show about 7% of pages still use data-src for their LCP images, which is a missed opportunity for faster content delivery via a CDN like Fastly edge cloud platform.
- Add the fetchpriority=”high” attribute right to your
tag or a for the LCP image, cranking up its loading priority with minimal fuss; this simple tweak lets it grab more bandwidth, slashing load times and improving user experience, much like how image optimizer tools handle compression on the fly.
- Ditch the loading=”lazy” attribute on that key LCP image to skip any viewport delays that could drag things out; think of it as removing a speed bump, ensuring your site feels snappy from the get-go, and pair this with structured data for even better Googlebot crawling.
- If your image hides in external CSS or JS, bring it front and center in the HTML with a tag to help the browser spot it early; otherwise, inline styles block the preload scanner, leaving your visuals in the dust, so optimize like you would with meta tags or sitemaps for top-notch performance.
- Reprioritize that LCP image to cut its load duration, freeing up bandwidth for a quicker finish; it’s an easy win that boosts total site speed, especially when you layer in tools like Google Analytics to track improvements or even TLS encryption for secure, fast transfers.
- Use the fetchpriority HTML attribute on resources tied to LCP for a quick priority boost, making a real difference with little effort; imagine it as assigning a fast lane in traffic, and combine this with HTTP/3 and QUIC protocols to supercharge your ecommerce site’s responsiveness.
Use a Content Delivery Network (CDN)
A content delivery network spreads your site’s resources across edge servers worldwide. This setup cuts the distance data travels to users, speeding up load times. Think of it like placing mini warehouses close to your customers instead of shipping everything from one far-off spot.
CDNs shine in optimizing Time to First Byte, or TTFB, that key moment when the browser gets the first bit of response. Lower TTFB lets subresources load faster, especially if browser cache and speculative loading fall short.
Move dynamic logic from your origin server to the edge for quicker serves. Cache static HTML documents, even for short stints, to boost speed without much hassle. CDNs handle HTML caching well, though the Web Almanac shows just 33% of such requests hit a CDN.
Weigh if fresh content matters a ton, or if a bit of staleness works fine for your site. Pair this with load balancers for even distribution, and add DDoS protection to keep things secure.
Tools like Google PageSpeed Insights help track these gains in your Core Web Vitals.
Optimize and compress images
Images often make or break your site’s speed, especially since 73% of mobile pages rely on them as the largest contentful paint element. You can boost your Largest Contentful Paint scores by optimizing and compressing these visuals, which ties right into better SEO and faster content delivery via a CDN.
- Check your pages first, because for those with images as LCP, 35% of those images hide from the initial HTML response, slowing everything down. Make sure search engines spot them early to cut load times and improve siteimprove performance.
- Speed up discovery, as 15% of eligible pages delay finding LCP images, which hurts total speed. Prioritize quick detection in your code to avoid that impact and enhance multi-cloud optimization.
- Compress files smartly, since poor LCP origins spend less than 10% of their p75 LCP time actually downloading the image. Use tools like Google PageSpeed Insights to shrink sizes without losing quality, making your site zip along like a well-oiled machine.
- Tackle delays head-on, with poor LCP pages averaging 1,290 milliseconds at the 75th percentile just waiting around. Optimize formats such as WebP for faster loads, and watch your metrics soar in Google Search Console.
- Grab Chrome DevTools’ coverage tool to hunt down unused code that drags on image loading. Eliminate those bits, and you’ll free up resources, much like clearing clutter from a busy desk to get work done quicker.
- Split your code wisely for non-essential parts, letting key images load sooner. This approach, paired with bot management, keeps things smooth and prevents bottlenecks in your site’s flow.
- Clean up tag manager JavaScript by ditching outdated tags that mess with image timing. Streamline it all, and you’ll notice quicker responses, tying into better observability for your entire setup.
- Integrate a content delivery network to serve compressed images faster across regions. Pair this with HTTP/3 and QUIC for that extra edge, turning slow loads into snappy experiences that keep visitors hooked.
Eliminate render-blocking resources
Render-blocking resources slow down your page load, hurting Largest Contentful Paint and general SEO. You can fix this by spotting and handling them smartly, like a mechanic tuning an engine for peak speed.
- Spot issues early with Chrome’s coverage tool, which highlights render-blocking resources you can remove or defer, much like clearing clutter from a busy workshop to get the job done faster.
- Defer non-critical resources by placing them at the end of the document, lazy-loading images or iframes, or loading them asynchronously using JavaScript, ensuring your page doesn’t wait around like a kid in line for ice cream.
- Prefer server-side rendering over client-side rendering for faster LCP, as it delivers complete page markup right in the HTML source, avoiding delays that make users bounce like a bad check.
- Add the fetchpriority HTML attribute to boost loading priority for critical resources, giving them a VIP pass through content delivery networks and HTTP/3 protocols for quicker results.
- Employ tags for key items to prompt early browser discovery, tying into tools like Google Search Console for monitoring, and reducing waits that kill your site’s vibe.
- Cut out outdated or unnecessary JavaScript that blocks rendering, freeing up the main thread and pairing well with AMP for streamlined mobile experiences, like trimming fat from a steak.
- Opt for baseline web platform features instead of heavy JavaScript to lessen main thread competition, enhancing interaction speeds and aligning with next-gen WAF for better API security in dynamic setups.
- Address resource load delays before they ruin LCP, especially if pages must wait for CSS or JavaScript before images load, and integrate this with canonicalization to avoid duplicate content pitfalls.
- Combine these steps with a content delivery network to speed up global access, much like using websockets for real-time fanout in live streaming, keeping your audience hooked without frustrating lags.
How to Improve Interaction to Next Paint (INP)
Hey, imagine clicking a button on your site, and it responds like lightning, no frustrating delays. You can make that happen by tackling JavaScript tasks, event callbacks, and excess code, pulling in tools like Chrome DevTools to spot issues fast.
Break up long-running JavaScript tasks
Long tasks in JavaScript can slow your site down. Browsers handle tasks like rendering, layout, and parsing. These jobs block the main thread if they last over 50 milliseconds. That hurts responsiveness, and users notice the lag.
Split those big tasks into smaller chunks. You improve how fast your page reacts this way.
Try the Scheduler API with scheduler.yield() to manage priorities. It breaks up work without freezing the screen. Developers, grab those developer SDKs to test changes. Use Chrome DevTools to spot tasks that delay interactions.
Avoid big rendering updates after a click or tap. Recent updates in October 2024 reversed advice on the isInputPending API, so skip it now. Focus on splits that fit most sites, boost real-world speed, and suit your skills.
Pair this with HTTP/3 and QUIC for quicker loads, even tying into SEO gains.
Optimize event handlers and callbacks
You know that feeling when a website lags right after you click something? That’s often due to clunky event handlers slowing down Interaction to Next Paint, or INP. Optimize those handlers to cut the work during user interactions.
Keep things snappy by using passive event listeners where it fits; they stop blocking the main thread. Imagine your code as a busy chef in a kitchen – reorganize DOM reads and writes to dodge layout thrashing, like grouping tasks to avoid chaos.
Trim DOM sizes small; this slashes rendering complexity in callbacks. Implement debouncing or throttling for events like scroll or resize – it’s like putting a speed limit on a highway to prevent crashes.
Use requestAnimationFrame for visual updates from handlers; it syncs with the browser’s rhythm. Remove extra event listeners to ease processing overhead, and skip synchronous XHR or fetch calls inside them.
Tie this into your SEO strategy with tools like Siteimprove.ai for quality assurance, or leverage HTTP/3 and QUIC for faster content delivery via a CDN. Even consider websockets and fanout for real-time tweaks, boosting general site performance.
Remove unnecessary JavaScript
Cut back on extra JavaScript, and watch your site’s Interaction to Next Paint scores soar. Think of it like clearing clutter from a busy kitchen, you free up space for the main tasks.
Start by using baseline web platform features instead of JavaScript, that way you cut down on main thread competition. Grab Chrome DevTools’ coverage tool, it helps you spot and ditch unused code in a snap.
Implement code splitting for non-essential bits, loading them only when needed.
Audit third-party scripts next, remove any that aren’t pulling their weight for better SEO and faster loads. Optimize your tag manager JavaScript by dumping outdated tags, and defer non-critical stuff until after the main content appears.
Minimize polyfills and transpiled code if your audience doesn’t need them, especially when checking Google Trends for user habits. Limit big JavaScript libraries, opt for smaller, purpose-built ones instead.
With tools like Siteimprove Quality Assurance, you keep everything in check, even as you explore HTTP/3 and QUIC for smoother delivery.
How to Reduce Cumulative Layout Shift (CLS)
Tired of your webpage jumping around like a frog on a hot sidewalk, frustrating visitors before they even settle in? You can steady things up by setting clear sizes for pictures and clips, plus carving out spots for ads or other pop-up elements, keeping that layout rock-solid from the start.
Set explicit dimensions for images and videos
Images cause big problems on many websites. About 66% of pages have at least one unsized image, and that leads to nasty layout shifts. These unsized images start with an initial height of 0px, so they push content around when they load.
You fix this by setting explicit width and height attributes, or use equivalent CSS properties. This reserves space in advance, and it stops those annoying shifts. For even better control, try the aspect-ratio property in CSS.
It sets width and height ratios for images and other elements, like a smart blueprint for your layout.
Videos need the same care, especially with streaming video (VOD) that pulls from content delivery (CDN) networks for faster loads. Reserve space for video containers by setting their width and height before anything loads.
This keeps your page steady, even on devices using HTTP/3 and QUIC for quick connections. Use responsive images with srcset and sizes attributes to scale everything right across screens.
Then, apply object-fit and object-position CSS properties. They control how media looks without messing up layout stability, boosting your SEO (search engine optimization) in the process.
Reserve space for dynamic content
You know that frustrating jolt when a webpage jumps around while loading? That’s cumulative layout shift in action, and reserving space for dynamic content stops it cold. Start by setting a min-height for elements that hold dynamic or third-party content; this simple step reduces those pesky shifts.
For banners, notifications, or ads, allocate a fixed height or space in the DOM right before the content loads, like staking out territory in a crowded park. Throw in skeleton screens or placeholders to keep the layout steady as things fetch from object storage or a key value store.
Oh, and avoid popping new DOM elements above existing stuff unless you’ve pre-allocated room, or you’ll invite chaos like an uninvited guest at dinner.
Dive deeper with tools that make this easy. Use CSS aspect-ratio to lock in proportional space for dynamic elements, ensuring everything fits without a hitch. Monitor those shifts from dynamic content with Chrome DevTools’ Layout Shift Regions overlay; it highlights trouble spots like a spotlight on stage.
Audit and optimize third-party scripts that inject content on the fly, especially if they tie into websockets & fanout for real-time updates over HTTP/3 & QUIC. Reserve that necessary space in advance as much as possible to prevent layout shifts altogether.
Use compositor-only animations
Stick to compositor-only animations for better CLS scores. Pages that animate layout-affecting CSS properties drop 15% below the average in hitting good CLS ratings, per HTTP Archive data.
Think of it like this, you avoid a bumpy ride by not messing with the road itself. Animating margin or border widths doubles your chance of poor CLS metrics. Layout-inducing CSS properties, like top, left, margin, and border, trigger those unwanted shifts.
Switch to transform properties instead. Use transform:translateX() or transform:translateY() to dodge layout updates altogether. These leverage the browser’s compositor thread and boost performance.
CSS properties on the compositor thread keep things smooth. Animations should skip properties that need layout updates, except for user-triggered ones. Avoid animating width, height, or position if you can help it.
The Lighthouse audit flags “Avoid non-composited animations” to spot slow ones hurting your site. Oh, and while optimizing, check your robots.txt file to make sure search engines crawl your improved pages right.
Compositor-only moves act like a slick shortcut, they cut out the drama of shifts.
Tools to Monitor and Measure Core Web Vitals
Hey, you can track your site’s Core Web Vitals with easy options like PageSpeed Insights from Google for fast speed checks, DevTools in Chrome to spot issues right away, and Search Console by Google for big-picture reports on performance—stick around and see how these boost your web game.
Google PageSpeed Insights
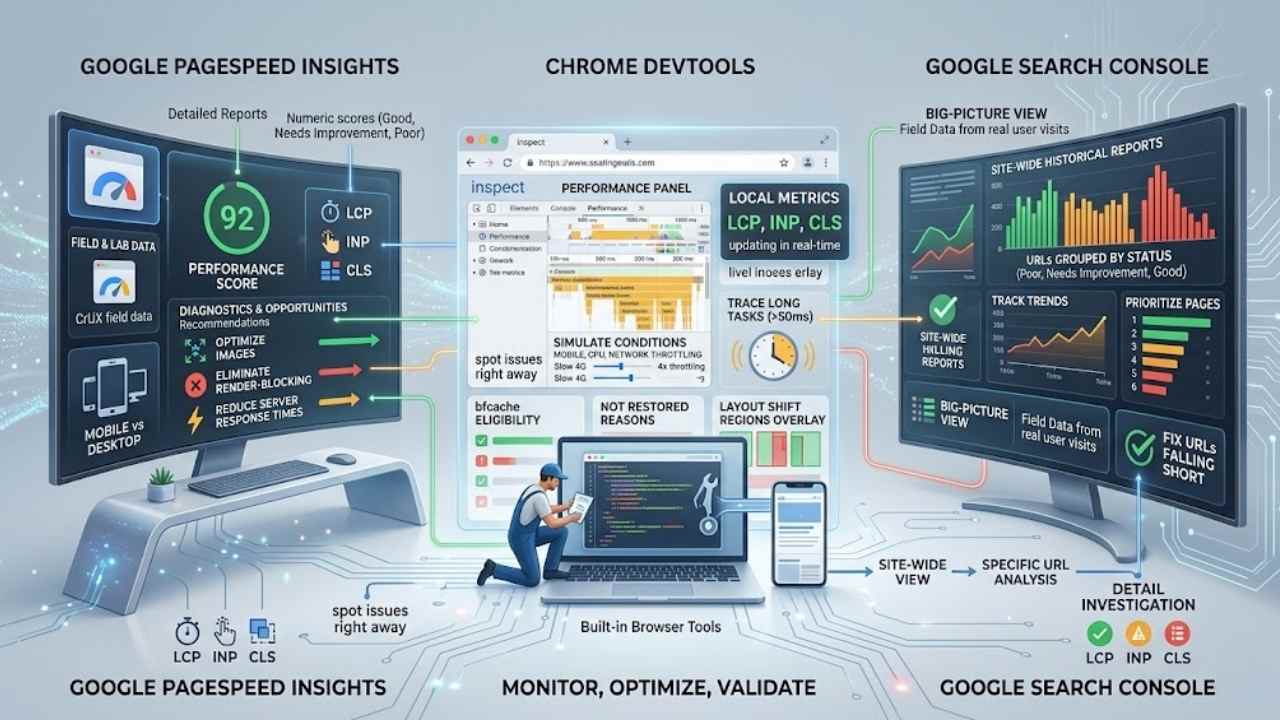
Google PageSpeed Insights measures Core Web Vitals performance for your site. This tool gives detailed reports on Largest Contentful Paint, Interaction to Next Paint, and Cumulative Layout Shift metrics.
You get numeric scores for these, classified as good, needs improvement, or poor. Imagine spotting a slow runner in a race; it identifies slow-loading images that hurt LCP, like that one friend who always holds up the group.
The tool pulls field data from the Chrome UX Report for real-world analysis, so you see how users experience your pages.
Opportunities and diagnostics sections recommend action items, such as eliminating render-blocking resources or optimizing images. PageSpeed Insights breaks down performance by device type, mobile or desktop, to help you fix issues where they matter most.
You spot problems fast and make changes that boost speed, keeping visitors happy and engaged.
Chrome DevTools
Chrome DevTools helps you spot issues with Core Web Vitals right in your browser. You open it up, and bam, the coverage tool identifies unused code and those pesky render-blocking resources that slow things down.
Think of it like a mechanic checking under the hood, finding parts that don’t pull their weight. Developers simulate mobile device conditions to measure LCP, INP, and CLS accurately.
The trace tools analyze long tasks exceeding 50 milliseconds, showing where JavaScript hogs the main thread.
Dig into responsiveness with real-time inspection of resource loading and prioritization. You inspect event handlers and main thread activity for a clear view of delays. The Layout Shift Regions overlay highlights layout shifts during page load or interaction, like a spotlight on sneaky movements.
Chrome DevTools verifies bfcache eligibility and troubleshoots Not Restored Reasons to keep pages snappy. The Lighthouse audit warns about non-composited animations and layout-affecting CSS properties, guiding fixes with precision.
Google Search Console
Google Search Console gives you Core Web Vitals reports to monitor your site. These reports pull from field data, gathered during real user visits via the Chrome UX Report. You spot URLs that fall short on LCP, INP, or CLS thresholds right away.
The console shows a historical view of your Core Web Vitals performance over time, like a timeline of ups and downs.
It pinpoints specific URLs hit by poor Core Web Vitals scores, so you fix the right spots. Google Search Console offers guidance and links to documentation for tackling issues, making fixes feel straightforward.
This tool ties in with other Google services, giving a full SEO and performance overview. Plus, it helps you prioritize pages to optimize for the biggest boost in search rankings, kind of like picking low-hanging fruit first.
Final Thoughts
You’ve tackled ways to boost your site’s Largest Contentful Paint by prioritizing images and using a Content Delivery Network, sharpened Interaction to Next Paint through smarter JavaScript handling, and tamed Cumulative Layout Shift with fixed sizes for media.
These tweaks prove simple, quick wins that anyone can apply without a tech overhaul. Ready to check your progress? Jump into PageSpeed Insights or Chrome DevTools right now and spot those easy fixes.
Strong Core Web Vitals lift user satisfaction, slash bounce rates, and even bump your search rankings. For more detailed looks, explore Search Console reports or chat with a web pro.
Go ahead, make those changes today, your site will thank you with lightning speed and happy visitors.
Frequently Asked Questions (FAQs) on Improving Core Web Vitals for Faster Website Speed
1. What exactly are Core Web Vitals, and why do they matter for my site?
Core Web Vitals measure how fast your website loads, responds to clicks, and stays stable. Think of them like the heartbeat of user experience; if they’re off, visitors bounce like a bad date. Improving them boosts your search rankings and keeps folks happy.
2. How can I speed up Largest Contentful Paint on my page?
Optimize your images by compressing those hefty JPEG files. That cuts loading time, making your site pop quicker for users.
3. What’s a simple fix for Cumulative Layout Shift issues?
Lock in your layout with fixed sizes for ads and embeds; no more annoying jumps that frustrate visitors. It’s like telling your page, “Stay put, buddy,” so everything loads smoothly without surprises. This tweak alone can make browsing feel as steady as a rock.
4. Any tips to lower First Input Delay and make my site more responsive?
Minify your JavaScript code to reduce delays when users interact. Picture it as trimming the fat off a steak; suddenly, clicks feel snappy and effortless.