
Data analysts face tough choices in picking tools. They base picks on business needs, scalability, flexibility, and ease of use. Top picks include Python, R, SQL, Excel, Power BI, and Tableau.
These fit into data mining, data visualization, and business intelligence stages. Microsoft Excel stands out for importing, cleaning, and creating graphical representations of data.
Analysts build skills with courses and professional portfolios, like you might share a project on your website.
Future trends point to AI integration, real-time data processing, and cloud platforms. Picture a data scientist using machine learning in Python code to predict trends, much like spotting patterns in a crowded market.
Tools like Apache Spark handle big data for large-scale tasks. SQL helps with database management in relational databases. Power BI creates dashboards that integrate with Microsoft apps, turning raw numbers into clear stories.
R shines in statistical analysis, offering visualization techniques for deep insights.
You face a tough challenge as a data analyst on Windows. Tools overwhelm you, right? Picking the wrong ones slows your work, muddles insights, and wastes time. Imagine sifting through endless options, like hunting for a needle in a haystack, only to miss key features for data visualization or statistical analysis.
Frustration builds when apps don’t play nice with your setup.
One key fact stands out: top data analysis tools, such as Microsoft Excel and Python, boost efficiency for tasks like data cleaning and predictive analytics. This post lists 10 must-have Windows apps, from SQL for database management to Power BI for business intelligence.
It shows how each fits your needs, with tips on integration and best practices. Start exploring now.
Key Takeaways
- Top Windows apps for data analysts include Excel for data handling, Python as the most popular programming language, SQL for database management, Tableau for visualization, Power BI for business intelligence, R for statistical analysis, SAS for advanced analytics, Jupyter Notebook for interactive coding, and Apache Spark for big data processing.
- Article updated on May 9, 2025, highlights Excel’s features like Pivot tables, Power Pivot for huge datasets, and Power Query for data cleaning.
- Python libraries such as Pandas for data analysis, NumPy for numerical computing, Matplotlib for visualizations, Seaborn for graphics, and Scikit-learn for machine learning boost workflows on Windows.
- Tools like R with ggplot2 for charts, SAS from SAS Institute for managing extensive datasets, and Apache Spark with MLlib for machine learning handle predictive analytics and real-time data.
- Google Data Analytics Professional Certificate teaches R programming and statistical analysis for business intelligence tasks.
SQL: A Core Tool for Data Analysts
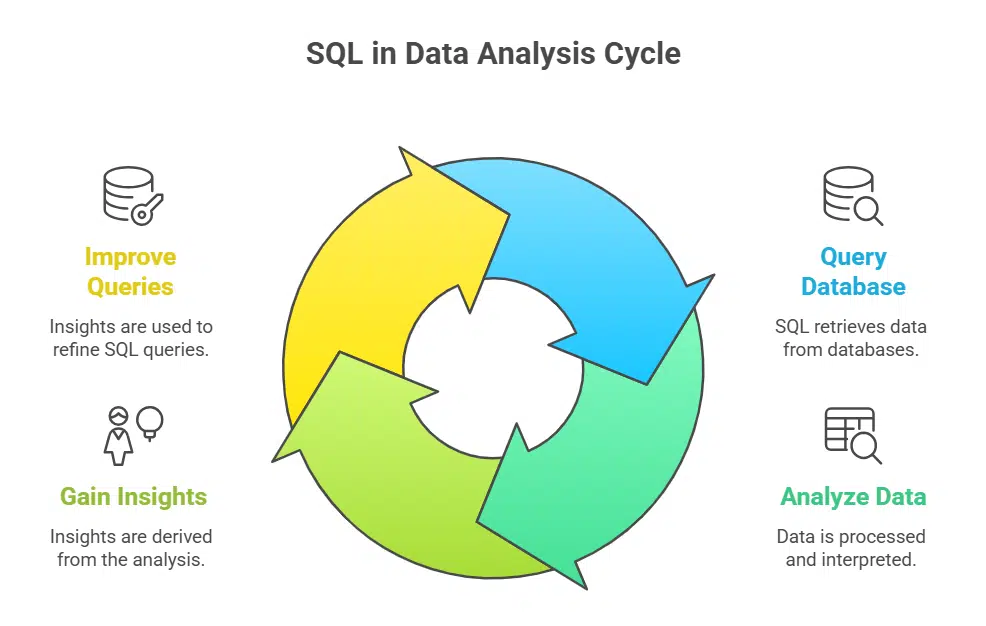
Hey, imagine SQL as your trusty sidekick in the data world, pulling info from databases like a pro magician yanking rabbits from hats. Dive deeper into how tools like Microsoft SQL Server make querying a breeze, and you’ll wonder how you ever analyzed without them.
Effective database management with SQL tools
SQL tools make managing databases a breeze for data analysts. You handle relational databases with ease using structured query language. This language acts as the backbone for database management systems.
Picture it like the sturdy frame holding up a house, keeping everything in place. Analysts query data fast, pulling insights from vast stores.
Window functions in SQL boost advanced analytics. They let you rank data or calculate running totals without hassle. Tools like SQL Server Integration Services streamline workflows, merging data from multiple sources.
Imagine chatting with your database, asking for exactly what you need, and getting it right away. Relational database management systems thrive on this power, supporting business intelligence tasks every day.
SQL querying best practices for data retrieval
SQL helps data analysts pull info from big relational database management systems, like a skilled detective finding clues in a crowded room. Start with clear SELECT statements to grab exact columns, and avoid wildcards that slow things down.
Analysts scale queries for extensive datasets by using indexes, which speed up searches like shortcuts in a maze. Window functions support advanced analytics, letting you rank data or calculate running totals without extra steps.
They integrate well with tools like Power BI for seamless business intelligence workflows.
Imagine you’re knee-deep in data mining, and SQL becomes your go-to for precise retrieval. Join tables smartly to link info from multiple sources, but test on small sets first to dodge errors.
Limit results with WHERE clauses to focus on key business analytics needs, cutting noise like trimming fat from a steak. This approach handles large-scale tasks and boosts machine learning prep.
Our tips here draw from practices updated on May 9, 2025, keeping your skills sharp in data analysis.
Data Visualization with Tableau
Tableau makes data pop, like a storyteller spinning yarns from numbers, with drag-and-drop tools that craft vivid charts and maps. Hey, if you’re a data analyst chasing clear insights, picture sharing those interactive dashboards to wow your team, and keep reading for real-world examples that fit your daily grind.
Explore interactive visualization with Tableau
Tableau stands out as the leading platform for data visualization and business intelligence. You can build visually appealing dashboards that make complex data pop like fireworks on the Fourth of July.
Analysts love how it turns raw numbers into stories, you know, the kind that grab attention in a boardroom meeting. Picture dragging and dropping elements to create interactive charts, it’s like playing with building blocks, but for grown-up data tasks.
This tool simplifies ad hoc analysis and collaboration, letting teams share insights without a hitch. Data analysts use Tableau Public to showcase work online, sparking ideas across groups.
It integrates well with other data analysis tools, boosting your business analytics game. Imagine spotting trends in real time, that’s the magic it brings to statistical analysis software.
Analyst use cases for Tableau
Data analysts love Tableau for its power in ad hoc analysis, you know, like digging into sales trends on the fly without a hassle. For example: a business intelligence pro spots a sudden drop in marketing strategies, then whips up an interactive dashboard to share with the team, fostering real collaboration.
They clean data fast, visualize patterns with charts that pop, and even use mobile access for on-the-go checks during client meetings. It’s like having a trusty sidekick that turns raw numbers into clear stories, helping with everything from predictive analytics to spotting insights in relational database management systems.
Folks in business analytics often turn to Tableau for quick data visualization tasks, such as building reports on customer behavior from Google Analytics feeds. Imagine an analyst at a firm, juggling massive datasets, and boom, they create widgets that highlight key metrics like conjoint analysis or random forests predictions.
This tool simplifies sharing findings across devices, making sure everyone stays in the loop, even from a phone. With updates keeping it fresh, as seen in the article refreshed on May 9, 2025, Tableau boosts analytical skills by letting users explore data mining without breaking a sweat.
Create comprehensive dashboards and reports
You know, Power BI acts as Microsoft’s key business analytics tool. It helps data analysts build full dashboards and reports with ease. Pull in info from many spots like spreadsheets or databases.
This setup lets you mix data sources without a hitch. You can turn raw numbers into clear stories, like a puzzle coming together.
Next, explore DAX language for top-notch modeling. It powers up your predictive analytics game. Analysts use it to craft smart calculations on big datasets. Spot trends fast in business intelligence tasks.
Think of interacting with your data, asking what sales might look like next quarter. Tools like this make data visualization a breeze, boosting your machine learning ideas too.
Seamless Microsoft app integration with Power BI
Power BI shines in business intelligence by pulling data from many spots. It grabs info from Excel spreadsheets, SQL databases, and even web sources like Facebook. This data integration makes your work smooth and fast.
Imagine juggling balls without dropping any; that’s Power BI for you. Analysts love how it blends with other Microsoft tools, like Teams or Azure, to build strong reports.
You get seamless ties to apps that boost your data analysis. For instance, link Power BI with Microsoft Excel for quick data cleaning. Or use it with Outlook to share insights right away.
This setup helps in predictive analytics and statistical analysis too. We updated this article on May 9, 2025, to keep tips fresh for data analysts. Tools like this turn complex tasks into a walk in the park.
Harness R for advanced statistical computing
R excels in statistical analysis and data visualization, like a trusty sidekick for number crunchers. Analysts rely on its power for complex tasks, building models that predict trends with ease.
Take ggplot2, for example, it crafts stunning graphics that make data pop, turning raw numbers into clear stories. This r programming language shines in reproducibility, letting you share code that others can run without a hitch.
Picture yourself diving deep into data mining with r language tools, no sweat involved. It handles statistical modeling like a pro, specialized for those tough calculations. As statistical analysis software, R boosts your business intelligence game, integrating seamlessly with other apps.
Data analysts love how it supports machine learning basics, keeping everything precise and reliable.
Explore visualization techniques in R
R shines in data visualization, folks. Imagine your data as a story waiting to burst out. Use ggplot2 to craft stunning charts and graphs. This package turns complex stats into clear pictures.
Data analysts love it for spotting trends fast. R programming excels at statistical analysis, with tools like ggplot2 leading the pack.
Explore R through the Google Data Analytics Professional Certificate. This course hones your skills in r programming language. It focuses on statistical analysis software for real-world tasks.
Build heatmaps or scatter plots with ease. Mix in machine learning for predictive analytics. R handles data mining like a pro. Our article, updated on May 9, 2025, keeps these tips fresh for business intelligence pros.
Advanced Data Handling with SAS

Data analysts, you know how big datasets can feel like wrestling a giant octopus, right? SAS steps in as your trusty sidekick, crunching through massive data volumes with its powerful statistical analysis software to deliver sharp insights on Windows.
Utilize SAS for sophisticated analytics
SAS stands as a comprehensive software suite for advanced analytics and business intelligence. You, as data analysts, can harness its power for statistical analysis and predictive analytics.
Consider it like a trusted sidekick in a tough data mining adventure, SAS helps you tackle complex tasks with ease. It supports machine learning and data cleaning, making your workflows smoother on Windows.
Grab SAS from the SAS Institute to explore business analytics. Analysts often use it for creating reports in business intelligence setups. Think of it as your go-to tool for handling relational database management systems.
This setup fits well with tools like Microsoft Power BI for seamless integration. Article updated on May 9, 2025.
Managing extensive datasets with SAS
SAS handles big data sets like a pro, folks. Imagine you’re knee-deep in massive files that could bury a desk, and SAS steps in as your trusty sidekick. This comprehensive software package powers advanced analytics and business intelligence for data analysts everywhere.
You load up extensive datasets, run statistical analysis, and spot trends fast. It crunches numbers on Windows without a hitch, turning chaos into clear insights. Business intelligence shines here, with tools that slice through data mining tasks.
Data analysts love SAS for its grip on huge volumes. Say you manage a warehouse of info from a relational database management system; SAS sorts it all. It supports predictive analytics too, helping you forecast with machine learning bits.
Updated on May 9, 2025, this statistical analysis software keeps evolving for business analytics needs. You clean data, build models, and even script in R programming if you mix tools.
Apache Spark fans might pair it for big data boosts, but SAS stands strong alone for extensive datasets.
Jupyter Notebook for Interactive Data Analysis
Mix code and pictures right in your Jupyter Notebook, like blending ingredients in a recipe for clearer insights. Add extensions to boost your work, turning simple tasks into smooth rides that spark fresh ideas in data analysis.
Integrate code with visuals in Jupyter
Jupyter Notebook acts as an interactive environment for coding, data cleaning, and visualizations. You mix Python scripts with charts right in one spot, like blending ingredients in a recipe for clearer insights.
This setup lets data analysts see results pop up live, making tweaks a breeze. Picture jotting down notes next to your work; it boosts collaboration among teams.
Data visualization shines here, as you integrate code with visuals in Jupyter to spot trends fast. Analysts use this tool for machine learning tasks or statistical analysis, sharing notebooks like handing over a storybook of findings.
It enhances documentation too, turning complex data mining into simple tales that everyone gets.
Enhance your analysis with Jupyter extensions
Jupyter Notebook offers an interactive environment for coding, data cleaning, and visualizations. Analysts love how it mixes code with charts, like a playground for data ideas. You run snippets live, spot errors fast, and share results easy.
Imagine you’re knee-deep in a dataset, juggling numbers like a circus act, and boom, visuals pop up right there.
Extensions boost that power for data analysts. Grab ones for better data visualization or machine learning tasks. They add tools like auto-complete or version control, making workflows smoother.
Data cleaning gets a lift with plugins that scrub messy files in a snap. Business intelligence pros use them to integrate with Power BI or R programming. Think of extensions as secret weapons, turning basic notebooks into statistical analysis hubs.
This article saw updates on May 9, 2025, keeping tips fresh for your next project.
Big Data Processing with Apache Spark
Data analysts, you know the drill when big data hits like a freight train – Apache Spark steps in to process those massive datasets at lightning speed, handling everything from batch jobs to streaming analytics.
Picture slicing through petabytes of info in real time; Spark’s distributed computing framework, with tools like Spark SQL for queries and MLlib for machine learning models, makes it a game-changer for scaling your work on Windows machines.
Employ Apache Spark for large-scale data handling
Apache Spark handles big data like a champ. This framework processes large-scale datasets fast. You load massive files, and it crunches them without a hitch. Think of it as a turbo engine for your data analytics.
Data analysts rely on Spark for quick insights from huge volumes. It works well on Windows, fitting right into your setup.
Pair Spark with Apache Hadoop for even more power. Hadoop includes HDFS for storage and MapReduce for processing. Together, they tackle data mining tasks head-on. Imagine sorting through a warehouse of info, pulling out gems in real time.
Spark boosts machine learning too, making predictive analytics a breeze. Business intelligence pros use this combo to analyze data streams on the fly.
Implement real-time data analysis with Spark
Spark acts as a big data processing framework for large-scale datasets, perfect for data analysts tackling massive information loads. You can process streams of data as they arrive, like catching fish in a fast river, without waiting for the whole lake to fill.
This setup lets you spot trends right away, using tools like machine learning to predict outcomes on the fly. Data analysis tools in Spark handle everything from data cleaning to statistical analysis, making your work smoother on Windows.
Imagine you’re knee-deep in business intelligence tasks, and Spark jumps in to manage real-time data analysis with ease. It integrates well with programming languages like Python or R, boosting your predictive analytics game.
For those big projects, think of Spark as your trusty sidekick, slicing through data warehouses and relational database management systems. Analysts love how it supports data visualization and mining, all while keeping things fast.
This article got updated on May 9, 2025, so you get the latest tips.
Leverage BigQuery for cloud analytics
BigQuery acts as a serverless data warehouse for massive datasets. You handle huge amounts of data without managing servers. Data analysts love this tool for quick queries in cloud analytics.
It fits right into your business intelligence workflow. Picture dumping terabytes of info, then slicing through it like a hot knife through butter.
Run BigQuery on Windows setups with ease. Analysts pull insights fast for predictive analytics and data visualization. Mix it with tools like Microsoft Power BI for seamless reports.
This boosts your data mining game in real time. We updated this article on May 9, 2025, to keep tips fresh.
Ensure Windows compatibility in BigQuery setups
You run Windows, and you want smooth access to Google BigQuery for your data analysis tasks. This tool acts as a serverless data warehouse, perfect for handling massive datasets without the hassle of managing servers.
Data analysts love it for quick queries and scalable storage in the cloud. Set up the Google Cloud SDK on your Windows machine first, it installs fast and lets you connect right away.
Run commands in PowerShell or Command Prompt to link up, making sure your setup works without glitches.
Picture juggling huge data loads like a pro juggler, that’s BigQuery on Windows for you. Install the SDK from Google’s site, follow the steps, and test a simple query to confirm compatibility.
This ties in well with other data analysis tools like Microsoft Power BI for seamless business intelligence workflows. Oh, and if you’re into machine learning or predictive analytics, BigQuery plays nice with those too.
Keep your drivers updated, it avoids common snags. Article updated on May 9, 2025.
Takeaway
We covered top Windows apps like Excel for data handling, Python libraries for workflows, and SQL for queries. These tools make analysis simple and fast, fitting right into your daily tasks.
Pick the right ones based on your needs, and watch your efficiency soar in business intelligence. Check out GROUPTRAINING for learning platforms, or try Coursera courses like the Google Data Analytics Certificate to build skills.
Jump in now, because mastering these apps opens doors to big wins in data analytics, like a key unlocking hidden treasures.
FAQs on Must-Have Windows Tools for Data Analysts
1. Hey, as a data analyst, what Windows apps should I start with for data visualization?
Power BI stands out for turning raw numbers into eye-catching charts, you know, like painting a picture with your data. It links up with tools like Google Sheets for quick insights. Plus, it’s a breeze for business intelligence tasks that make your reports pop.
2. Can R programming really boost my statistical analysis on Windows?
You bet, R programming language dives deep into data analytics, spotting trends like a detective on a case. Data analysts love it for predictive analytics and machine learning tricks.
3. What’s the deal with Jupyter Notebook for data cleaning?
Jupyter Notebook lets you scrub messy data in a web-based setup, almost like chatting with your code in real time. It’s perfect for scripting and mixing in some artificial intelligence flair.
4. How does Apache Spark fit into data mining for business analysts?
Apache Spark crunches huge datasets fast, helping with data mining that uncovers hidden gems in your info. Think of it as a turbo engine for handling relational database management system tasks.
5. Are there good Windows tools for machine learning in data analysis?
Absolutely, tools like those supporting k-nearest neighbors algorithms make machine learning a walk in the park. They tie into business analytics for smarter predictions.
6. Why pick Microsoft Power BI over other data analytics tools?
Microsoft Power BI shines in business intelligence (BI), weaving together SSIS packages for seamless data flow. It’s empathetic to your workflow, saving time on technical tools, and hey, it even humors your need for speedy statistical analysis software.