A machine learning project can easily go wrong before anyone even picks an algorithm. A team might sit on a huge pile of data, yet lack the right answers to teach their system.
Another team might start grouping customer files when all they really needed was to predict a single, specific result. Understanding the difference in supervised vs unsupervised learning prevents those costly missteps.
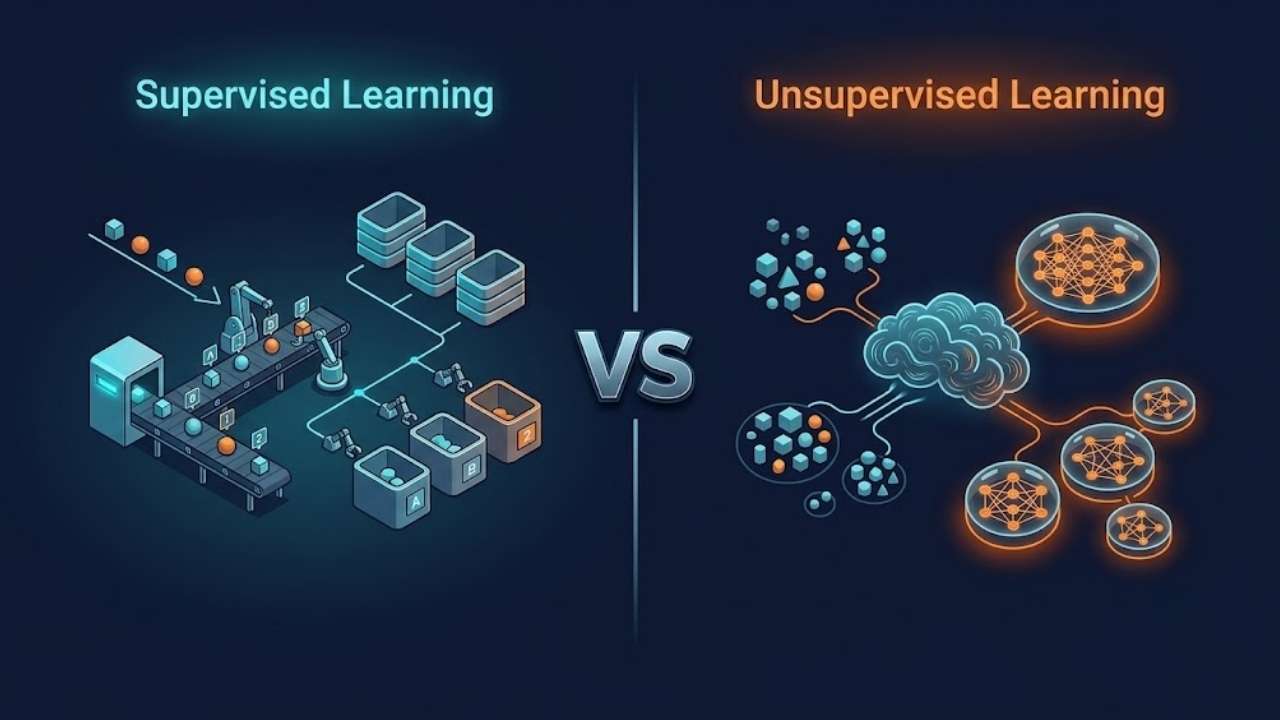
In supervised learning, you give the computer training data that already includes the correct answers, often called labels. Unsupervised learning takes a different path. It works with unlabeled data and tries to find hidden patterns, group similar items together, spot strange outliers, or simplify giant datasets.
If you have a clear goal and know what answer you want to predict, supervised learning is usually the best choice. Unsupervised learning shines when you don’t have labeled data, when your categories aren’t clear yet, or when you simply need to explore your information before building a full solution.
Supervised vs Unsupervised Learning: The Direct Difference
In supervised learning, each training example normally includes features and a label. The features describe the example. The label is the result the model should learn to predict.
A spam filter may receive the email text, sender details, links, and formatting as features, along with a label such as spam or not spam. A house-price model may use location, floor area, age, and room count to predict the recorded sale price.
Unsupervised learning receives the features without a target answer. It may group similar customers, reduce hundreds of variables to a smaller representation, or flag records that differ sharply from normal patterns.
The algorithm can expose structure. It cannot decide on its own whether that structure matters.
| Point | Supervised learning | Unsupervised learning |
| Training data | Features paired with labels | Usually features without labels |
| Main purpose | Predict a defined outcome | Discover structure or unusual patterns |
| Common tasks | Classification, regression, ranking | Clustering, dimensionality reduction, anomaly detection |
| Typical output | Class, probability, score, or number | Cluster, component, embedding, or anomaly score |
| Evaluation | Compared with known outcomes | Reviewed through metrics, stability, experts, or later results |
| Main difficulty | Obtaining reliable and representative labels | Deciding whether the pattern is meaningful |
Labels affect far more than the training method. They determine how errors are defined, how performance is measured, and whether the model can support a repeatable operational decision.
How Supervised Learning Works
A supervised model learns a relationship between input features and a known target.
Suppose an online retailer wants to predict whether an order will be returned. Its historical records might include product category, price, discount, delivery time, customer history, payment method, and the final return status.
During training, the model studies those examples and adjusts its parameters to reduce the difference between its predictions and the recorded outcomes. Once evaluated on unseen data, it can estimate the return probability for a new order.
Most introductory supervised-learning problems fall into classification or regression.
Classification Predicts a Category
Classification assigns an example to one or more discrete classes.
Common uses include:
- Spam or legitimate email
- Fraudulent or normal transaction
- Defective or acceptable product
- Positive, neutral, or negative review
- Billing, delivery, cancellation, or account-access request
A classifier often produces a score or probability before the application turns it into a decision.
That second step matters. A fraud system with a lower decision threshold may detect more suspicious payments, but it may also block more genuine customers. The model estimates risk; the organization decides which error is more costly.
Accuracy is often a weak measure when one class is rare. A system that labels every transaction as legitimate may appear highly accurate while detecting no fraud. Precision, recall, F1, average precision, and probability calibration may provide a more useful picture.
Regression Predicts a Number
Regression estimates a continuous numerical value.
Examples include:
- House price
- Delivery time
- Energy consumption
- Monthly demand
- Equipment temperature
- Expected customer spending
The distinction depends on what the output represents, not how it is stored. A postal code may contain digits, but predicting it is normally classification because the number identifies a category. A house price is a measurable quantity, so differences between predictions have numerical meaning.
Common regression metrics include mean absolute error, root mean squared error, and (R^2). The useful metric is the one that reflects the real cost of being wrong.
A delivery model that misses by 20 minutes may be acceptable for a cross-country shipment and useless for a same-day grocery order.
Labels Are Usually the Expensive Part
The algorithm is rarely the hardest part of a supervised-learning project. Labels are.
They may come from transactions, customer actions, sensors, manual reviewers, experts, or historical decisions. Each source can contain mistakes, gaps, and inconsistent definitions.
A support message labelled “billing” may also involve account access. A churn label may rely on an arbitrary inactivity period. A fraud dataset records confirmed cases, not every fraud attempt that actually occurred.
More examples will not repair a confused definition.
If two reviewers disagree about what counts as abusive content, urgent risk, customer churn, or a defective product, the model learns that disagreement. It may reproduce the inconsistency more efficiently, but it cannot resolve the underlying policy problem.
Coverage matters as much as volume. A large dataset collected from one country, language, customer group, season, or device may perform poorly when the system encounters a different population.
Teams should settle the label definition before commissioning thousands of annotations. Otherwise, they may spend heavily to automate a decision their own staff never agreed on.
How Unsupervised Learning Works
Unsupervised learning starts without a target column that identifies the correct result.
Instead, the algorithm examines relationships among the supplied features. That broad description covers several different jobs, and they should not be treated as interchangeable.
Clustering Groups Similar Records
Clustering divides observations into groups based on a chosen measure of similarity or distance.
A retailer might group customers using purchase frequency, average order value, preferred categories, and discount use. A streaming platform could group songs using tempo, instrumentation, and acoustic characteristics.
The output does not arrive with names such as “loyal bargain shoppers” or “high-value occasional buyers.” Those descriptions are added later by analysts after inspecting the members of each cluster.
Common methods include:
- K-means, which assigns observations to a chosen number of clusters around centroids
- Hierarchical clustering, which builds nested groupings through repeated merging or splitting
- DBSCAN, which identifies dense regions and can leave isolated points unassigned
- Gaussian mixture models, which represent the data as a combination of probability distributions
Their assumptions differ.
K-means requires the number of clusters in advance and generally works best with reasonably compact groups. It can struggle with elongated shapes, unequal densities, or very different cluster sizes. DBSCAN can identify some irregularly shaped groups, but its results are sensitive to density settings.
Feature scaling can completely change the result. If annual income ranges into six figures while monthly purchase frequency ranges from one to ten, the income values may dominate the distance calculation unless the features are prepared carefully.
A cluster is not a newly discovered fact about customers. It is an output created by the selected variables, preprocessing, distance measure, algorithm, and settings.
That distinction is easy to lose once a colourful chart reaches a presentation.
Dimensionality Reduction Creates a Smaller Representation
Some datasets contain hundreds or thousands of variables. Many overlap, carry little useful signal, or make analysis difficult.
Dimensionality-reduction methods transform those variables into a smaller set of features. Principal component analysis, or PCA, finds directions that capture high levels of variance in the data.
This can help with:
- Visualizing high-dimensional datasets
- Reducing storage or computation
- Removing some redundancy
- Preparing inputs for another model
- Exploring broad patterns
PCA preserves variance, not universal importance.
A low-variance feature may still be critical for detecting a rare disease, equipment fault, security incident, or fraud pattern. A tidy two-dimensional plot can therefore hide information that matters to the actual decision.
The transformed components may also be difficult to explain. One component can combine dozens of original variables, making it useful mathematically but awkward for a stakeholder to interpret.
Dimensionality reduction should be judged by what it does to the downstream task, not by how clean the visualization looks.
Anomaly Detection Finds Unusual Behaviour
Anomaly detection looks for observations that differ from common patterns.
Possible uses include:
- Unusual network traffic
- Sensor readings outside normal operation
- Transactions unlike a customer’s usual activity
- Manufacturing measurements that differ from established ranges
Isolation Forest and Local Outlier Factor are common unsupervised approaches. One-class models can learn a boundary around data assumed to represent normal behaviour and then assess new records against it.
The terminology needs care. Outlier detection may work with a training set that already contains unusual observations. Novelty detection usually assumes the training data represents normal behaviour and checks new examples for departures from that pattern.
Anomaly detection is not always unsupervised. When dependable labels exist for fraud, attacks, faults, or defects, supervised classification may be more appropriate.
Unusual does not mean harmful.
A large payment may indicate stolen credentials, or it may be a customer buying furniture. A sudden sensor change may signal failure, or it may follow scheduled maintenance. An anomaly score should usually trigger investigation, not an irreversible decision.
Where Both Approaches Appear in Real Projects
Supervised and unsupervised learning often support different parts of the same workflow.
Customer Segmentation
A company without agreed customer categories may begin with clustering. Analysts might find groups with different purchase frequency, order value, and product preferences.
Those clusters are working hypotheses. After reviewing them, the company may decide that some are stable and useful enough to formalize. It can then create approved labels and train a supervised classifier to assign new customers consistently.
The unsupervised stage explores possible structure. The supervised stage turns an accepted definition into repeatable prediction.
Fraud Detection
A supervised model can learn from confirmed fraudulent and legitimate transactions.
An unsupervised detector can complement it by surfacing behaviour that differs from established patterns, including activity not represented in the labelled history. This may help investigators notice new fraud methods.
It will also flag legitimate exceptions. Real payment systems often combine supervised scores, anomaly signals, rules, device information, and human review rather than relying on one model.
Support-Ticket Routing
A supervised classifier can route incoming messages into known categories such as delivery, cancellation, billing, and account access.
Clustering can examine uncategorized historical tickets and reveal recurring themes that do not fit the existing taxonomy. That may show that the company is missing a category rather than that the routing model needs another tuning cycle.
Predictive Maintenance
A supervised model can predict failure when sensor readings are paired with reliable maintenance and failure records.
When failures are rare or poorly documented, an unsupervised model may instead learn normal operating patterns and flag unusual readings. It can tell the maintenance team that a machine looks different from usual. It cannot prove which component will fail or when.
Evaluation Is More Direct With Labels, Not Automatically Reliable
Supervised learning provides an apparent advantage: predictions can be compared with known outcomes on data the model did not train on.
Poor evaluation can still make a weak model look excellent.
Common problems include:
- Testing on data that is too similar to the training set
- Ignoring class imbalance
- Allowing the same customer, patient, device, or account into both splits
- Fitting preprocessing steps before separating training and test data
- Using random splits for problems where time order matters
Scalers, imputers, feature selectors, and PCA should learn only from training data. Pipelines help keep those steps inside the validation process and reduce leakage.
Unsupervised learning has no universal correct answer.
A silhouette score can measure how compact and separated clusters appear. Stability testing can show whether similar groups return after changing the sample or parameters. Neither proves that the groups support a useful business decision.
A stronger review may combine internal metrics, domain expertise, limited known labels, later predictive performance, and controlled business experiments.
A mathematically clean result can still be operationally useless.
Choosing Between Supervised and Unsupervised Learning
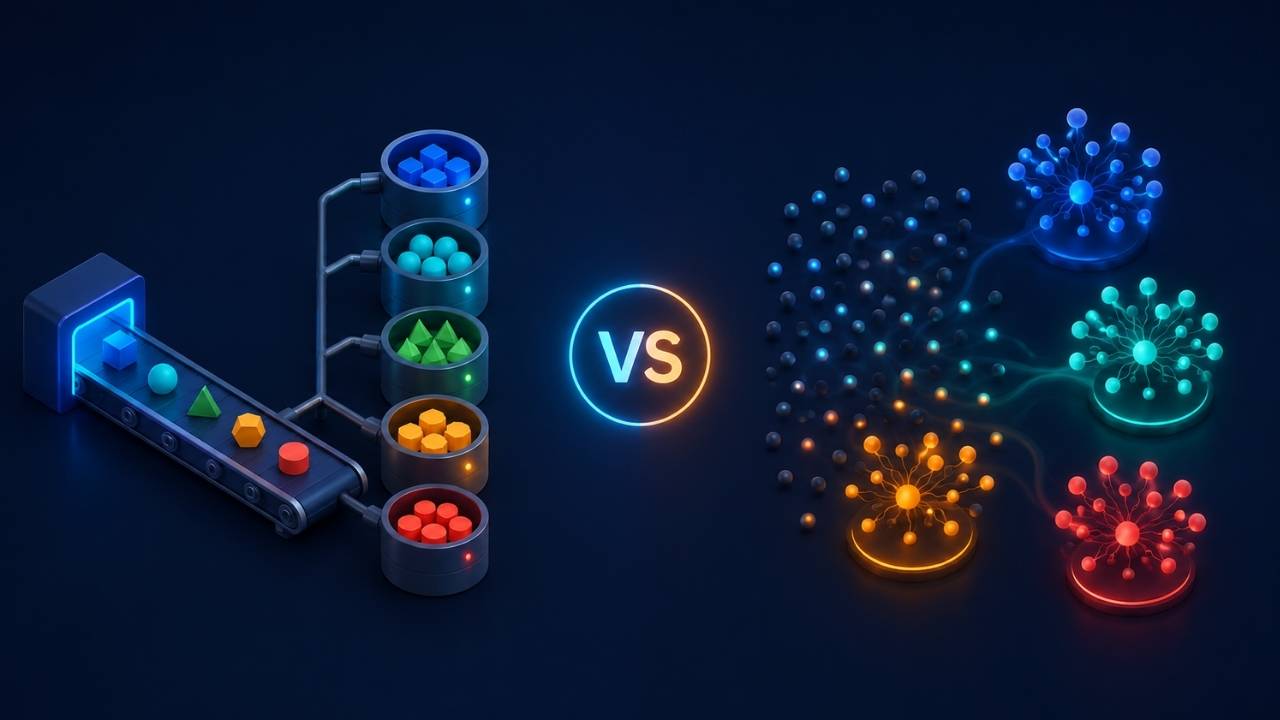
Choose supervised learning when:
- The required output is already defined
- Reliable historical outcomes exist
- Success can be measured against known answers
- The system must make repeatable predictions on new cases
- The organization can maintain label quality
Consider unsupervised learning when:
- No dependable target label exists
- The team needs to explore unknown structure
- Existing categories may be incomplete
- Complex data needs compression or visualization
- Unusual observations should be surfaced for investigation
For most production systems with a clear target, supervised learning should be the default starting point.
Unsupervised learning is powerful, but it is frequently overinterpreted. “Find interesting patterns in our customers” is not a complete product requirement. The team still needs to decide what action those patterns would support and how it will judge whether the action worked.
The Boundary Is Not Always Clean
The two approaches can be combined.
Clustering may suggest categories that experts later label. PCA or another representation method may create features for a supervised model. An anomaly score can become one input in a supervised fraud system.
Semi-supervised learning uses a smaller labelled dataset alongside a larger collection of unlabeled examples. It can help when labels are expensive but raw data is plentiful. Some methods assign tentative labels to high-confidence unlabeled examples, though incorrect early predictions can reinforce themselves if the process is poorly controlled.
Reinforcement learning is a separate family. It trains an agent to choose actions in an environment based on rewards or penalties. The absence of ordinary class labels does not make it unsupervised learning.
Common Mistakes That Distort the Results
Unlabeled data is not neutral. People still decide what to collect, which features to keep, how to scale them, and which records to remove.
Clusters are not natural categories waiting to be uncovered. Change the features, scaling, algorithm, distance measure, or cluster count, and the result may change substantially.
Supervised projects create a different risk: historical labels are often accepted without asking how those decisions were made. A model may reproduce inconsistent policy, biased decisions, or outdated definitions with impressive accuracy.
Teams also compare methods using the wrong standard. A clustering model should not be criticized for failing to predict a label it was never trained to predict. A supervised model should not be trusted because it performed well on an unrealistic test split.
Neither approach ends at deployment. Customer behaviour changes, sensors are replaced, products evolve, and label definitions drift. Both supervised and unsupervised systems need monitoring and periodic review.
Final Thoughts
The distinction in supervised vs unsupervised learning comes down to the information available during training and the kind of result the project needs. Supervised learning uses labelled examples to predict defined outcomes. It is usually the clearer choice for classification, regression, and ranking when dependable historical answers exist.
Unsupervised learning works without a target answer. It is better suited to exploration, clustering, dimensionality reduction, representation learning, and some anomaly-detection problems.
Start with the decision the system must support. Check whether a trustworthy label exists, how success will be measured, and what happens when the model is wrong.
When the answer is already defined, supervised learning usually provides the more direct path. When the structure is still unclear, unsupervised learning can reveal what deserves closer investigation before the organization turns it into a formal prediction problem.