
How to evaluate an AI model requires looking beyond misleading surface metrics like overall accuracy. To evaluate an AI model effectively, you must match evaluation metrics to your specific business goals and operational risk.
High accuracy often masks critical failures on imbalanced datasets, where a system can achieve 99% accuracy while missing every high-priority case. Instead, focus on Precision to minimize false alarms, Recall to catch every critical instance, and the F1-Score to balance both.
Adjusting decision thresholds aligns model performance with real-world tolerance for error. Crucially, while classification relies on precision and recall, regression, recommendation, and generative AI models require tailored metrics like RMSE, ROUGE, or semantic vector distance.
How to Evaluate an AI Model Starts With the Error
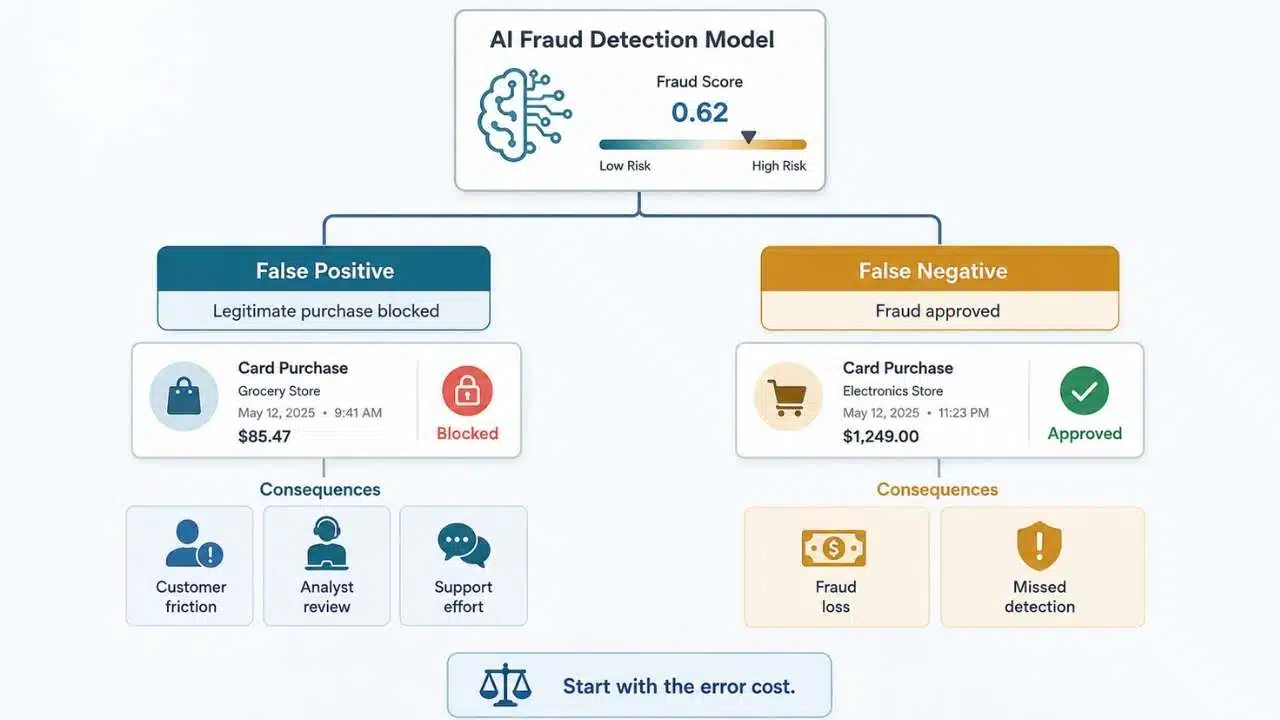
Consider a system that flags potentially fraudulent transactions. There are two obvious ways it can fail.
A legitimate purchase may be labelled as fraud. That is a false positive. The customer may be blocked, an analyst may need to investigate, and support may have to repair the experience. The model may also approve a transaction that really is fraudulent. That is a false negative.
Both predictions are wrong. Their consequences are very different. This distinction appears across machine-learning products.
A spam filter with too many false positives hides legitimate mail. A factory inspection model with too many false negatives lets defects through. A content-moderation system may need particularly strong precision before automatically removing material.
Before comparing models, write down what each error means in the actual workflow. Metric selection becomes much easier after that.
Start With the Confusion Matrix
For a binary classifier, every prediction falls into one of four groups:
| Predicted Positive | Predicted Negative | |
| Actually Positive | True Positive | False Negative |
| Actually Negative | False Positive | True Negative |
- A true positive is a positive case the model correctly detects.
- A true negative is a negative case it correctly rejects.
- A false positive is a negative case incorrectly labelled positive.
- A false negative is a positive case the model misses.
This small table often tells a product team more than the headline score. Two models can both report 93% accuracy while one creates twice as many false alarms and the other misses twice as many real positives. If those errors carry different costs, the models are not operationally equivalent.
Accuracy Is Useful Until the Dataset Makes It Misleading
Accuracy is straightforward:
Accuracy = (TP + TN) / (TP + TN + FP + FN)
If the model gets 920 of 1,000 cases right, its accuracy is 92%. That can be a perfectly sensible metric when the classes are reasonably balanced and different errors carry similar consequences.
Problems arise when the data is heavily imbalanced.
Imagine 10,000 transactions:
- 9,900 are legitimate.
- 100 are fraudulent.
A classifier predicts “legitimate” every time.
It gets 9,900 predictions right and reports:
99% accuracy
It also identifies:
0 fraudulent transactions
The calculation is correct. The model is useless for detecting fraud.
This is why accuracy should rarely stand alone when one class is much rarer or more important than another. Balanced accuracy can help because it gives more visibility to performance across classes, but the confusion matrix and class-level metrics are still worth examining.
Precision Tells You Whether Positive Predictions Are Worth Trusting
Precision asks:
When the classifier says something is positive, how often is it right?
Precision = TP / (TP + FP)
Suppose a fraud model raises 140 alerts.
Eighty are genuine fraud cases. Sixty are legitimate.
Its precision is:
80 / 140 = 57.1%
That means a little over half of its alerts are correct.
Is that acceptable? The metric alone cannot answer.
If every alert goes into a quick analyst review, 57% precision may be workable. If an alert automatically freezes a customer’s account, the same performance could create far too much damage.
Precision deserves particular attention when acting on a positive prediction is expensive, disruptive, or difficult to reverse. A model can also achieve high precision by being extremely conservative and predicting “positive” only when it is almost certain. That may sound good until you see how many positives it missed.
Recall Measures How Much of the Real Problem You Found
Recall looks at the other side:
Of all the genuine positive cases, how many did the model detect?
Recall = TP / (TP + FN)
If 100 transactions are fraudulent and the model catches 80:
Recall = 80%
It found four out of five fraud cases.
Recall becomes especially important when missing a positive case carries a high cost.
A first-stage medical or safety screening workflow, for example, may place strong emphasis on sensitivity to possible positives before a qualified professional performs further assessment. A manufacturing inspection system might similarly prefer to send extra parts for inspection rather than miss a critical defect.
Higher recall often brings more false positives. That is why asking whether precision or recall is “better” is usually the wrong question. The important issue is where the product should operate between them.
The Threshold Can Matter as Much as the Model
Many classifiers do not initially output a hard yes-or-no answer. They produce a score.
For example:
- Case A: 0.92
- Case B: 0.68
- Case C: 0.47
- Case D: 0.13
The classification threshold decides which cases count as positive.
At a threshold of 0.50, A and B are positive.
Move it to 0.40 and C becomes positive too.
Lowering the threshold generally catches more positive cases, increasing recall. It can also create additional false positives and reduce precision.
Raising the threshold makes the model more selective. This is why 0.50 should not automatically become the production setting simply because a library uses it as a convenient default.
The operating threshold should reflect what happens after the prediction. A model sending suspected fraud to a human-review queue can tolerate a different threshold from one that blocks transactions automatically. Choose the threshold using validation data. Do not keep tuning it against the final test set until the score looks good.
F1 Is Helpful, but It Still Makes a Value Judgment
F1 combines precision and recall:
F1 = 2 × (Precision × Recall) / (Precision + Recall)
With precision at 57.1% and recall at 80%, F1 is roughly 66.7%.
F1 is often useful for imbalanced classification because it prevents strong performance on the majority negative class from dominating the score.
It is not automatically the “best” classification metric.
Standard F1 gives precision and recall equal weight. Many real systems do not.
It also leaves true negatives out of the formula.
If missing an actual positive matters substantially more than creating a false alarm, teams can consider an F-beta score that gives recall greater weight. In other situations, estimating the real cost of each error may be more useful than compressing everything into F1. Use F1 because it matches the decision, not because it appears more advanced than accuracy.
Multiclass Models Can Hide Problems Inside an Average
Consider a support classifier assigning tickets to:
- billing;
- technical support;
- cancellations;
- fraud;
- account access.
Technical support might account for most incoming tickets. Excellent performance there can push the overall score upward while the much smaller fraud class performs poorly.
For an important multiclass system, inspect each class.
Averages answer different questions:
Macro average gives every class equal weight. A small fraud category therefore matters as much as technical support. Weighted average weights each class by how often it appears, so larger classes influence the result more. Micro average combines the underlying true-positive, false-positive, and false-negative counts before calculating the metric.
There is no universally correct choice.
Macro averaging is particularly useful when poor performance on smaller classes should remain visible. Weighted averages better reflect the observed dataset, but that same property can hide weakness in rare categories.
Publishing only one average is often too convenient.
ROC-AUC and Precision-Recall Curves Show Performance Across Thresholds
Accuracy, precision, recall, and F1 usually describe one chosen threshold. Sometimes the question is whether the model ranks positive examples above negative ones across many possible thresholds.
That is where ROC analysis helps.
The ROC curve plots true-positive rate against false-positive rate as the threshold changes. ROC-AUC summarizes that ranking behavior. One useful interpretation of ROC-AUC is the probability that a randomly selected positive example receives a higher score than a randomly selected negative example.
It is a ranking measure, not a deployment threshold.
A model can have excellent ROC-AUC while performing poorly around the specific threshold range the product needs. For very imbalanced classification, a precision-recall curve can be more revealing because it shows what happens to precision as the system tries to recover more positive cases. The practical advice is simple: inspect the part of the curve where the product may actually operate.
Probability Scores Need Another Check: Calibration
Suppose a risk model outputs 0.80.
Does that mean the event really happens roughly 80% of the time among comparable cases receiving similar predictions? Only if the model is reasonably calibrated. A classifier can rank cases extremely well while producing poor probability estimates.
This matters whenever the score is used for:
- risk prioritization;
- staffing;
- pricing;
- analyst queues;
- escalation;
- resource allocation.
Calibration curves, also called reliability diagrams, compare predicted probability with observed outcomes. Do not assume a strong AUC makes the model’s probabilities trustworthy. Ranking and calibration are separate properties.
Bad Test Data Can Make Every Metric Look Better Than It Is
Teams often spend more time debating F1 versus recall than checking whether their evaluation set is trustworthy. That is backwards. A model should be tested on data that did not influence training.
Leakage can happen without anyone deliberately copying test rows into the training set. Suppose a team calculates a normalization value using the entire dataset before creating the train/test split. Information from the eventual test set has already influenced preprocessing.
Feature selection, missing-value imputation, duplicate records, and near-identical samples can create similar problems. Evaluation design also has to match deployment.
If multiple records belong to the same customer, random splitting may put that customer’s data on both sides of the train/test boundary. A group-aware split may provide a more realistic test of performance on unseen customers.
Time-dependent models often require chronological splits. A system intended to predict future behavior should not learn from future records and then be “tested” on the past.
Random 80/20 splitting is useful in some situations. It is not a universal rule.
Slice Performance Before Trusting the Average
Even a properly held-out test set can hide important failures.
Suppose a classifier reports 94% recall overall.
Break that down by device type:
- high-end cameras: 97%;
- current smartphones: 96%;
- older smartphones: 72%.
The global number is still correct. It simply concealed the problem.
Useful evaluation slices may include:
- language;
- geography;
- product category;
- customer segment;
- device type;
- time period;
- acquisition channel;
- demographic groups when appropriate, lawful, and relevant to the system.
This also matters for fairness evaluation. Strong aggregate performance does not prove that smaller groups receive comparable model behavior. Choose slices because they correspond to real differences in deployment, not because examining enough subgroups eventually produces an interesting chart.
Small Score Differences Need Perspective
Model A achieves 91.3% accuracy.
Model B reaches 91.6%.
It is tempting to declare Model B the winner.
That difference may not be stable.
Metrics are estimates produced from a particular evaluation sample. Dataset size, class prevalence, task diversity, and sampling variation all affect how confidently small differences can be interpreted.
This is especially relevant for modern AI benchmarks where performance may be summarized from a finite set of heterogeneous questions.
NIST’s recent work on AI evaluation distinguishes the score observed on a benchmark from performance expected across the wider population of comparable tasks.
Do not make a costly model migration because one score increased by a few tenths of a percentage point without checking whether the gain is meaningful and repeatable.
A Worked Example Shows Why Context Matters
Consider 1,000 evaluation cases:
- 100 are actually positive;
- 80 are correctly detected;
- 20 are missed;
- 60 negative cases are incorrectly flagged;
- 840 negatives are correctly rejected.
The model produces:
- Accuracy: 92%
- Precision: 57.1%
- Recall: 80%
- F1: 66.7%
Is it good enough?
If every false positive launches a costly manual investigation, probably not. If missing a positive event creates a much larger loss and reviewing alerts is inexpensive, the model may already be useful.
The 92% accuracy did not change. The decision changed because the operating context changed. That is what model evaluation is supposed to capture.
How to Evaluate an AI Model in Practice
For a classification system, a useful process is:
- Define the prediction clearly. Decide what counts as positive and negative.
- Map the cost of each error. Include money, customer friction, staff time, safety, and missed opportunities where relevant.
- Establish a baseline. A complex model should beat a simple rule or dummy classifier on the metric that matters.
- Build the split around production reality. Use grouped or chronological evaluation when random splitting would create leakage.
- Inspect the confusion matrix and per-class results.
- Choose complementary metrics. Accuracy, precision, recall, F1, AUC, or balanced accuracy should answer specific questions.
- Set thresholds on validation data.
- Check calibration when probabilities drive decisions.
- Slice results across important production segments.
- Keep the final test set genuinely separate.
Evaluation should continue after deployment. Customer behavior changes. Fraud tactics change. Products change. Labeling rules change. Input distributions drift. Passing an offline test once is not proof that a model will remain reliable indefinitely.
Accuracy, Precision, and Recall Do Not Cover Every AI Model
Knowing how to evaluate an AI model also means knowing when these metrics stop fitting the task. Regression models predicting values such as demand or delivery time may use measures including mean absolute error or root mean squared error.
Search and recommendation systems care about which results appear near the top and may use metrics such as precision@k, recall@k, or other ranking measures.
Generative AI requires task-specific evaluation.
Depending on the application, teams may need to measure:
- factual correctness;
- retrieval quality;
- instruction following;
- tool-call success;
- output-schema validity;
- safety behavior;
- latency;
- task completion;
- human preference.
A model scoring 90% on a benchmark does not automatically have a 90% success rate in your production workflow. The evaluation must support the claim you actually want to make.
Final Thoughts
Learning how to evaluate an AI model is not mainly about memorizing four formulas. Accuracy tells you how often a classifier is correct. Precision tells you how dependable its positive predictions are. Recall shows how much of the positive class it finds. F1 summarizes one part of that trade-off.
The harder decisions sit around those numbers. Define which mistakes matter. Use genuinely unseen and representative data. Watch for leakage. Inspect individual classes and meaningful user segments. Set thresholds around the workflow rather than accepting a default. Check calibration if probability scores drive action.
Most importantly, avoid reducing model quality to one percentage on a dashboard. A model is ready when its mistakes, uncertainty, and operating behavior are acceptable for the decision it will actually be trusted to make.