

Tools for Flagging Missing Data in an Agency Reporting Dashboard help you catch a broken connector, a stale feed, or an incomplete client report before an empty chart is mistaken for a real result. The useful choice depends on what is missing: a source refresh, expected records, a metric value, or the whole dashboard tile. Most reporting platforms can alert on a proxy such as a refresh failure, an unusual metric, or a threshold. Few automatically know that a client’s expected data never arrived unless you define that expectation.
What we checked
On November 20, 2026, we reviewed official product documentation for AgencyAnalytics, Databox, and Klipfolio, focusing on anomaly or threshold alerts, refresh failures, and the evidence an alert gives an agency operator. We also checked current official documentation for Whatagraph, Microsoft Power BI, Tableau, and Google Looker Studio. This was documentation research, not account testing: no paid workspaces, connectors, client data, or alert workflows were run. Features and access can vary by plan, connector, and workspace, so confirm the current setup before adopting a tool.
One distinction guides the comparison. A metric falling to zero may be a genuine business result; an absent row may mean the source did not refresh; a populated but old chart may be stale. Your monitoring rule should test those states separately. For background on data-quality measures such as completeness and timeliness, see the NIST discussion of data-quality indicators. It is general guidance, not a feature endorsement for any vendor below.
At a glance: tools for flagging missing data in an agency reporting dashboard
| Tool | Useful signal | Best fit | Main limitation |
|---|---|---|---|
| AgencyAnalytics | KPI conditions and metric anomalies | Agencies that report through its client dashboards | Alerts focus on metrics and supported widgets; they do not prove every expected row arrived. |
| Databox | Metric notifications and sync troubleshooting | Teams already centralizing KPIs in Databox | Metric alerts depend on synced values; check how stale or absent data is represented. |
| Klipfolio | Data-source refresh-failure emails and history | Operators who need a connector-level failure trail | A successful refresh can still contain incomplete source data. |
| Whatagraph | Scheduled report refresh error panels | Teams that need report-level refresh visibility | Scheduled refresh is documented as beta and is not a completeness audit. |
| Microsoft Power BI | Dashboard tile threshold alerts | Microsoft-centric reporting stacks | Thresholds are not a general missing-row detector. |
| Tableau | View alerts and data-source failure notices | Teams with governed Tableau dashboards | Alert support depends on the view and numeric measure; it does not cover every missing-data pattern. |
| Looker Studio | Data-freshness settings and last-refresh visibility | Teams that need to see how old a report’s data may be | Freshness visibility is not the same as a proactive alert that records are missing. |
1. AgencyAnalytics: metric alerts inside an agency reporting workflow
AgencyAnalytics offers KPI tracking with conditions and time intervals, plus Metric Insights that can flag unusual rises or drops for supported line and area widgets. This is useful when the dashboard already carries an expected performance range: a sudden blank or sharp dip can prompt someone to inspect the connector and source. It also keeps the warning close to the client-reporting context rather than in a separate monitoring console.
The signal is still a metric signal. A missing campaign row might not trigger an alert if the remaining rows keep the total within range, and an integration can refresh successfully while returning only part of the expected data. Pair platform alerts with an explicit source freshness check and, for important tables, a count of expected versus received client records. Confirm which widget types and alert conditions your account supports.
2. Databox: thresholds for KPIs, with a separate sync investigation
Databox lets a user create metric notifications using a condition, comparison period, and notification frequency, with delivery options such as email, mobile, or Slack. That makes it practical for agencies that already use Databox to assemble client KPIs and want an owner to know when a monitored value crosses a limit. Its documentation also describes common data problems caused by failed connections, inactive accounts, or sync timing.
Use those capabilities as two checks: a metric rule for the business value and a source-health routine for whether the value is current. Databox notes that metrics sync according to product and usage behavior; a notification can reflect the latest sync rather than a continuous stream. The team should decide how to identify a stale or missing metric and whether that state is visible to recipients who only have dashboard access.
3. Klipfolio: connector failure details for the person fixing the feed
Klipfolio documents email notifications for data-source refresh failures, including the source name, error message, timestamp, and a link to the source or error log. Its refresh history can help an operator review failed sources and the last refresh date. That detail is valuable when an agency needs to route a problem to the person who owns credentials or a third-party connection.
A failed refresh is only one failure mode. If a connector succeeds but the upstream export omits a client, date range, or campaign, the refresh log may not know that the content is incomplete. Define an expected row count or a required-field check in the source pipeline, and make sure the client-facing report signals that the output is under review. Klipfolio is strongest here as an operational trail, not as a substitute for your data contract.
4. Whatagraph: report refresh errors, with a beta caveat
Whatagraph’s documented scheduled-refresh feature can pre-load reports at selected intervals and surface failed widgets with their errors in a refresh panel. For an agency, that can make an overnight refresh problem easier to spot before a team exports or shares a report. The report-level context may help staff find which widget needs attention rather than treating the whole dashboard as equally healthy.
The feature is labeled beta in the documentation, and refresh failure is not the same as a missing-data check. If a widget refreshes with incomplete values, the report may still load. Verify beta eligibility and behavior in your own workspace, then add a separate completeness check for sources where a partial result could mislead a client.
5. Microsoft Power BI: dashboard tile alerts for threshold breaches
Power BI data alerts are useful when a dashboard tile represents a value that has a meaningful upper or lower bound, such as leads received this week or unprocessed records. A user can set a threshold and receive a notification when the value crosses it after data changes. This can turn a dashboard into a simple watch point for a Microsoft-based reporting team.
Tile alerts are not a general detector for every absent row or stale source. They work on supported dashboard tiles and values; a missing category can disappear without moving the total past the chosen threshold. Keep a separate check for refresh completion and expected dimensions, and make sure alerts belong to a monitored account rather than a former employee’s inbox. Power BI fits best when the agency already governs reports and refreshes in Microsoft’s environment.
6. Tableau: view alerts and source-failure signals for governed teams
Tableau supports data-driven alerts for supported views and measures, with delivery through email, the Tableau site, or Slack integrations. Its documentation also describes notifications for certain data-source failures, such as a source being removed or credentials expiring. Together, those signals can help a BI owner distinguish an unexpected value from a broken connection.
Coverage depends on the view and the underlying measure; alerts are not available for every visualization or missing-value condition. For agency dashboards with many clients, organize the checks around a stable client identifier and date window, then confirm that a failed source does not silently leave an old extract looking current. If your main concern is whether every expected record arrived, calculate and display completeness explicitly.
7. Looker Studio: freshness controls that help teams spot old data
Looker Studio lets report owners manage data freshness for supported sources and shows when data was last updated. That is useful when a client asks whether a dashboard includes yesterday’s results or when a scheduled review depends on a known refresh window. A visible last-refresh time gives the team a practical cue to pause interpretation when a source is older than expected.
Freshness controls do not automatically alert an agency that a particular client’s records are missing. Refresh intervals and available settings differ by connector; some Google marketing and measurement sources use fixed refresh intervals. Treat the timestamp as one input to a monitoring rule, then compare the date and client segments expected with the data actually present. Editorialge’s Looker Studio dashboard guide can help teams think through report setup, while its SEO dashboard workflow explains how to make reporting answer a defined question.
Build a missing-data rule that does not confuse zero with absent
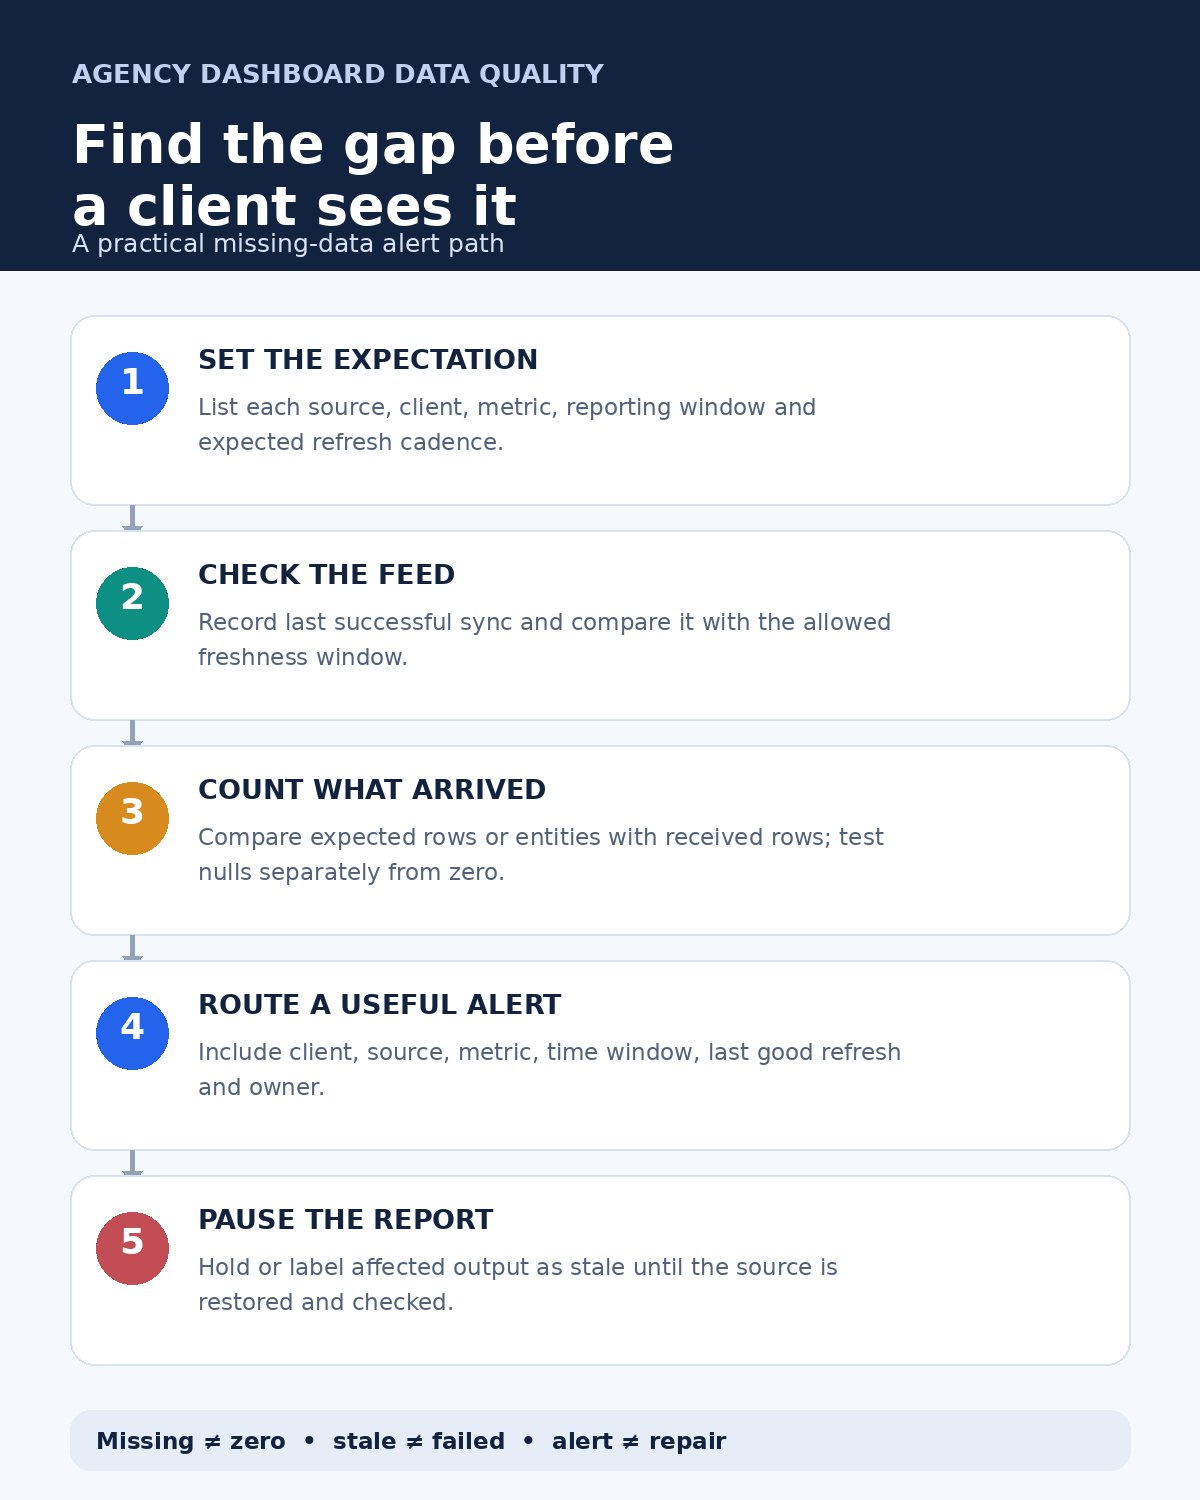
Before choosing a platform, write down what a complete reporting period means for each client. Identify the source, account or property, expected date range, normal refresh cadence, required dimensions, and person who can repair the connection. Then build checks for distinct states:
- Refresh failed: alert on the connector error and include the source, timestamp, and last successful refresh.
- Refresh is late: compare the current time with the agreed freshness window; show the data-through date in the report.
- Records are missing: compare received clients, campaigns, or dates with an expected list, and test required fields for nulls.
- Value is truly zero: retain zero as a valid measurement and avoid substituting it for a missing value.
Send an alert with enough context to act: client name or safe identifier, source, metric, period, last good refresh, failed rule, owner, and a direct repair path. Avoid putting sensitive customer data into email or chat alerts. Until the feed is verified, label or hold the affected report rather than letting a blank chart appear to confirm that nothing happened.
Tools for Flagging Missing Data in an Agency Reporting Dashboard: how to choose
Choose AgencyAnalytics or Databox when you mainly need metric-based warnings in an existing reporting workspace. Consider Klipfolio when refresh-failure details and source history are central to triage. Whatagraph can help with report refresh visibility if your team has access to its beta feature. Power BI and Tableau suit organizations with established BI administration and tile or view alerts. Looker Studio helps surface freshness, but agencies will need another mechanism to test completeness.
Whichever tool you choose, prove the rule with three safe cases before depending on it: a genuinely low value, a stale but otherwise valid source, and an intentionally missing expected row. The best setup is the one that tells your team which case happened, prevents an incomplete report from being presented as current, and gives a named owner a clear next step. These Tools for Flagging Missing Data in an Agency Reporting Dashboard are useful only when the agency defines what “complete” means for each client.