
Have you ever noticed your Node.js application running perfectly fine at first? Then, after a few hours or days, it starts to slow down. Memory usage climbs higher and higher. Eventually, the app crashes or becomes so sluggish that users abandon it. This frustrating problem happens to many developers. It usually points to one culprit: a memory leak.
Memory leaks occur when your code holds onto data it no longer needs, preventing the garbage collector from cleaning it up. That’s why knowing exactly how to debug memory leaks in Node.js is the one thing that will change everything for you. A 2025 Medium report found that memory leaks account for a huge portion of performance problems in production apps across the US.
Many developers miss these issues during testing because they only show up after extended use. I am going to walk you through the exact steps I use to find and fix these resource drains.
Understanding Memory Leaks in Node. js
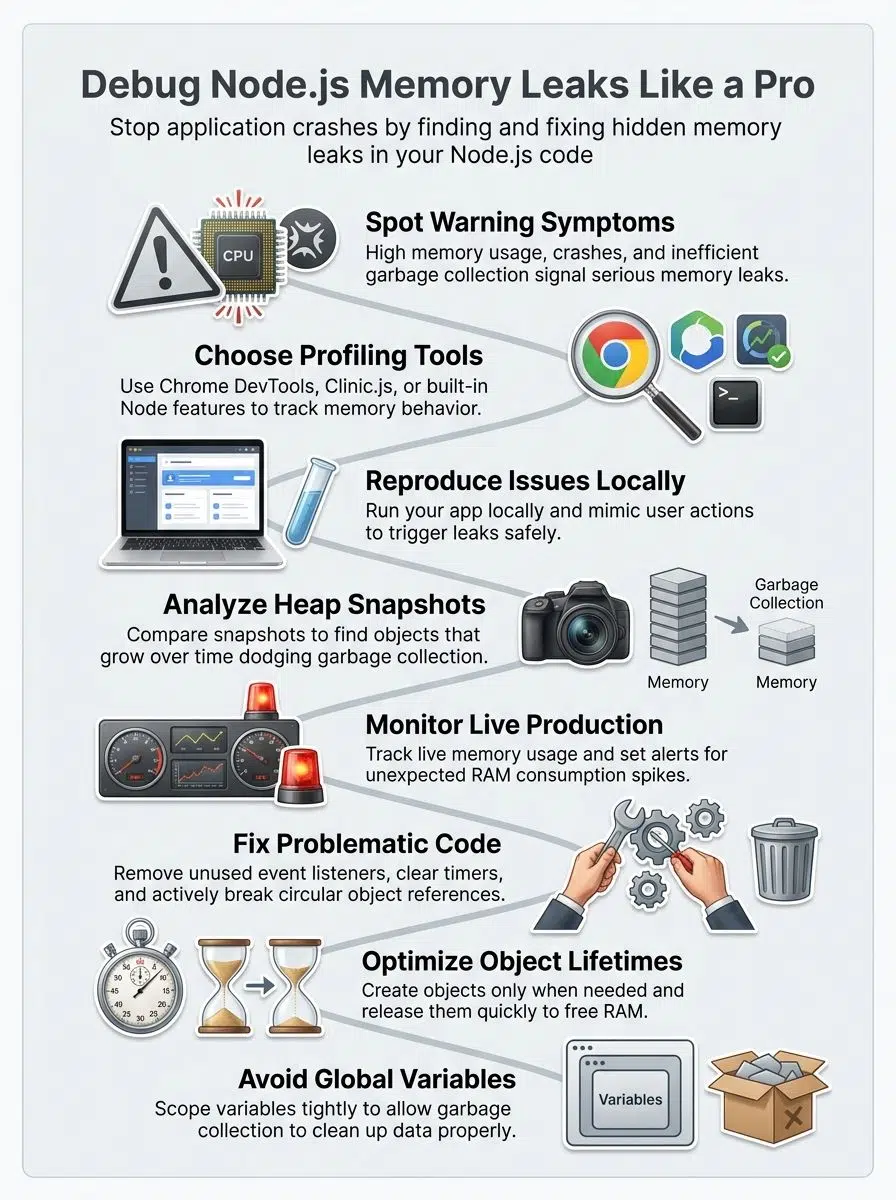
Memory leaks in Node.js happen when your application holds onto objects that it no longer needs. Your program keeps these objects in memory, so the garbage collection process cannot remove them.
Over time, this unused data piles up and consumes more and more RAM. The application slows down, crashes, or becomes unresponsive. Think of it like a storage unit you keep paying for, even though you stopped using it years ago.
Node.js runs on a single thread utilizing Google’s V8 JavaScript engine. This makes memory management critical. By default, the V8 engine limits heap memory to about 1.4 GB on standard 64-bit US cloud instances. Every byte of wasted memory affects your entire application performance.
Memory leaks are silent killers in production environments, slowly draining resources until your application collapses.
Several things cause memory management problems. A 2025 case study from a US fintech company revealed that an unbounded in-memory LRU cache caused their garbage collection time to spike from 50 milliseconds to 900 milliseconds.
Event listeners that never get removed create problems. Circular references trap objects in memory permanently. Global variables accumulate data throughout your application’s lifetime.
Common Symptoms of Memory Leaks
To debug memory leaks in Node.js, you have to understand the common symptoms of memory leaks.
High memory usage over time
Your Node.js application starts lean and mean, but then something strange happens. Memory consumption climbs higher and higher as time passes.
The application keeps using more RAM, even when you are not adding new features or handling more traffic. This creeping growth is a classic sign of memory leaks.
Heap snapshots reveal the culprit. Objects pile up in memory instead of getting cleaned up. Performance optimization becomes impossible when memory usage spirals out of control.
To check your current usage locally, you can use the built-in process.memoryUsage() function. US developers on the r/node subreddit recommend watching your Resident Set Size (RSS) metric.
Watch out for these specific metrics:
- Resident Set Size (RSS): Total memory allocated for the process execution.
- Heap Total: Total size of the allocated heap.
- Heap Used: Actual memory used during the execution of your program.
Inefficient garbage collection
Garbage collection in Node.js should clean up unused objects automatically. Sometimes it falls behind and leaves dead code sitting around like forgotten luggage at an airport.
This slowdown happens when the garbage collector cannot keep pace with how fast your app creates new objects. Your application memory usage climbs steadily, even though nothing new is happening.
Inefficient garbage collection often signals that something in your code is holding onto references it should not hold.
Memory leaks are like slow poison; they do not kill your application instantly, but they will eventually bring it down.
Spotting inefficient garbage collection requires watching your memory profiling data closely. Look for patterns where memory usage spikes after garbage collection runs, then does not drop back down to normal levels.
Application crashes or slowdowns
Your Node.js application crashes or slows down when memory leaks drain your system resources. These problems happen because your app holds onto data it no longer needs.
Your server struggles to allocate new memory for incoming requests, and performance tanks fast. Users experience lag, timeouts, and frozen screens. The application might even shut down without warning, leaving you scrambling to figure out what went wrong. Spotting these warning signs early saves you headaches later.
Your CPU usage spikes as the system fights to manage bloated memory consumption. Response times get slower and slower until your app becomes nearly unusable.
Tools for Debugging Memory Leaks
There are multiple tools for debugging memory leaks in Node.js. Node.js also has built-in tools to track down problems.
Node.js built-in tools
Node.js comes with several built-in tools that help you track down memory problems without extra software. The –inspect The flag lets you run your application with debugging enabled.
This approach gives you direct access to heap snapshots. The snapshots show exactly what objects sit in your application memory at any given moment.
Useful built-in commands include:
- node –inspect: Starts your app in debug mode.
- –max-old-space-size: Controls the maximum memory limit.
- process.memoryUsage(): Returns an object describing memory usage.
You can capture multiple snapshots over time and compare them to spot objects that refuse to disappear. The heapdump module also works alongside Node.js to export heap snapshots programmatically.
Chrome DevTools for Node.js
Built-in tools give you a solid foundation, but Chrome DevTools takes memory profiling to the next level. This browser-based debugger works with Node.js applications and shows you exactly where memory goes.
You can connect your running Node.js server to Chrome DevTools by visiting chrome://inspect in your browser. The interface displays heap snapshots, memory allocation timelines, and garbage collection events all in one place. This visual approach makes spotting memory leaks far easier than reading raw data from command-line tools.
Chrome DevTools excels at comparing heap snapshots across different points in your application lifecycle. Take one snapshot when your app starts, then capture another after running specific operations. The tool highlights objects that stick around when they should disappear.
Third-party profiling tools
Third-party profiling tools give you powerful ways to track memory consumption in your Node.js applications. For open-source local analysis, Clinic.js by NearForm is an incredible option.
Its Clinic Doctor and Clinic Flame features generate visual HTML reports of your memory allocation. These platforms capture real-time data about how your app uses memory.
For production servers in the US, many companies choose between New Relic and Datadog. Here is a quick look at how their 2026 pricing and features compare for US users:

| Platform | US Pricing Structure | Best Use Case |
|---|---|---|
| Datadog | Starts at $15 per host/month. | Complex multi-cloud environments require deep security integrations. |
| New Relic | $99 per core user/month plus $0.30 per GB of data ingested. | Teams need an all-in-one pricing model with simple application tracking. |
These tools let you set up alerts that notify you when memory consumption spikes unexpectedly. By using profiling tools alongside heap snapshots, you get a complete picture of your application performance.
Steps to Debug Memory Leaks
By following some steps, you can easily debug memory leaks in Node.js.
Reproduce the issue locally
Start by running your Node.js application on your own computer, not in production. This step matters because you need to see the memory leak happen in a safe space.
Open your terminal and launch your app with the same settings you use on your live servers. Let the application run for a while, maybe thirty minutes to an hour. Watch how much memory it uses over time. If the memory consumption keeps climbing without stopping, you have found your culprit.
To reproduce the issue locally, mimic the exact actions that trigger the problem. Use a tool like Apache Benchmark to simulate 50 concurrent users on your home page to force the issue to appear. This local testing protects your production environment while you hunt for the resource leaks.
Capture and analyze heap snapshots
Heap snapshots capture your application memory state at a specific moment in time. You can take these snapshots using Node.js built-in tools or Chrome DevTools.
A 2026 profiling guide by OneUptime recommends a specific three-snapshot technique for the best results:
- Take Snapshot 1 as your baseline right after the app starts.
- Run a heavy load test on your application.
- Force a garbage collection using the trash can icon in Chrome DevTools.
- Take Snapshot 2.
- Run another heavy load test and force garbage collection again.
- Take Snapshot 3, then use the “Comparison” view to check Snapshot 1 against Snapshot 3.
Analyzing heap snapshots requires you to look for objects that grow larger over time without shrinking back down. Focus on objects that appear in multiple snapshots, as these are your main suspects.
Monitor memory usage in production
Snapshots show you what happened in your code, but production tells the real story. Your application runs differently when real users interact with it.
Tools like Node.js built-in profiling features and third-party resource monitoring solutions track how much memory your app uses over time. You can spot trends, catch spikes, and identify when garbage collection fails.
This real-world data beats any lab test because it reflects actual user behavior and traffic patterns. Set up alerts that notify you when memory usage climbs above safe levels. Most production monitoring tools let you establish thresholds to prevent costly downtime.
Identify and fix problematic code
Once you spot memory leaks through heap snapshots and resource monitoring, the real work starts. Look at your code and find where objects stay in memory too long. Event listeners that never get removed act like anchors. Circular references between objects create chains that garbage collection cannot break.
Fixing problematic code means being direct and practical. Common fixes include:
- Replacing .on() with .once() for single-use event listeners.
- Clearing intervals clearInterval() when they finish their job.
- Setting unneeded object references to null.
Test each fix by running new heap snapshots and watching your memory usage drop. Small changes often make big differences in application performance.
Best Practices to Prevent Memory Leaks
By following some best practices, it’s easy to prevent memory leaks in Node.js.

Optimize object lifetimes
Objects in your Node.js app hold memory until garbage collection kicks in. You control how long objects stick around by managing their lifetimes carefully.
Create objects only when you need them, then let them go as soon as possible. Avoid keeping references to objects that your code no longer uses.
This practice cuts down on memory consumption and helps garbage collection work faster. Short-lived objects disappear quickly, which means your heap stays cleaner.
Circular references create tricky situations where objects point to each other and never get cleaned up. Break these chains by setting references to null when you finish using them.
Avoid global variables
Global variables act like open doors in your code, letting memory leak right through them.
Your application holds onto data stored in global scope, and garbage collection cannot release it. This means your memory usage climbs higher and higher as your app runs.
Local variables get cleaned up automatically once functions finish executing. Scope your variables tightly, and you give your garbage collection system the chance to do its job properly.
A variable declared at the top level persists for your entire application lifetime, consuming resources that could go elsewhere. Instead, pass data through function parameters and return values.
Regularly monitor memory usage
Monitoring memory usage on a regular basis keeps your Node.js application running smoothly. Set up continuous resource monitoring in your development environment, staging servers, and production systems.
A popular approach for US server setups is using PM2 as a process manager. You can configure the max_memory_restart setting in PM2 as a safety net to automatically restart your app if it exceeds a specific RAM threshold.
Tools like Node.js built-in profiling options and third-party solutions track how much memory your code consumes over time. Memory profiling reveals which parts of your code hog resources.
Track memory consumption patterns during peak usage hours, and compare results across different versions of your code. Establish baseline measurements for normal memory usage in your application.
Wrapping Up
Memory leaks in Node.js applications do not have to remain a mystery. You now have the knowledge and strategies to fix them. Start with heap snapshots to see what is happening inside your application memory. Use Chrome DevTools or Clinic.js to capture the data you need.
Then, dig into the results and find those problematic code sections that hold onto resources too long. The garbage collection process works best when you help it along by writing cleaner code. Your application performance depends on what you do next. Apply the best practices we discussed to keep object lifetimes short. Skip global variables, and monitor memory usage regularly.
Resource monitoring becomes your best friend in production environments. Test your fixes thoroughly before pushing them live. Track your memory consumption over time to catch new issues early. The effort you put into debugging and prevention today saves you from crashes and slowdowns tomorrow.
Frequently Asked Questions (FAQs) on How to Debug Memory Leaks In Node.js
1. What is a memory leak in Node.js applications?
A memory leak happens when your Node.js app allocates memory for objects or data but never releases it back to the system. This causes memory usage to climb steadily over time until your app slows to a crawl or crashes.
2. How do I spot a memory leak in my Node.js code?
Watch for steadily climbing memory usage with Chrome DevTools while your app runs under normal load. If the heap size keeps growing over hours, even when traffic is steady, you’ve found your leak.
3. What steps should I take to debug these leaks?
Take heap snapshots with Chrome DevTools at different intervals and compare what’s accumulating. You can also use Clinic.js, which automatically profiles your app and pinpoints where memory is growing.
4. Can certain coding habits help prevent future leaks?
Yes, always clean up event listeners with removeListener() and timers with clearInterval() when you’re done with them. Don’t let database connections stay open or keep big objects referenced in closures longer than necessary. Node.js debugging guides consistently identify forgotten event listeners as one of the top causes of memory leaks.