Capital allocation defines startup survival. High-level industry reports highlight a $740+ billion global ad market, but market scale alone does not guarantee a profitable return on your next marketing dollar. Evaluating key digital marketing statistics for founders requires focusing on unit economics over vanity metrics: Customer Acquisition Cost (CAC), lifetime value, real channel yield, and emerging attribution challenges.
As Google shifts toward zero-click AI Overviews and paid ad inflation squeezes margins, sustainable growth relies on compounding asset efficiency. The following 2026 benchmarks trace the path from macro spend shifts down to company-level unit metrics—equipping founders to make precise channel, measurement, and budget adjustments.
What Market-Size Reports Usually Miss
Industry totals describe the advertising market. They do not describe the health of an individual business. Gartner’s 2025 survey found that marketing budgets averaged 7.7% of company revenue. The figure is often repeated as a budgeting rule, but the survey covered 402 marketing leaders in North America, the UK, and Europe, mostly at businesses earning more than $1 billion annually. It is a large-company benchmark, not a sensible default for a startup with limited runway.
Digital marketing ROI stats have similar limits. In a 2025 Litmus survey of nearly 500 marketing professionals, 35% reported email returns between $10 and $36 per dollar spent, while 30% reported between $36 and $50. Yet 21% did not measure email ROI. These are self-reported ranges, not guaranteed economics. External data becomes useful only when paired with paid and blended CAC, gross-margin-adjusted payback, conversion, retention, and contribution margin.
12 Digital Marketing Statistics for Founders
1. Global Advertising Spend Is Forecast to Reach $1.06 Trillion
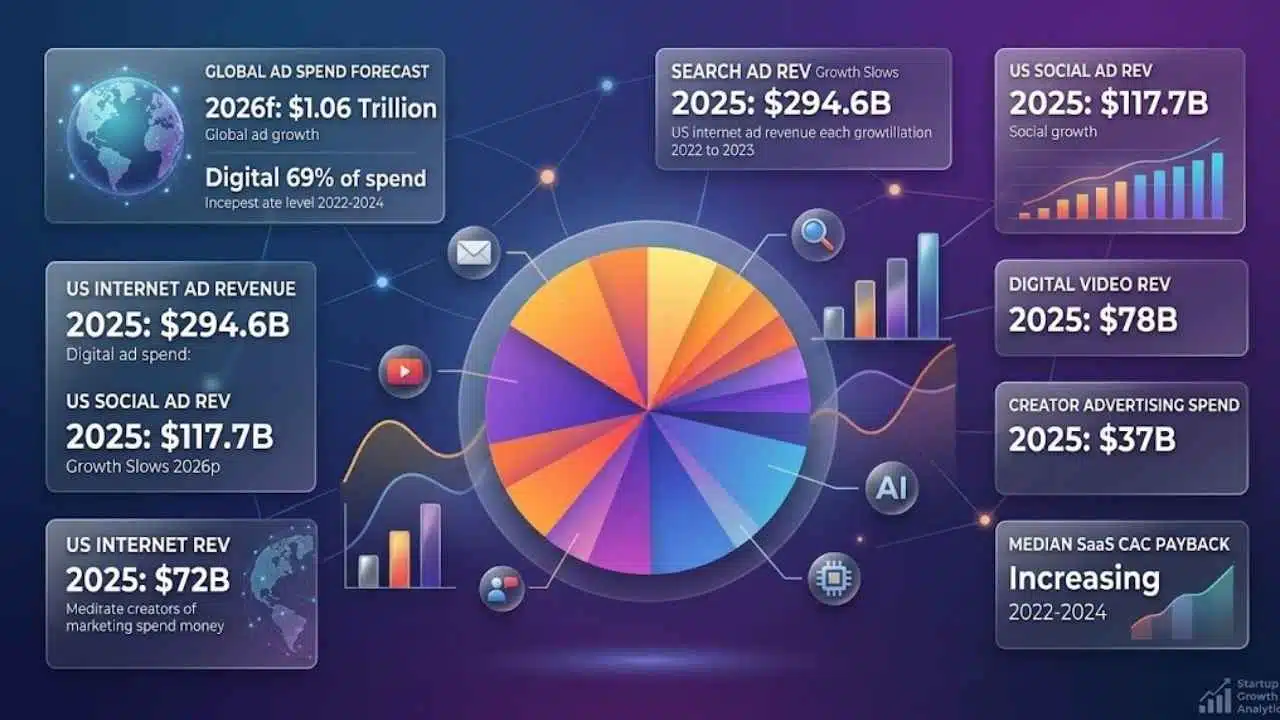
Dentsu’s May 2026 forecast puts worldwide advertising spending at $1.06 trillion for the year, up 5% after estimated growth of 5.8% in 2025. Digital is expected to represent 69% of spending across the 56 markets covered.
This is one of the defining 2026 digital ad spend statistics, but it signals competition as much as opportunity. More money entering auction-based platforms can increase the price of reaching familiar audiences. Before raising bids, set the maximum acquisition cost the company’s margins and cash position can support.
2. US Internet Advertising Revenue Reached $294.6 Billion
US internet advertising revenue rose 13.9% to $294.6 billion in 2025, based on the IAB report conducted by PwC. The estimate uses information supplied by companies selling online advertising, supplemented by public corporate data. PwC does not audit those submissions.
The figure represents revenue earned by advertising sellers, not the return achieved by any one buyer. Startups also compete with established brands, political advertisers, marketplaces, and experienced performance teams. Their advantage is focus: a narrower audience, clearer offer, and better conversion path can matter more than a larger campaign.
3. Search Revenue Hit $114.2 Billion as Growth Slowed
Search generated $114.2 billion in US advertising revenue during 2025, an 11% annual increase. That was slower than the 15.9% growth recorded for 2024. Dentsu’s global outlook projects only 3.4% search growth in 2026 as AI answers, retail platforms, and social search compete with traditional search engines.
Search remains valuable because it can capture existing intent. Founders should separate high-intent commercial queries from broad informational traffic and compare them by qualified pipeline or completed purchases. Click volume alone may rise while the proportion of visitors ready to buy declines.
4. US Social Advertising Revenue Grew 32.6%
Social advertising revenue reached $117.7 billion in the US in 2025, up 32.6%. IAB lists it as 40% of total digital advertising revenue. That percentage cannot be added neatly to the report’s video, commerce-media, and display shares. The categories are not mutually exclusive; social advertising can also contain video or commerce formats.
The pace of growth still matters, although its value varies by business. A visually demonstrable consumer product has more room to test short videos than a specialist B2B product with a small buying committee.
Low-cost reach can hide weak purchase intent. Compare social campaigns by qualified actions and customer quality, not by impressions alone.
5. Digital Video Revenue Rose to $78 Billion
US digital video advertising revenue increased 25.4% to $78 billion in 2025. IAB’s category covers connected television, social video, online video, and short-form formats.
For smaller companies, the pressure to produce a constant stream of video can become expensive. Test the sales argument before investing heavily in production. Simple product demonstrations, objection-focused explanations, and customer-problem scenarios can show which message earns qualified attention. Polished creative cannot rescue an offer customers do not understand.
6. Commerce Media Generated $63.4 Billion in the US
US commerce-media revenue grew 18% to $63.4 billion in 2025. Europe reported €13.3 billion in retail-media spending, up 16.7%, but its definition is narrower: retailer-owned and operated on-site search and display.
Commerce media matters most to brands selling through retailers or marketplaces where advertising sits close to the transaction. Measurement may be clearer, but the retailer controls the environment, reporting, and much of the customer relationship.
Before expanding the budget, check whether sponsored sales are incremental or replacing purchases that would have occurred organically. Marketplace dashboards rarely settle that question. Controlled pauses, geographic tests, or product-level comparisons can provide a better view.
7. Creator Advertising Reached $37 Billion
US creator advertising spending reached $37 billion in 2025, and IAB projects $44 billion for 2026. Niche creators may offer credible access to a profession, hobby, or local community. The operational work is easy to underestimate: audience vetting, disclosure requirements, claim approval, content rights, and attribution all need attention.
Follower count is a weak buying criterion. Relevant viewers, believable delivery, and measurable downstream action are more useful.
8. European Digital Advertising Reached €131 Billion
Digital advertising spending across 30 European markets reached roughly €131 billion in 2025, up 10.5% in nominal terms and 9.4% after inflation adjustment. Video grew 19.6%, social rose 19.2%, and paid search increased 8.8%.
The regional total hides uneven conditions. Western European markets such as France, Italy, Spain, and the Netherlands grew by around 10%, while Nordic and Baltic markets were closer to flat.
The UK’s separate report placed its market at £40.5 billion, up 10%. Search represented 44% of UK spending, while video and social grew faster. IAB UK adopted a revised methodology and restated 2024 to support the comparison, so its latest results cannot be reconciled directly with earlier editions.
A US campaign cannot simply be translated and expected to deliver the same CAC across Europe. Localize the offer, bids, creative, consent process, and measurement. Regional averages also hide large differences, so report performance by market whenever the budget allows.
9. Six Billion People Were Online in 2025
The International Telecommunication Union estimated that 6 billion people, or 74% of the global population, used the internet in 2025. About 2.2 billion remained offline.
Access varies sharply. Internet use reached an estimated 94% in high-income countries but only 23% in low-income countries. Europe, the Americas, and the Commonwealth of Independent States recorded adoption between 88% and 93%, compared with 36% in Africa.
Internet users are not automatically an addressable market. Payment access, language, delivery coverage, connection quality, and purchasing power narrow the opportunity. Start with people who can use and buy the product, not everyone who can get online.
10. Social Media User Identities Reached 5.66 Billion
DataReportal estimated 5.66 billion active social-media user identities worldwide in October 2025, equal to 68.7% of the global population. The total rose by 259 million, or 4.8%, over 12 months.
The word “identities” prevents a common planning error. These are not necessarily unique individuals. One person may use several platforms or maintain multiple profiles. Adding the potential reach reported by Instagram, TikTok, LinkedIn, and YouTube will usually exaggerate the unique audience available.
Use platform estimates to plan tests, then use customer records and deduplicated analytics to understand actual reach.
11. Mobile Accounted for 52.57% of Worldwide Page Views
StatCounter recorded mobile devices as the source of 52.57% of worldwide page views in July 2026. Desktop represented 45.93% and tablets 1.5%. Its dataset draws on more than 3 billion monthly page views across over 1 million websites.
This measures page views, not customers or revenue. A B2B software company may still generate most qualified opportunities on desktop, so check device-level conversion before reallocating spending.
Test page speed, forms, pricing tables, payment steps, and calendar booking on real phones. Responsive design does not guarantee a usable acquisition journey.
Baymard’s compiled average puts cart abandonment at 70.22%, based on 50 studies from different years and markets. Treat it as evidence of widespread checkout friction, not a target or universal benchmark for every store.
12. Median SaaS CAC Payback Increased 12.5% From 2022
Benchmarkit’s 2025 B2B SaaS benchmarks found that median CAC payback had increased 12.5% since 2022. Its new-customer CAC ratio also rose 14% in 2024, reaching a median of $2 in sales and marketing expense for every $1 of new-customer annual recurring revenue.
The evidence applies to participating B2B SaaS companies, not every business model. Even within SaaS, CAC payback is closely related to annual contract value. A complex enterprise product can support a different payback period than a low-priced self-service tool.
CAC payback measures how long gross-margin-adjusted customer revenue takes to recover acquisition expenses. It is more revealing than platform-reported return on ad spend. A dashboard can show strong revenue while discounts, sales labor, payment fees, support costs, or early churn leave the company unprofitable.
The Founder Marketing Metrics Worth Reviewing Monthly
External benchmarks explain the environment. An internal scorecard shows whether a company can afford to grow within it. At minimum, review:
- Paid CAC: Media, creative, campaign tools, and paid-acquisition labor divided by customers attributed to paid campaigns.
- Blended CAC: Total sales and marketing expense divided by all new customers. This catches costs that advertising platforms omit.
- Gross-margin-adjusted payback: The number of months required to recover acquisition spending from customer gross profit.
- Conversion by stage: Visitor to lead, lead to qualified opportunity, trial to paid account, or checkout start to purchase.
- Cohort retention: Customers or revenue retained from each acquisition period, channel, and offer.
- Incrementality: Evidence that a campaign created sales that would not otherwise have occurred.
This is the useful version of CAC versus ROI in digital marketing. Platform attribution can guide optimization, but reconcile it with refunds, churn, repeat purchases, discounts, and margin data from the company’s own systems.
Review results by acquisition month and customer segment. A blended average can hide one efficient segment subsidizing another that never pays back.
The Practical Takeaway
The most useful digital marketing statistics for founders do not identify one channel that every company should copy. They show where competition is rising and where measurement deserves more scrutiny.
Start with allowable CAC, gross margin, and a realistic payback window. Use industry data to choose where to test, then let customer economics determine where to scale. A modest channel producing profitable, durable customers is worth more than a fashionable one producing an impressive dashboard.