Ever feel certain your Content Marketing ROI exists, yet struggle to prove it during budget meetings? This common frustration plagues many teams. They publish and promote, seeing activity while actual numbers remain fuzzy due to undercounted costs and flawed attribution.
A smarter setup fixes this disconnect. Recent B2B research from the Content Marketing Institute reveals that 46 percent of marketers track revenue or related costs. This means more than half still fail to use financial measurement as their core scorecard, relying instead on superficial data. Measuring true Content Marketing ROI requires moving beyond these vanity metrics.
It demands clear attribution models and accurate tracking systems that map the entire customer journey. This guide details the essential metrics, attribution choices, and tracking setups needed to successfully connect content performance directly to revenue generation. By implementing these proven strategies, modern businesses can finally secure the hard data required to justify marketing budgets, optimize future campaigns, and guarantee continuous annual financial business growth.
What is Content Marketing ROI?
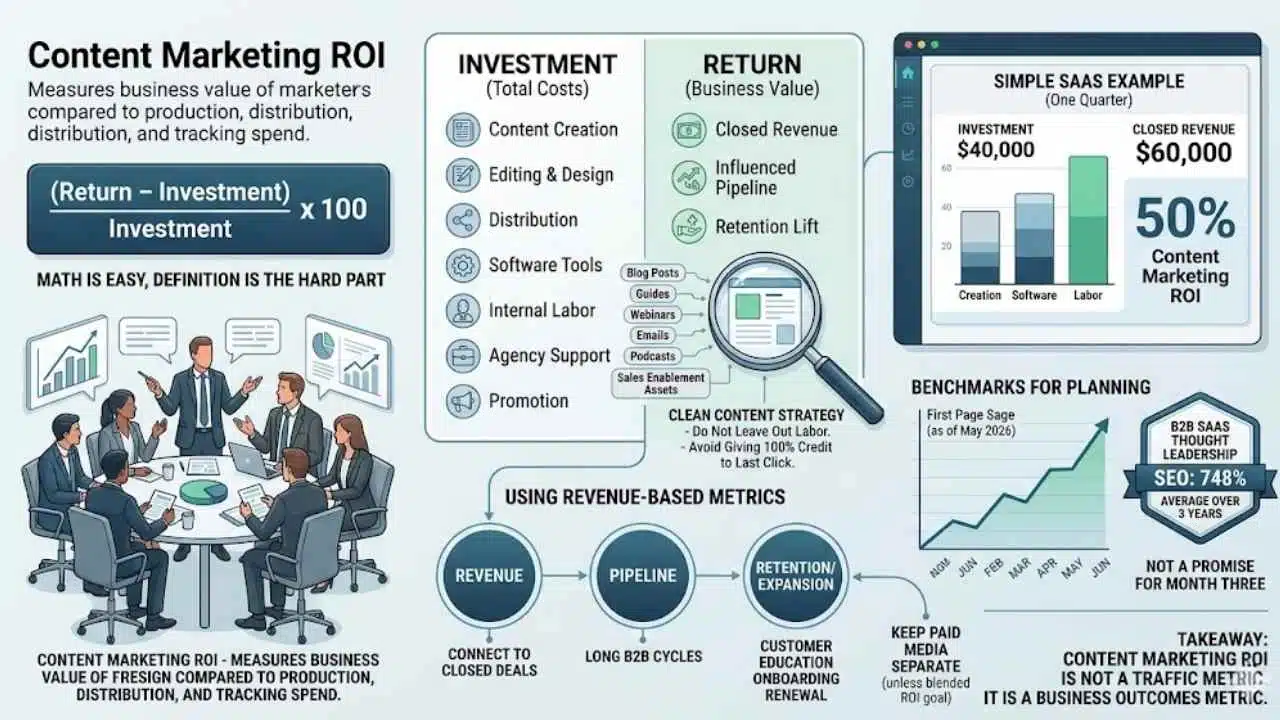
Content marketing ROI measures how much business value your content marketing creates compared with what you spent to produce, distribute, and track it. The basic formula still works: (Return – Investment) / Investment x 100.
In practice, the hard part is not the math. The hard part is defining return and investment in a way your finance team will accept.
For most businesses, return should include closed revenue, influenced pipeline, or retention lift tied to owned content such as blog posts, guides, webinars, emails, podcasts, and sales enablement assets. Investment should include content creation, editing, design, distribution, software, internal labor, agency support, and any promotion costs.
That is why a clean content strategy matters. If you leave out labor or give 100% of credit to the last click, your ROI looks better on paper and worse in real life.
- Use revenue when you can connect content to closed deals.
- Use pipeline for long B2B sales cycles where deals take months to close.
- Use retention or expansion value for customer education, onboarding, and renewal content.
- Keep paid media separate unless your goal is blended channel ROI.
A simple SaaS example makes this easier to see. If your team spends $40,000 on content creation, distribution, software, and labor in one quarter and that content contributes $60,000 in closed revenue, your content marketing ROI is 50%.
Benchmarks can help with planning, but you need to read them carefully. As of May 2026, First Page Sage lists a 748% three-year average ROI for thought leadership SEO in B2B SaaS. That is useful as a long-range benchmark, but it is not a promise for a new program in month three. The takeaway is simple: content marketing ROI is not a traffic metric. It is a business outcomes metric.
Why Measuring Content Marketing ROI Matters
Measuring content marketing ROI turns content from a “nice to have” into something leadership can fund with confidence. It also shows which channels, formats, and topics actually help your content distribution and digital marketing efforts produce growth.
Validates marketing investments
If you can show that a webinar series lowered customer acquisition cost or that a guide influenced qualified leads, budget conversations get easier. You are no longer defending activity. You are defending contribution.
That matters because content is expensive once you count the full stack: writers, subject matter experts, design, video, SEO, tools, distribution, and reporting time. Teams that skip full cost accounting usually overstate ROI and make bad budget allocation decisions later.
High-trust content is often worth the extra effort. In the 2024 Edelman and LinkedIn thought leadership report, 86% of decision-makers said strong thought leadership makes them more likely to invite a company into an RFP, and 75% said it led them to research a product or service they had not previously considered.
Links content to business goals
Content works best when every asset has a job. One piece might drive brand awareness. Another might generate demo requests. Another might help sales enablement by answering objections late in the customer journey.
When you map each asset to a KPI, measurement gets clearer. A top-of-funnel article should not be judged by the same standard as a pricing guide or bottom-of-funnel comparison page.
Measure what the business needs next, not just what the dashboard shows first.
A practical model looks like this: use engagement metrics and reach for awareness content, conversion rates for lead generation content, and influenced pipeline or closed revenue for decision-stage assets.
Enables continuous improvement through insights
Good measurement helps you improve faster. You can see which topics earn qualified leads, which content formats keep attention, and which assets assist deals even when they are not the last touch.
HubSpot’s updated compounding-post research shows that a small share of posts can drive an outsized share of traffic over time. In its data set, compounding posts made up 10% of posts but generated 38% of overall blog traffic. That is a strong reason to keep refreshing evergreen content instead of judging it too early.
6sense’s 2025 Buyer Experience Report adds another useful reminder: buyers reported an average of 16 interactions per person with the winning vendor. If your reporting credits only the final page visit, you miss most of the story.
Key Metrics for Measuring Content Marketing ROI
You do not need dozens of KPIs. You need a small set that explains how content performance turns into revenue generation.
Conversion Rates
Conversion rates show how often content moves someone to the next step, such as a newsletter signup, demo request, trial start, or purchase. This is one of the fastest ways to see whether a piece is helping or stalling the funnel.
Use Google Analytics to mark those actions as key events, then compare conversion rates by landing page, traffic source, and content format. In GA4 standard properties, you can mark up to 30 events as key events, so reserve those spots for actions that actually matter.
Video deserves its own view. Wistia’s recent CTA analysis found that longer educational videos can convert very well when the call to action appears at the right point in the timeline. That means you should not judge a webinar by play count alone. Track CTA clicks and form fills tied to the video.
Customer Acquisition Cost (CAC)
Customer acquisition cost shows what you spend to win one new customer. If your content lowers CAC over time, that is one of the clearest signs your program is getting stronger.
The formula is simple: (marketing costs + sales costs tied to acquisition) / new customers acquired. The discipline is the hard part. Include labor, software, freelancers, agencies, and distribution costs. If content helps sales close deals faster, bring that effect into the conversation too.
- Good use case: compare CAC for organic search leads versus paid campaign leads.
- Common mistake: counting content production costs in one report and ignoring them in another.
- Pro tip: review CAC by channel and by content type, not just by campaign.
Customer Lifetime Value (CLV)
Customer lifetime value tells you what a customer is worth over the full relationship, not just at first purchase. This is why content marketing ROI often looks better over longer windows, especially for SaaS, subscription, and service businesses.
If your content improves onboarding, product adoption, upsell, or retention, it can lift CLV even when it does not generate the first lead. That makes renewal guides, help content, webinars, and customer education libraries more valuable than they first appear.
For readers tracking customer lifetime value in HubSpot or a CRM, the key is to connect content touches to both acquisition and post-sale behavior. Otherwise, your most profitable content disappears from the report.
Engagement Metrics
Engagement metrics help you judge quality. Useful signals include engaged time, scroll depth, repeat visits, return sessions, video completion, and assisted conversions.
These numbers should support decisions, not replace them. A page can get strong engagement and still fail to generate leads. It can also have modest engagement and still influence high-value pipeline if it solves an important decision-stage problem.
| Metric | What it tells you | Best use |
|---|---|---|
| Engaged time | Whether people actually consume the content | Judging educational depth and topic fit |
| Scroll depth | How far readers get before dropping off | Improving page structure and calls to action |
| Repeat visits | Whether the topic keeps bringing people back | Spotting high-intent research behavior |
| Assisted conversions | Whether the content helped before the last touch | Measuring multi-touch attribution impact |
Challenges in Measuring Content Marketing ROI
Measuring content marketing ROI sounds straightforward until you hit real-world friction. B2B teams deal with long sales cycles, delayed results, and messy data silos all the time.
Long sales cycles in B2B
In B2B, content often influences a deal months before the CRM shows closed revenue. A buyer may read a guide, watch a webinar, compare vendors, share a case study internally, and only then book a demo.
According to 6sense’s 2025 report, the average B2B buying cycle dropped to 10.1 months, but buyers still reported 16 interactions with the winning vendor. That makes single-touch reporting a weak fit for most B2B content strategy work.
If your sales cycle runs six months or longer, measure influenced pipeline alongside closed revenue. That gives you an earlier read on whether content is helping.
Delayed impact of content efforts
Content often compounds. A new article may do very little in month one, then start ranking, earning links, and attracting high-intent visitors months later.
HubSpot’s organic marketing guidance says many businesses start seeing initial organic movement in three to six months, with stronger momentum in six to twelve months of steady effort. That timing matters. If you judge SEO or thought leadership too early, you may cut the assets that would have paid back later.
- Review fast signals weekly: indexing, impressions, early engagement, key event setup.
- Review growth signals monthly: organic traffic, assisted conversions, lead quality.
- Review ROI signals quarterly: pipeline influence, CAC trend, customer lifetime value trend.
Siloed data and attribution limitations
This is where many measurement plans break. GA4 sees web behavior. Your CRM sees lead and deal data. Sales sees meetings and deal notes. Customer success sees retention. If those systems do not talk to each other, your content analytics will stay partial.
GA4 also has built-in limits you should know. Google now offers three attribution models in GA4 reporting, and the default is data-driven attribution. The default key event lookback window for most key events is 90 days, though you can switch to 30 or 60 days. If your average sales cycle is longer than your lookback choice, your reports will under-credit earlier touches.
Dark social makes this harder still. Buyers often discover or share content in Slack, email, direct messages, private communities, and internal documents where traditional referrer data never appears.
If your revenue report shows only Search and Direct, that is usually a tracking warning, not the full truth.
Practical Steps to Measure Content Marketing ROI
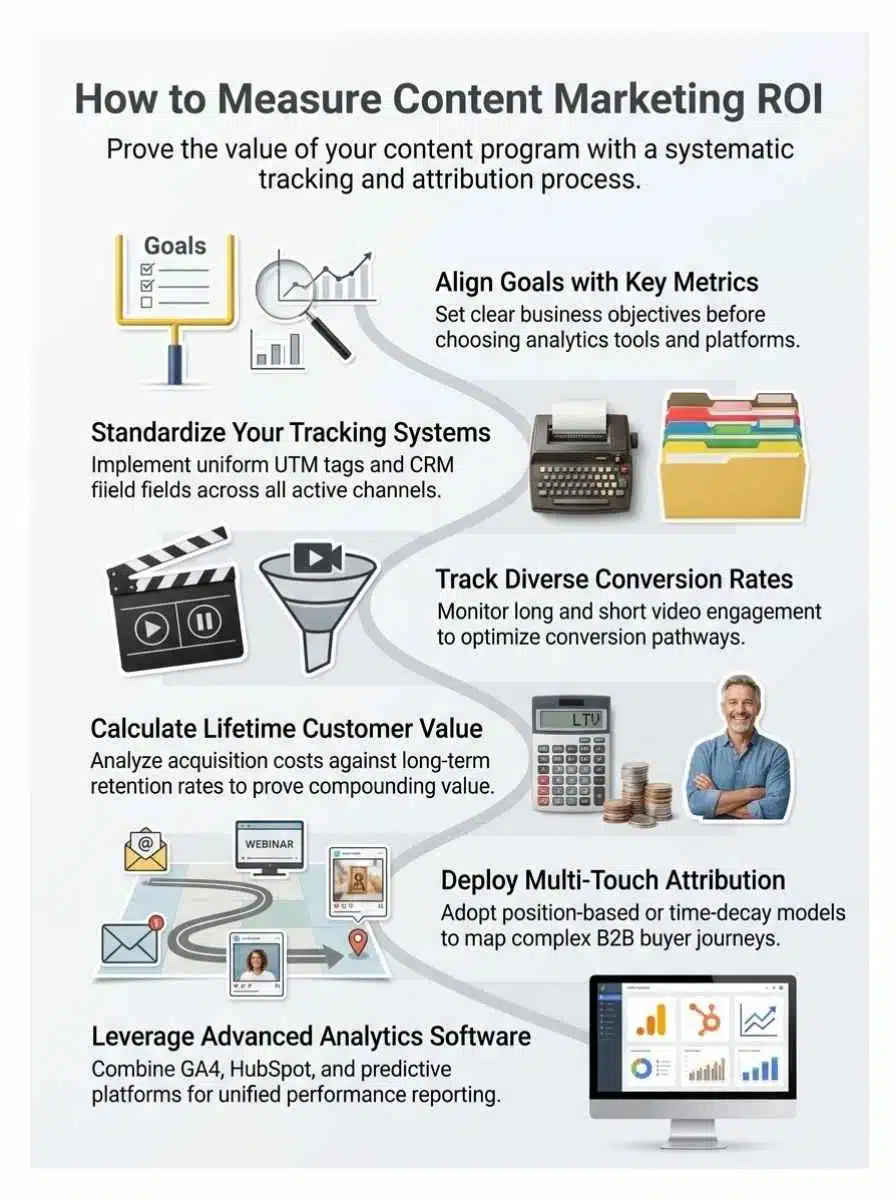
You do not need a perfect system on day one. You need a repeatable one. Start with goals, standardize tracking, choose an attribution model, and make sure your tools can pass data from first touch to revenue.
Define objectives and align with KPIs
Start with the business goal, then work backward. If the goal is lead generation, prioritize conversion rates, cost per lead, pipeline created, and customer acquisition cost. If the goal is brand awareness, use reach and engagement metrics, but still define the next measurable action you want readers to take.
One useful approach is to score each asset against three buckets:
- Attention: impressions, clicks, engaged time
- Progression: key events, assisted conversions, lead quality
- Business value: pipeline, revenue generation, retention
That keeps your content marketing measurement tied to outcomes instead of pageviews alone.
Standardize tracking and processes
Pick one measurement stack and document it. For many teams, that means Google Analytics for web behavior and HubSpot for contact, deal, and revenue tracking.
HubSpot’s official documentation notes that you can pass values into contact properties with hidden form fields, and you can also auto-populate hidden fields with query strings. That is a practical way to preserve campaign or content context when someone converts.
At a minimum, standardize these items:
- UTM naming: source, medium, campaign, and content rules
- Form tracking: hidden fields for campaign and asset detail where useful
- Event naming: one shared list for downloads, demo requests, video actions, and form submits
- CRM handoff: clear fields for original source, latest source, and influenced assets
If your team uses HubSpot-hosted pages, HubSpot states that you can connect GA4 by adding a Measurement ID directly in settings. That is quick to implement and easier to maintain than scattered manual scripts.
Use multi-touch attribution models
Multi-touch attribution spreads credit across the customer journey instead of handing everything to the final touch. For most content marketing programs, that creates a fairer view.
Google Analytics no longer offers the old long list of models in standard reporting. Today, GA4 attribution reports focus on data-driven attribution, paid and organic last click, and Google paid channels last click. That makes your CRM even more important if you want richer content-level analysis across the full customer journey.
| Attribution model | Best fit | Main risk |
|---|---|---|
| Last touch | Short sales cycles and fast purchases | Over-credits bottom-funnel pages |
| First touch | Demand creation and brand discovery analysis | Misses nurturing influence |
| Multi-touch or data-driven | B2B, SaaS, and longer sales cycles | Needs better tracking discipline |
If you can only fix one attribution problem this quarter, move beyond last-touch attribution for revenue reporting. That single change usually improves decision quality fast.
Leverage analytics tools and software
Use the tools for what each one does best. GA4 tracks behavior and key events. HubSpot connects contacts, deals, and revenue. A dedicated attribution platform can help when your customer journey crosses multiple channels and systems.
For video, tools like Wistia and Vidyard add richer engagement signals than a basic pageview. For audio, native podcast dashboards help you track completion and subscriber trends. For sales enablement, platforms such as Highspot or Seismic can show which assets reps use and which ones buyers actually open.
If your reporting still feels incomplete, add one more layer: self-reported attribution. Ask new leads a short question such as, “What helped you decide to reach out today?” That will not replace analytics, but it will expose channels your software misses.
Tools for Measuring Content Marketing ROI

The right tool stack makes content marketing ROI measurable. The wrong stack leaves you with traffic charts and no revenue story.
Google Analytics 4
GA4 is the best starting point for web-side measurement. It tracks events, key events, traffic sources, and attribution paths, and it uses data-driven attribution by default for event-scoped conversion reporting.
Google’s documentation also says the default lookback window for most key events is 90 days. If your buyers research for longer than that, adjust the window or expect your early content touches to look weaker than they really are.
Use GA4 to track:
- form submissions
- demo requests
- downloads
- pricing page visits
- video engagement tied to key events
HubSpot
HubSpot is valuable because it connects content behavior to contacts, deals, and revenue. Its attribution reporting supports contact, deal, and revenue views, which helps you see more than simple lead counts.
That makes HubSpot especially useful for lead generation and sales enablement programs. You can compare first-touch, deal-create, and revenue attribution reports, then see which assets show up before pipeline is created and before revenue is closed.
For readers who already use HubSpot, hidden form fields, campaign properties, and revenue attribution reports are usually the fastest wins.
Predictive analytics platforms
Predictive analytics platforms help when your content analytics need to move beyond reporting and into forecasting. Tools in this group can model pipeline impact, surface likely high-value accounts, and show which touch patterns appear before a deal closes.
Use them after your basics are clean. If UTMs are inconsistent or your CRM fields are incomplete, a more advanced platform will only make the confusion look more sophisticated.
A good rule is simple: first get clean data, then get smarter models.
Final Thoughts
You do not need a perfect model to improve content marketing ROI. You do need a clear formula, full cost tracking, better attribution than last touch, and a shared measurement process across Google Analytics, your CRM, and your content team.
Focus on the metrics that move decisions: conversion rates, customer acquisition cost, customer lifetime value, engagement metrics, and influenced revenue. Then review them on a timeline that matches your real sales cycle, not your impatience.
If you start there, your content marketing stops looking like a cost center and starts looking like what it should be, a measurable growth engine.
Frequently Asked Questions (FAQs) About Content Marketing ROI
1. What is content marketing ROI and why does it matter?
Content marketing ROI is the return on investment from blog posts, videos, and social posts. It tells you if content brings customers, or just makes noise, so you do not count chickens before they hatch.
2. What metrics should I track to measure ROI?
Track conversion rate, click-through rate, and time on page to see engagement and action. Also watch customer acquisition cost and lifetime value to judge return on investment.
3. How do I attribute sales to content?
Use UTM tags and Google Analytics to trace where leads came from. Try multi-touch models, not just last-click, because content often nudges buyers at many steps.
4. How often should I measure and optimize content marketing ROI?
Check click-through rate and time on page each week, and review conversion rate, customer acquisition cost, and lifetime value each month. Run A/B tests on headlines and calls to action, then use marketing automation to scale what works.