
In 2026, measuring GEO (Generative Engine Optimization) ROI is no longer just about tracking rankings or website traffic. As AI-powered search engines increasingly provide direct answers, businesses must focus on metrics that reveal real impact — including AI citations, brand visibility, engagement quality, assisted conversions, and revenue influence. Traditional SEO KPIs alone can’t capture the full value of GEO strategies in an AI-driven search landscape.
This guide explores the GEO metrics that actually matter in 2026 and how businesses can accurately measure the return on their AI search optimization efforts.
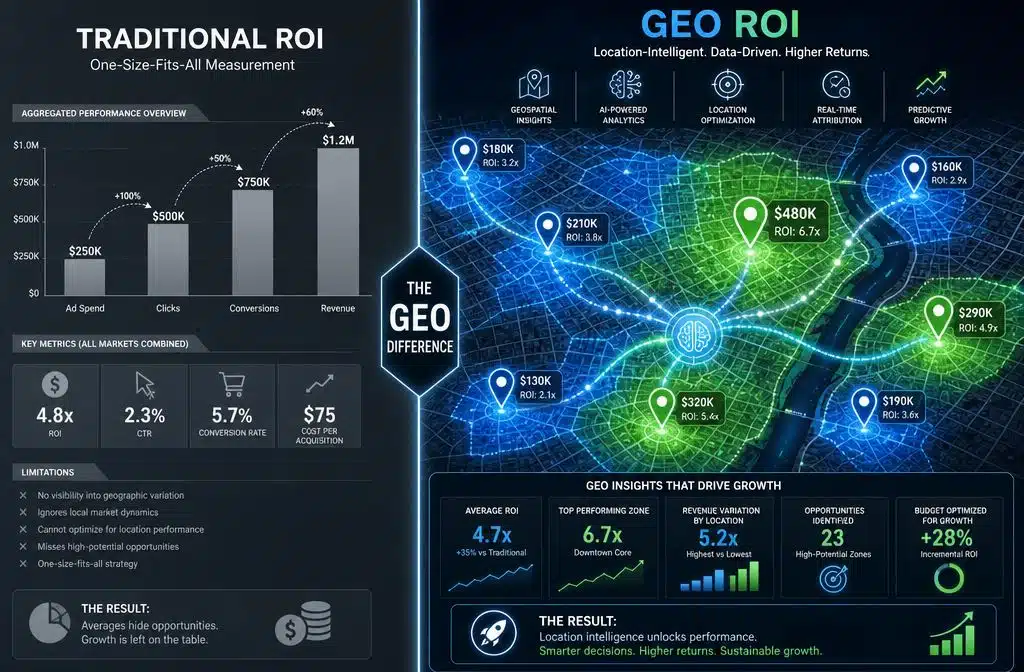
What Exactly Is GEO ROI and How Is It Different from Traditional ROI?
GEO ROI is the return on investment calculated specifically through a geographic lens. It answers the question: “Which locations, regions, or territories are generating the most value for the money spent?”
Traditional ROI is a flat calculation: (Net Profit / Cost of Investment) × 100. It tells you whether a campaign or asset made money, but it doesn’t tell you where that money came from or why certain areas outperform others.
GEO ROI metrics add a spatial dimension. They break down performance by:
- Geographic territory (city, ZIP code, region, country)
- Location-based customer behavior (foot traffic, regional click-through rates, local search conversions)
- Spatial attribution (which geographic touchpoints contributed to a sale)
Who this applies to: Any business running location-based advertising, managing multi-market campaigns, or allocating budget across physical territories. It’s especially relevant for enterprise marketing teams, SaaS companies with regional pricing, and real estate investors.
Common mistake: Treating GEO ROI as just “ROI filtered by region.” True GEO ROI accounts for regional cost differences, local competitive intensity, and territory-specific customer behavior, not just segmented revenue reports.
Which GEO ROI Metrics Matter Most?
The five metrics below consistently drive the most actionable decisions for digital marketers and enterprise teams in 2026.
1. Location-Attributed Revenue (LAR)
Revenue directly tied to a geographic touchpoint, such as a local search ad, a geofenced push notification, or a regional landing page. LAR is the foundation of any GEO ROI framework.
2. Geographic Customer Acquisition Cost (Geo-CAC)
Total spend in a territory divided by new customers acquired from that territory. Geo-CAC reveals which markets are expensive to penetrate and which are underpriced relative to their output.
3. Territory-Level Customer Lifetime Value (Territory LTV)
Average LTV of customers segmented by their geographic origin. A customer acquired in a high-income urban market often has a materially different LTV than one acquired in a rural or emerging market.
4. Spatial Conversion Rate
The percentage of location-triggered interactions (impressions, store visits, geofenced events) that result in a desired action. This metric is particularly relevant for retail, QSR, and event-based businesses.
The estimated percentage of category spending that a business captures within a defined territory. This is an advanced metric that requires third-party data but is increasingly available through platforms like Placer.ai and Foursquare.
Decision rule: If budget allocation across territories is the primary decision, prioritize Geo-CAC and Territory LTV. If campaign creative or channel mix is the question, focus on Spatial Conversion Rate and LAR.
How Expensive Are Professional GEO ROI Tracking Tools Right Now?
Professional GEO ROI tracking tools range from free (for basic implementations) to $50,000+ per year for enterprise geospatial analytics suites. The cost depends heavily on data volume, geographic granularity, and integration requirements.
Here’s a practical breakdown as of 2026:
| Tool Tier | Examples | Approximate Annual Cost | Best For |
|---|---|---|---|
| Free / Freemium | Google Analytics 4, Looker Studio | $0 | Basic regional segmentation |
| Mid-market | Semrush, HubSpot with geo add-ons | $3,000–$15,000 | SMBs, regional campaign tracking |
| Professional | Placer.ai, Foursquare Analytics | $15,000–$40,000 | Retail, foot traffic, territory analysis |
| Enterprise | Esri ArcGIS, Precisely, Databricks Geo | $40,000–$150,000+ | Large-scale spatial analytics, ML integration |
Note: Prices are estimates based on publicly available pricing tiers and industry benchmarks as of early 2026. Actual costs vary by contract terms and feature selection.
Edge case: Many enterprise companies already own tools (Salesforce, Google Cloud) that include underused geospatial features. Audit existing tech stacks before purchasing dedicated GEO ROI software.
Common Mistakes Companies Make When Calculating GEO ROI
The biggest mistake is blending geographic data without controlling for regional cost differences. A campaign that looks profitable at the national level can be losing money in half its territories when costs are properly allocated.
Other frequent errors:
- Using ZIP codes as proxies for behavior. ZIP code boundaries don’t align with actual customer movement or competitive zones. Drive-time radii and census tracts are more accurate for most use cases.
- Ignoring offline-to-online attribution. A customer who sees a regional billboard and later converts online is often counted as an organic or direct conversion, not a geographic one.
- Calculating GEO ROI at the wrong time horizon. Short-term geo campaigns (event promotions, seasonal offers) need different measurement windows than long-term territory development strategies.
- Conflating market size with market opportunity. Large markets have high revenue ceilings but also high competition and acquisition costs. Smaller markets can deliver better geo-CAC even with lower absolute revenue.
How Do Startups vs. Enterprise Companies Track GEO ROI Differently?
Startups typically track GEO ROI with lightweight, low-cost tools focused on a handful of key markets. Enterprise companies run multi-layer geospatial models across hundreds of territories with dedicated data teams.
Startup approach:
- Use Google Analytics 4 geographic reports and UTM parameters tied to regional campaigns.
- Build a simple spreadsheet model (see the free templates section below) tracking spend, leads, and revenue by region.
- Focus on two or three core GEO ROI metrics rather than trying to track everything.
Enterprise approach:
- Deploy dedicated geospatial analytics platforms integrated with CRM and media buying systems.
- Run territory-level P&L models that include allocated overhead, regional pricing, and competitive share data.
- Use data science teams to build custom attribution models that account for geographic overlap and multi-touch journeys.
Choose startup-style tracking if: The business operates in fewer than 10 distinct markets and annual marketing spend is under $500K.
Choose enterprise-grade tracking if: Territory-level budget decisions exceed $1M annually or the business operates across international markets with different cost structures.
What Technical Skills Are Needed to Calculate Accurate GEO ROI?
Basic GEO ROI tracking requires standard analytics skills: working with segmented data in Google Analytics 4, building pivot tables, and understanding attribution models. Advanced GEO ROI measurement adds geospatial data handling and statistical analysis.
Skill requirements by level:
- Basic: Google Analytics 4, Excel/Google Sheets, UTM parameter management, basic data visualization.
- Intermediate: SQL for querying location-tagged data, Looker Studio or Tableau for geo dashboards, understanding of multi-touch attribution.
- Advanced: Python or R for spatial analysis, familiarity with GIS tools (QGIS, ArcGIS), machine learning basics for predictive territory modeling.
Most marketing teams can handle basic and intermediate GEO ROI tracking without hiring specialized data scientists. Advanced spatial analysis typically requires either a dedicated hire or a specialized agency.
Are There Free GEO ROI Calculation Templates or Spreadsheets?
Yes, several credible free resources exist for building a GEO ROI tracking framework without purchasing dedicated software.
Reliable free options:
- Google Analytics 4 + Looker Studio: GA4’s geographic reports, combined with a free Looker Studio dashboard, cover basic location-attributed traffic and conversion data at no cost.
- Google Sheets GEO ROI Template: A structured spreadsheet with columns for territory, spend, impressions, conversions, revenue, geo-CAC, and territory LTV. This can be built in under two hours and handles most startup-level needs.
- HubSpot’s free CRM geographic filters: For inbound-focused teams, HubSpot’s free tier allows contact and deal segmentation by region, which feeds into a basic GEO ROI model.
What free tools can’t do: They won’t provide foot traffic data, competitive share-of-wallet estimates, or predictive territory scoring. Those require paid data sources.
Which Industries See the Biggest Impact from Precise GEO ROI Measurement?

Real estate, retail, logistics, and regional SaaS businesses consistently see the highest ROI from precise geographic measurement. These industries have the largest variance in performance across territories, which means geographic segmentation surfaces the most actionable insights.
Industry breakdown:
- Real estate: Property values, rental yields, and demand are inherently geographic. GEO ROI metrics directly inform acquisition, pricing, and marketing spend by market.
- Retail and QSR: Foot traffic attribution, trade area analysis, and cannibalization modeling between store locations are core business decisions that depend on spatial ROI data.
- Logistics and last-mile delivery: Route efficiency, regional demand forecasting, and hub placement decisions are all GEO ROI problems.
- Regional SaaS: Companies with territory-based sales teams or regional pricing tiers need geo-CAC and territory LTV to allocate headcount and budget correctly.
- Healthcare and insurance: Patient acquisition costs and risk pools vary significantly by geography, making GEO ROI metrics essential for actuarial and marketing decisions.
What Are the Top 3 GEO ROI Metrics for Real Estate Investors?
For real estate investors specifically, the three metrics that drive the most decisions are:
- Price-to-Rent Ratio by Market: Measures the relative value of owning vs. renting in a specific geography, directly informing buy vs. hold decisions.
- Geographic Cap Rate Variance: The difference in capitalization rates across comparable markets, showing where investment capital generates the best returns.
- Territory Appreciation Rate vs. National Benchmark: Year-over-year price growth in a specific market compared to the national average, adjusted for local supply and demand factors.
How Do Machine Learning Algorithms Improve GEO ROI Tracking Accuracy?
Machine learning improves GEO ROI accuracy primarily by solving the attribution problem: correctly assigning credit to geographic touchpoints when customers interact with a brand across multiple locations and channels.
Key applications:
- Spatial clustering: ML algorithms group customers by behavioral geography (where they actually shop or convert) rather than residential ZIP code, producing more accurate territory definitions.
- Predictive territory scoring: Models trained on historical geo-CAC and territory LTV data can forecast which new markets are likely to perform well before significant spend is committed.
- Overlap correction: In dense urban markets where geofences and regional campaigns overlap, ML attribution models distribute credit more accurately than rule-based last-touch models.
The practical barrier is data volume. ML-driven GEO ROI models typically need at least 12 months of territory-level conversion data to produce reliable predictions. Startups and early-stage companies are better served by simpler statistical approaches until sufficient data accumulates.
Can Small Businesses Realistically Implement Advanced GEO ROI Strategies?
Small businesses can implement basic GEO ROI tracking effectively and affordably. Truly advanced strategies (ML-driven attribution, competitive share-of-wallet modeling) require resources that most small businesses don’t have, and the ROI on that complexity rarely justifies the cost at smaller scale.
A realistic small business GEO ROI stack in 2026:
- Google Analytics 4 with geographic segments configured.
- UTM parameters on all regional campaigns.
- A Google Sheets model tracking spend, conversions, and revenue by territory monthly.
- Google Business Profile insights for local search performance.
This setup costs nothing beyond staff time and covers the core GEO ROI metrics that drive real decisions for businesses operating in one to five markets.
How Do International Regulations Affect GEO ROI Reporting?
International data privacy regulations directly constrain what location data can be collected, retained, and used in GEO ROI calculations. GDPR in the EU, CCPA in California, and newer data localization laws passed in Brazil, India, and several Southeast Asian markets between 2024 and 2025 all affect how geographic data flows through analytics systems.
Key compliance considerations:
- Consent requirements: In GDPR-regulated markets, precise location data requires explicit user consent. Many users decline, creating gaps in geographic attribution data that inflate or deflate apparent GEO ROI in European markets.
- Data localization rules: Some jurisdictions require that data about local users be stored on servers within that country, which complicates unified global GEO ROI dashboards.
- Aggregation thresholds: To avoid identifying individuals, some platforms (including Google Analytics 4) automatically suppress geographic data for small sample sizes, creating blind spots in low-volume territories.
Practical implication: Always segment GEO ROI reports by regulatory region and document data gaps caused by consent rates or suppression thresholds. Comparing raw GEO ROI numbers across a GDPR market and a non-GDPR market without adjusting for data completeness produces misleading conclusions.
Final Thoughts
Measuring GEO ROI metrics accurately is one of the highest-leverage analytical improvements a marketing or growth team can make in 2026. The businesses that win at geographic investment measurement aren’t necessarily using the most expensive tools. They’re tracking the right five metrics (LAR, geo-CAC, territory LTV, spatial conversion rate, and geographic share of wallet), avoiding the blended-data trap, and adjusting for regulatory constraints that affect data completeness.
Actionable next steps:
- Audit your current analytics setup to confirm geographic segmentation is active and correctly configured in GA4.
- Build or download a simple territory tracking spreadsheet and populate it with the last 90 days of spend and conversion data by region.
- Calculate geo-CAC for your top three markets and compare it to your blended CAC. The gap will tell you where to focus.
- If operating in EU or California markets, document your consent rates and note where geographic data is being suppressed.
- Set a quarterly review cadence for territory-level performance, and tie budget reallocation decisions directly to geo-CAC and territory LTV trends.
Start with the basics, get consistent data flowing, and add complexity only when the business decisions justify it.
Frequently Asked Questions (FAQs)
What is the simplest definition of GEO ROI?
GEO ROI is the return on investment calculated by territory or location, showing which geographic markets generate the most value relative to the money spent there.
How is geo-CAC different from regular CAC?
Regular CAC blends acquisition costs across all markets. Geo-CAC calculates the cost per new customer within a specific territory, revealing which markets are efficient and which are draining budget.
Do I need GIS software to track GEO ROI metrics?
No. Basic GEO ROI tracking works with Google Analytics 4 and a spreadsheet. GIS software (like QGIS or ArcGIS) is only necessary for advanced spatial analysis involving physical geography, trade areas, or large datasets.
How often should GEO ROI metrics be reviewed?
Monthly reviews work for most businesses. High-spend campaigns with short flight dates (event promotions, seasonal offers) warrant weekly monitoring. Annual territory strategy reviews should use 12-month rolling data.
What’s the biggest data quality issue in GEO ROI reporting?
Misattribution of location. Many analytics platforms assign users to their IP-based location rather than their actual purchase or conversion location, which skews territory-level data for mobile-heavy audiences.
Can GEO ROI metrics help with budget allocation decisions?
Yes. Territory LTV and geo-CAC together are the most direct inputs for deciding how to distribute marketing budget across regions. High-LTV, low-geo-CAC territories deserve more investment; the inverse signals a market to deprioritize or re-examine.