High utility bills, climate change, and fossil fuel dependence highlight the urgent need for sustainable power. Fortunately, the global energy transition is no longer a theoretical concept. The Top Renewable Energy Countries are already proving that clean energy can successfully power homes, factories, and entire cities at scale. By leveraging solar, wind, hydroelectric, and geothermal energy, these leading nations demonstrate that modern grids can thrive without relying on traditional fossil fuels.
Analyzing these pioneers reveals the precise strategies that drive lower carbon emissions and smarter, long-term infrastructure choices. From aggressive policy frameworks to massive grid investments, their success provides a practical blueprint for the world. Adopting these proven strategies offers an actionable path toward achieving cleaner power, stabilized utility costs, and true energy independence.
Why Renewable Energy is Critical for the Future
Renewable energy matters for a simple reason: fossil fuels create most of the carbon emissions heating the planet, and they leave countries exposed to price shocks, fuel imports, and aging power plants. Clean energy reduces that risk while giving grids more local sources of power.
One helpful thing to keep straight is the difference between capacity and generation. Capacity tells you how much power a country can produce at full output. Generation tells you how much electricity it actually delivered over time. The countries leading this shift pay attention to both.
In IRENA’s April 2026 update, renewables made up 85.6% of all new power capacity added worldwide in 2025, taking total global renewable capacity to 5,149 GW. Ember’s latest global electricity review also found that renewable sources added a record 858 TWh of generation in 2024. That is why clean energy now looks less like a side project and more like the main direction of the global power market.
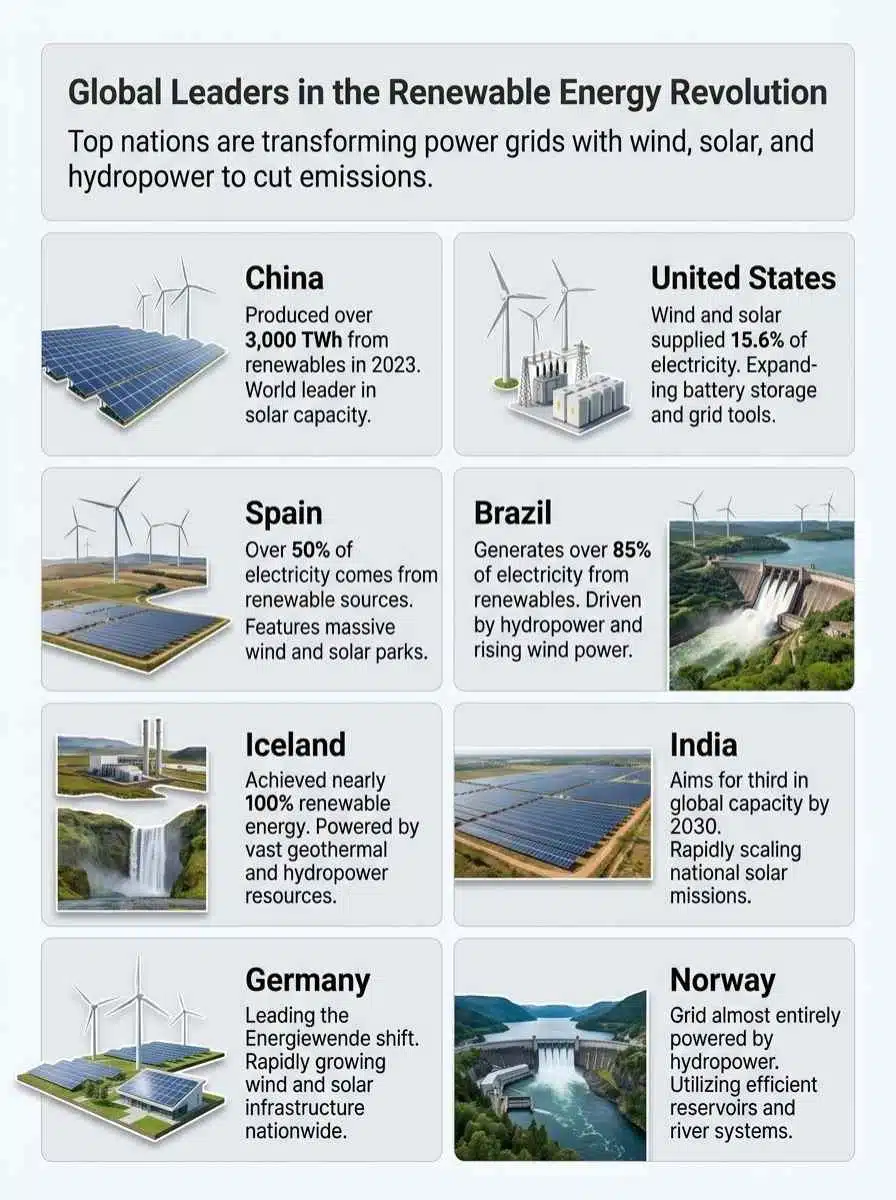
- China shows what happens when a country builds generation, factories, transmission, and storage together.
- Brazil and Norway show how hydroelectric power can anchor a grid if planners keep diversifying.
- Denmark and Spain prove that wind and solar power can carry a large share of demand when the grid is flexible.
- Iceland shows how local natural resources, especially geothermal heat and hydro, can drive renewable electricity production close to 100%.
Global climate policy, from the Kyoto Protocol to the Paris Agreement under the United Nations Framework Convention on Climate Change, helped set the direction. Still, the countries moving fastest are the ones pairing targets with finance and investment, better permitting, modern transmission, and digital grid tools.
The big lesson is simple: countries do not win with turbines and panels alone. They win when clean power can reach people when they need it.
China: The Global Leader in Renewable Energy
China sets the pace because it builds renewable energy at a scale no other country can match. It also treats the grid, storage, and manufacturing base as part of the same system, which is why its clean energy push has real weight.
Largest renewable energy producer
According to China’s National Energy Administration, renewable capacity reached 2.34 billion kilowatts by the end of 2025, or about 60% of the country’s total installed power capacity. Renewable electricity generation reached 3.99 trillion kWh in 2025, roughly 38% of all generation, which means China is not just adding projects on paper, it is putting huge volumes of clean power onto the grid.
That scale matters because it changes equipment prices, supply chains, and project timelines around the world. It also gives China leverage in climate talks linked to the Paris Agreement and wider clean-tech trade.
World leader in solar and wind power capacity
By the end of 2025, China had about 1.2 billion kilowatts of solar capacity and 640 million kilowatts of wind capacity. Wind and solar together reached 1.84 billion kilowatts, which put them above thermal power capacity for the first time.
China also pushed new-type energy storage past 100 million kilowatts in 2025. That is a practical advantage, because storage helps shift midday solar into the evening peak and reduces wasted generation when wind and sun arrive faster than demand.
| China metric | Latest figure | Why it matters |
|---|---|---|
| Total renewable capacity | 2.34 billion kW | Shows national-scale commitment, not isolated projects. |
| Solar capacity | 1.2 billion kW | Confirms China is the world’s biggest solar market and manufacturer. |
| Wind capacity | 640 million kW | Gives the grid a second giant renewable pillar beyond solar. |
| Renewable generation in 2025 | 3.99 trillion kWh | Proves the build-out is translating into real electricity generation. |
| New-type storage | More than 100 million kW | Helps smooth variable wind and solar output. |
There is also a jobs story here. IRENA and the ILO estimate China supported 7.3 million renewable energy jobs in 2024. For readers thinking about policy, that is the real takeaway: when a country builds clean power and clean manufacturing together, employment can grow alongside the grid.
United States: A Major Player in Clean Energy
The United States remains one of the most important clean energy markets in the world. Its advantage is breadth: huge wind corridors, strong solar regions, deep capital markets, and a mix of utility-scale and local projects.
Second-largest renewable energy producer
The U.S. Energy Information Administration says wind and solar generated a record 17% of utility-scale electricity in 2025. When small-scale solar is included, the share rises to 19%. That tells you clean energy is moving from a promising category into a core part of the U.S. power mix.
The practical challenge is not whether the country can build more clean energy. It is whether transmission lines, substations, and interconnection queues can keep up with it.
Expanding wind and solar power infrastructure
EIA expected about 64 GW of new utility-scale capacity in 2025, with solar making up more than half of planned additions and solar plus battery storage accounting for 81%. That is one of the clearest signals anywhere that the market now sees batteries as part of the clean energy package, not a luxury add-on.
- Pair solar with storage: because batteries help move cheap daytime power into expensive evening hours.
- Build near existing grid infrastructure: because projects stall when interconnection work drags on.
- Use community solar where rooftops are limited: because it lets renters, schools, and small businesses benefit without owning a perfect roof.
- Invest in grid software and forecasting: because better planning helps operators balance wind and solar power more cheaply.
For readers in the United States, that last point matters a lot. A grid with more renewable energy needs better forecasting, faster permitting, and smarter local planning, not just more panels in the field.
European Union: A Collective Force in Renewable Energy
The European Union works as a team, even when member states move at different speeds. The European Commission sets targets, countries build different mixes of clean energy, and cross-border links help smooth out supply when weather changes from one market to another.
Eurostat’s latest update shows renewables covered 47.5% of gross electricity consumption in the EU in 2024. The European Commission also keeps the bloc focused on a 2030 target of at least 42.5% renewables in the full energy mix. That combination of targets, shared rules, and connected grids is the EU’s real strength.
| Country | Latest useful signal | What readers should notice |
|---|---|---|
| Germany | 62.7% of net public electricity generation from renewables in 2024 | Strong wind and solar growth can work even in a large industrial economy. |
| Spain | 56% of the electricity mix from renewables in 2024 | Solar-heavy systems can scale when the grid is modern and flexible. |
| France | 27% renewables and 68.1% nuclear in 2025 | Low-carbon power can come from a blended system, not one technology alone. |
Germany: Leader in wind and solar energy
Germany has become a case study in how fast photovoltaic growth can change a power mix. Fraunhofer ISE reported that renewables supplied 62.7% of Germany’s net public electricity generation in 2024, while solar alone produced 72.2 TWh. Germany’s playbook is straightforward: keep adding solar, keep wind strong, and keep improving grid flexibility.
Spain: Over 50% of electricity from renewables
Spain is one of the clearest examples of solar and wind working together at national scale. Red Eléctrica said renewables generated 56% of Spain’s electricity mix in 2024, and solar PV became the country’s largest installed generation technology in early 2025. That makes Spain especially useful for readers watching how sun-rich countries can cut fossil fuel use quickly.
France: Balancing nuclear and renewable energy
France shows that clean electricity does not need a single template. In its 2025 electricity review, RTE said nuclear supplied 68.1% of generation while renewables supplied 27%, and the country added 5.9 GW of solar capacity in 2025. If you want steady baseload today while growing wind and solar over time, France offers a workable model.
Brazil: Champion of Hydropower
Brazil is one of the strongest examples of a country using hydroelectric power as the backbone of a modern grid. What makes it especially interesting now is that it is no longer relying on rivers alone.
Over 85% of electricity from renewables
Brazil’s 2025 Energy Balance says renewables made up 88.2% of the country’s electricity mix in 2024, while the broader national energy matrix reached a record 50% renewable share. That is one reason Brazil keeps showing up in serious discussions about clean energy leadership.
Named assets matter here too. Itaipu Dam still plays a huge role, because very large hydro gives Brazil firm power that can support industry and big urban centers. But planners know drought risk can hit hydro hard, so they are spreading risk instead of leaning on one source forever.
Growth in wind and solar energy
Wind and solar already supplied 23.7% of Brazil’s electricity generation in 2024. In 2025, centralized installed capacity reached 215.9 GW, with 84.6% coming from renewable sources. That tells you Brazil is strengthening its clean grid even as demand grows.
- Keep hydropower as the anchor: because reservoirs still help with reliability.
- Add wind and solar in different regions: because weather patterns vary across the country.
- Expand transmission early: because remote clean power has little value if it cannot reach demand centers.
- Treat drought as a planning issue: not a surprise, because climate change raises the stakes for hydro-heavy systems.
India: Aiming for Future Renewable Milestones
India may be the most important long-term story in renewable energy after China. Its electricity demand is still climbing, so every clean energy decision it makes has global consequences.
Third in global renewable capacity
India has already moved faster than many observers expected. The Indian government said non-fossil sources crossed 50% of installed electricity capacity in June 2025, five years ahead of the target in its climate pledge under the Paris Agreement.
That matters because it shows policy can scale. Agencies such as the Solar Energy Corporation of India help turn targets into actual projects, and that has made India a major force in solar auctions, wind build-outs, and grid expansion.
Ambitious targets for 2030
As of January 31, 2026, India had 520.5 GW of installed power capacity, with 272.0 GW from non-fossil sources and 263.2 GW from renewables. During FY 2025-26 through January, it added about 35.0 GW of solar and 4.6 GW of wind. Those are big numbers, and they explain why India is now central to almost every serious forecast about future electricity generation.
India’s real test is not ambition. It is whether storage, transmission, and land-use approvals can keep pace with the speed of solar and wind construction.
If India clears those bottlenecks, it will shape the next phase of the global energy transition, not just participate in it.
Smaller Nations Making Big Impacts
Smaller countries often make the best case studies because the strategy is easier to spot. They usually build around one natural strength, then design the rest of the power system to support it.
| Country | Latest useful signal | Main lesson |
|---|---|---|
| Iceland | Almost 100% renewable electricity, about 73% hydro and 27% geothermal | Build around the resources you actually have. |
| Denmark | 79.7% of electricity consumed from renewables in 2024 | Wind power can dominate if the grid is flexible and well connected. |
| Sweden | 88.1% of electricity consumed from renewables in 2024 | Hydro and wind together create a very strong low-carbon mix. |
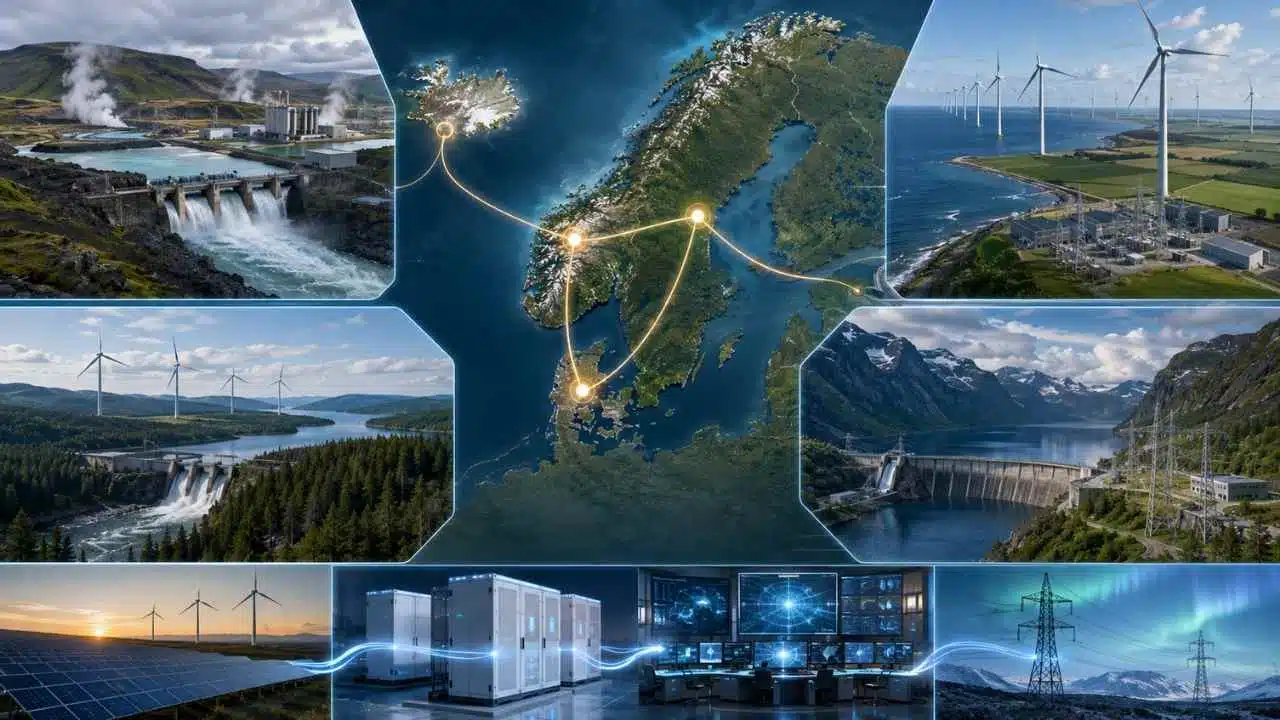
| Norway | 161.8 TWh of electricity production in 2025, led by hydro | Reservoirs give a grid valuable flexibility. |
Iceland: Nearly 100% renewable energy
Iceland’s government says renewable sources provide almost all electricity generation, with about 73% coming from hydropower and 27% from geothermal power. That is about as close to a fully renewable grid as a modern economy gets, and it works because the country built its energy system around local geology instead of imported fossil fuel.
Denmark: Wind power leader
Denmark remains one of the best wind power examples in Europe. Eurostat puts renewable electricity at 79.7% of electricity consumed in 2024, and renewables made up 88.4% of net electricity generation, mainly from wind. Companies like Vestas matter because they show how energy policy can support both domestic clean power and export strength.
Norway: Dominated by hydropower
Norway still runs on hydropower first. Statistics Norway reported 161.8 TWh of total electricity production in 2025, and its monthly data for March 2026 showed a mix that was 85.5% hydro and 13.0% wind. That reservoir-heavy system gives Norway a balancing tool many larger countries wish they had.
Final Thoughts
The countries leading renewable energy all do one thing well: they pair clean power with practical grid planning. China wins on scale, the United States on market depth, the European Union on coordinated rules, Brazil on hydro strength, India on speed, and smaller nations like Iceland, Denmark, Norway, and Sweden on smart system design. Different paths can work, but each one depends on matching generation with storage, transmission, and real operating discipline.
If you want to apply these lessons at home, start small and local. Check how your utility handles wind and solar power, compare rooftop solar with community options, and look at batteries or energy audits if they fit your budget. That is how renewable energy stops feeling abstract and starts looking like lower bills, cleaner air, and a smaller carbon footprint.
Frequently Asked Questions (FAQs) About Top Renewable Energy Countries
1. What are the top countries leading the renewable energy revolution?
Top countries include an Asian leader, the United States, a European leader, and India, they lead in solar energy, wind power, and hydroelectric output.
2. Why are these countries leading?
They invest big, build grid infrastructure, and speed new technology into use. They also pass smart policy, and back clean energy firms with money and tax help.
3. How do they use wind and solar to cut emissions?
They build large wind farms and solar parks, add batteries and grid tools, so clean energy can run the lights when the sun and wind take a break.
4. Can smaller nations catch up?
Yes, with steady investment, clear policy, and tech help, they can scale fast. Think of it like planting trees, one farm at a time it grows into a green forest, and that change pays off.