By January 16, 2026, the debate is no longer about if renewables will replace fossil fuels, but how quickly the old order will collapse. For the first time in history, global investment in solar and wind has not just surpassed coal—it has doubled it.
The era of thermal dominance is officially over, but the transition has birthed a volatile new reality of grid bottlenecks, trade wars, and a deepening divide between the “green haves” and “have-nots.”
Key Takeaways
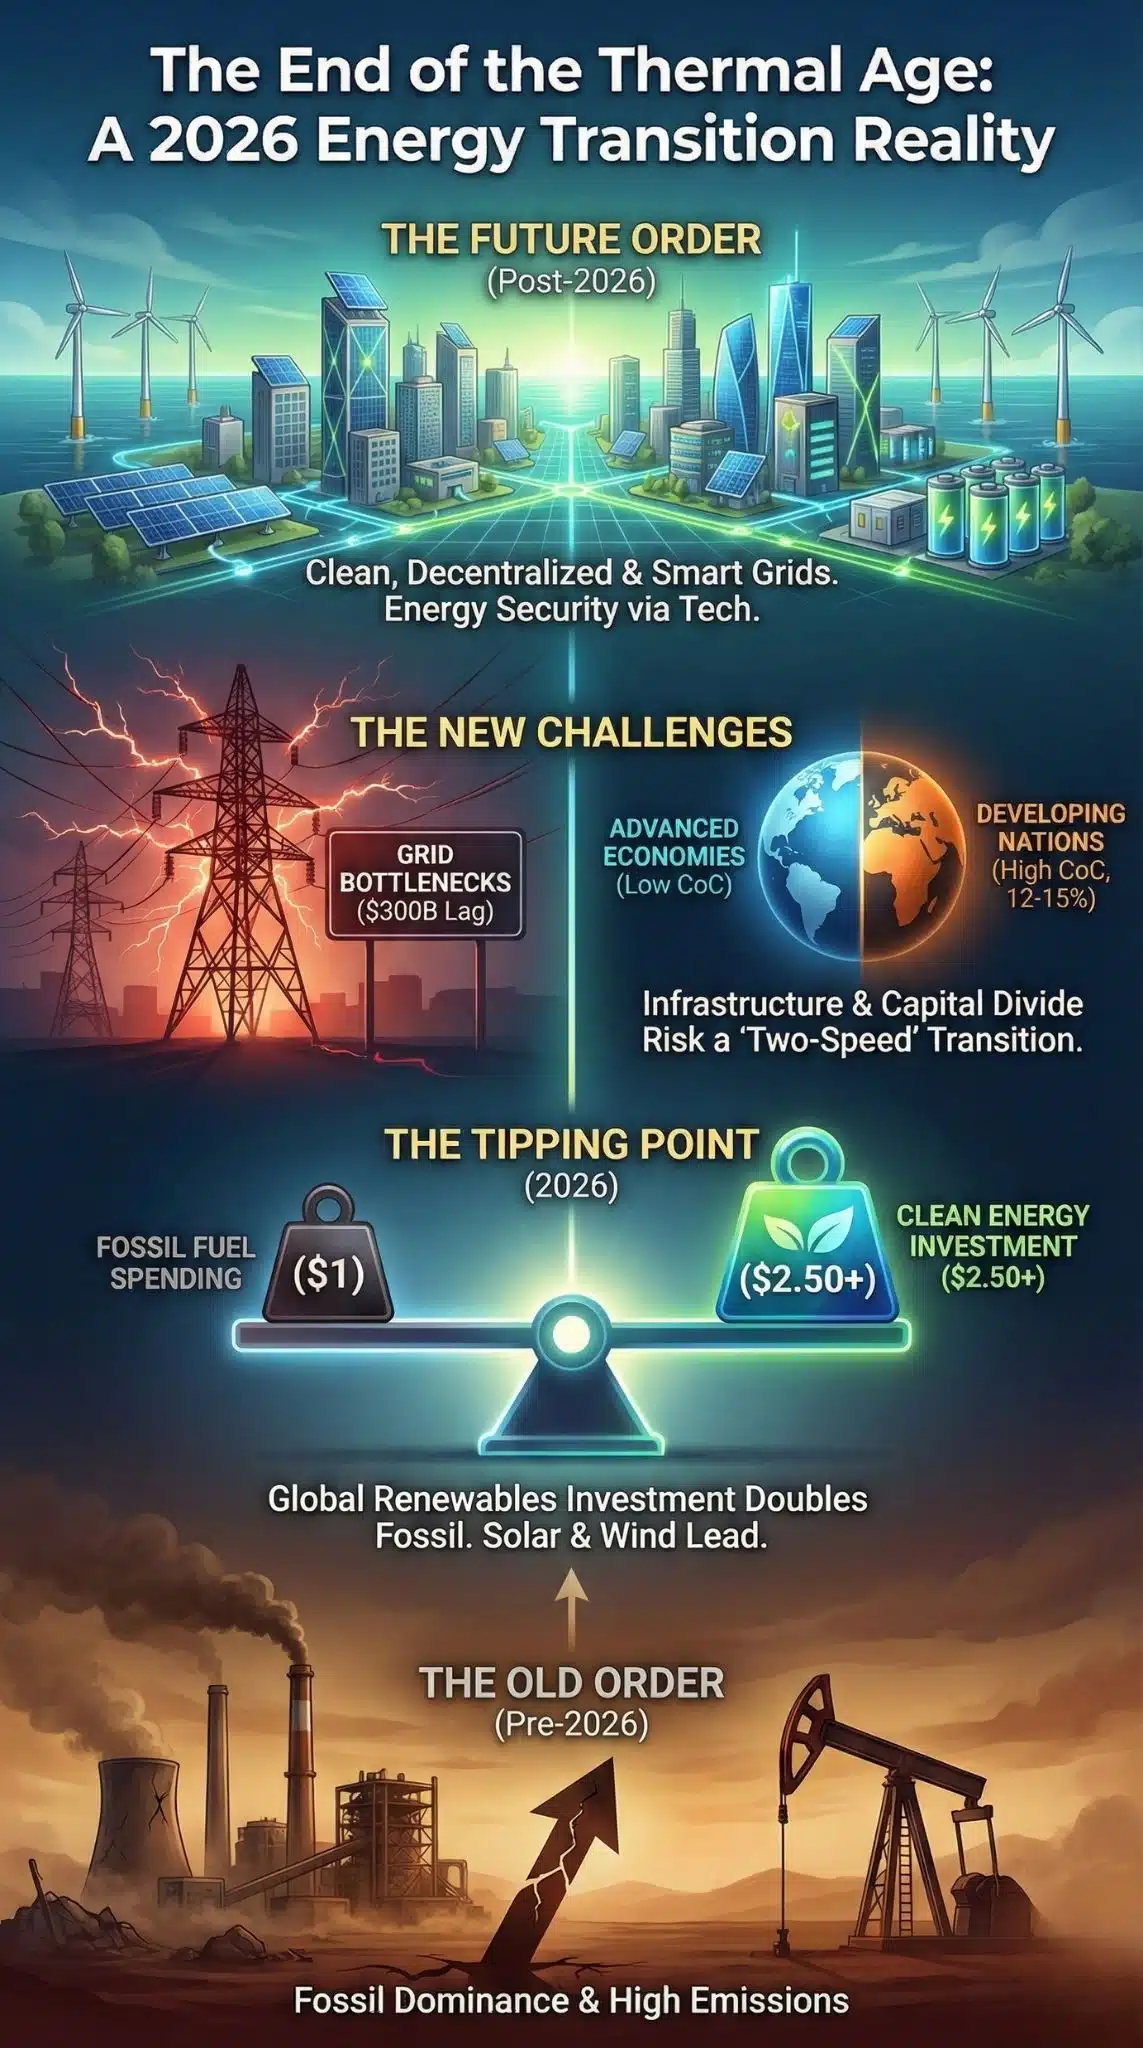
- The Tipping Point: In 2026, for every $1 spent on fossil fuels, $2.50 is now invested in clean energy technologies.
- Solar Supremacy: Solar PV alone accounted for 64% of all new global power capacity added in 2025.
- The Grid Crisis: While generation investment is soaring, grid infrastructure is lagging by $300 billion annually, creating a dangerous bottleneck.
- The Capital Divide: Developing nations face a cost of capital 2-3x higher than advanced economies, risking a “two-speed” global transition.
- China’s Paradox: Beijing remains the world’s largest investor in both clean energy and coal security, dominating the supply chain while hedging against instability.
The End of the Thermal Age: How We Got Here
History will likely mark 2025 as the year the energy world inverted. For over a century, coal was the bedrock of industrialization. As recently as 2020, fossil fuel investment held a comfortable lead over renewables. However, the convergence of three massive forces—technological deflation, energy security mandates following the 2022 crises, and aggressive industrial policy (like the US Inflation Reduction Act and China’s 14th Five-Year Plan)—accelerated the timeline.
By late 2025, the International Energy Agency (IEA) confirmed that global renewable capacity had reached 4,600 GW, effectively doubling in just five years. The narrative shifted from “saving the planet” to “saving the wallet.” With the Levelized Cost of Electricity (LCOE) for solar dropping another 21% in 2025 alone, new coal plants became financially unviable in 91% of global markets. We didn’t just walk away from coal; we were priced out of it.
The New Energy Order
1. The Economics of “No Return”
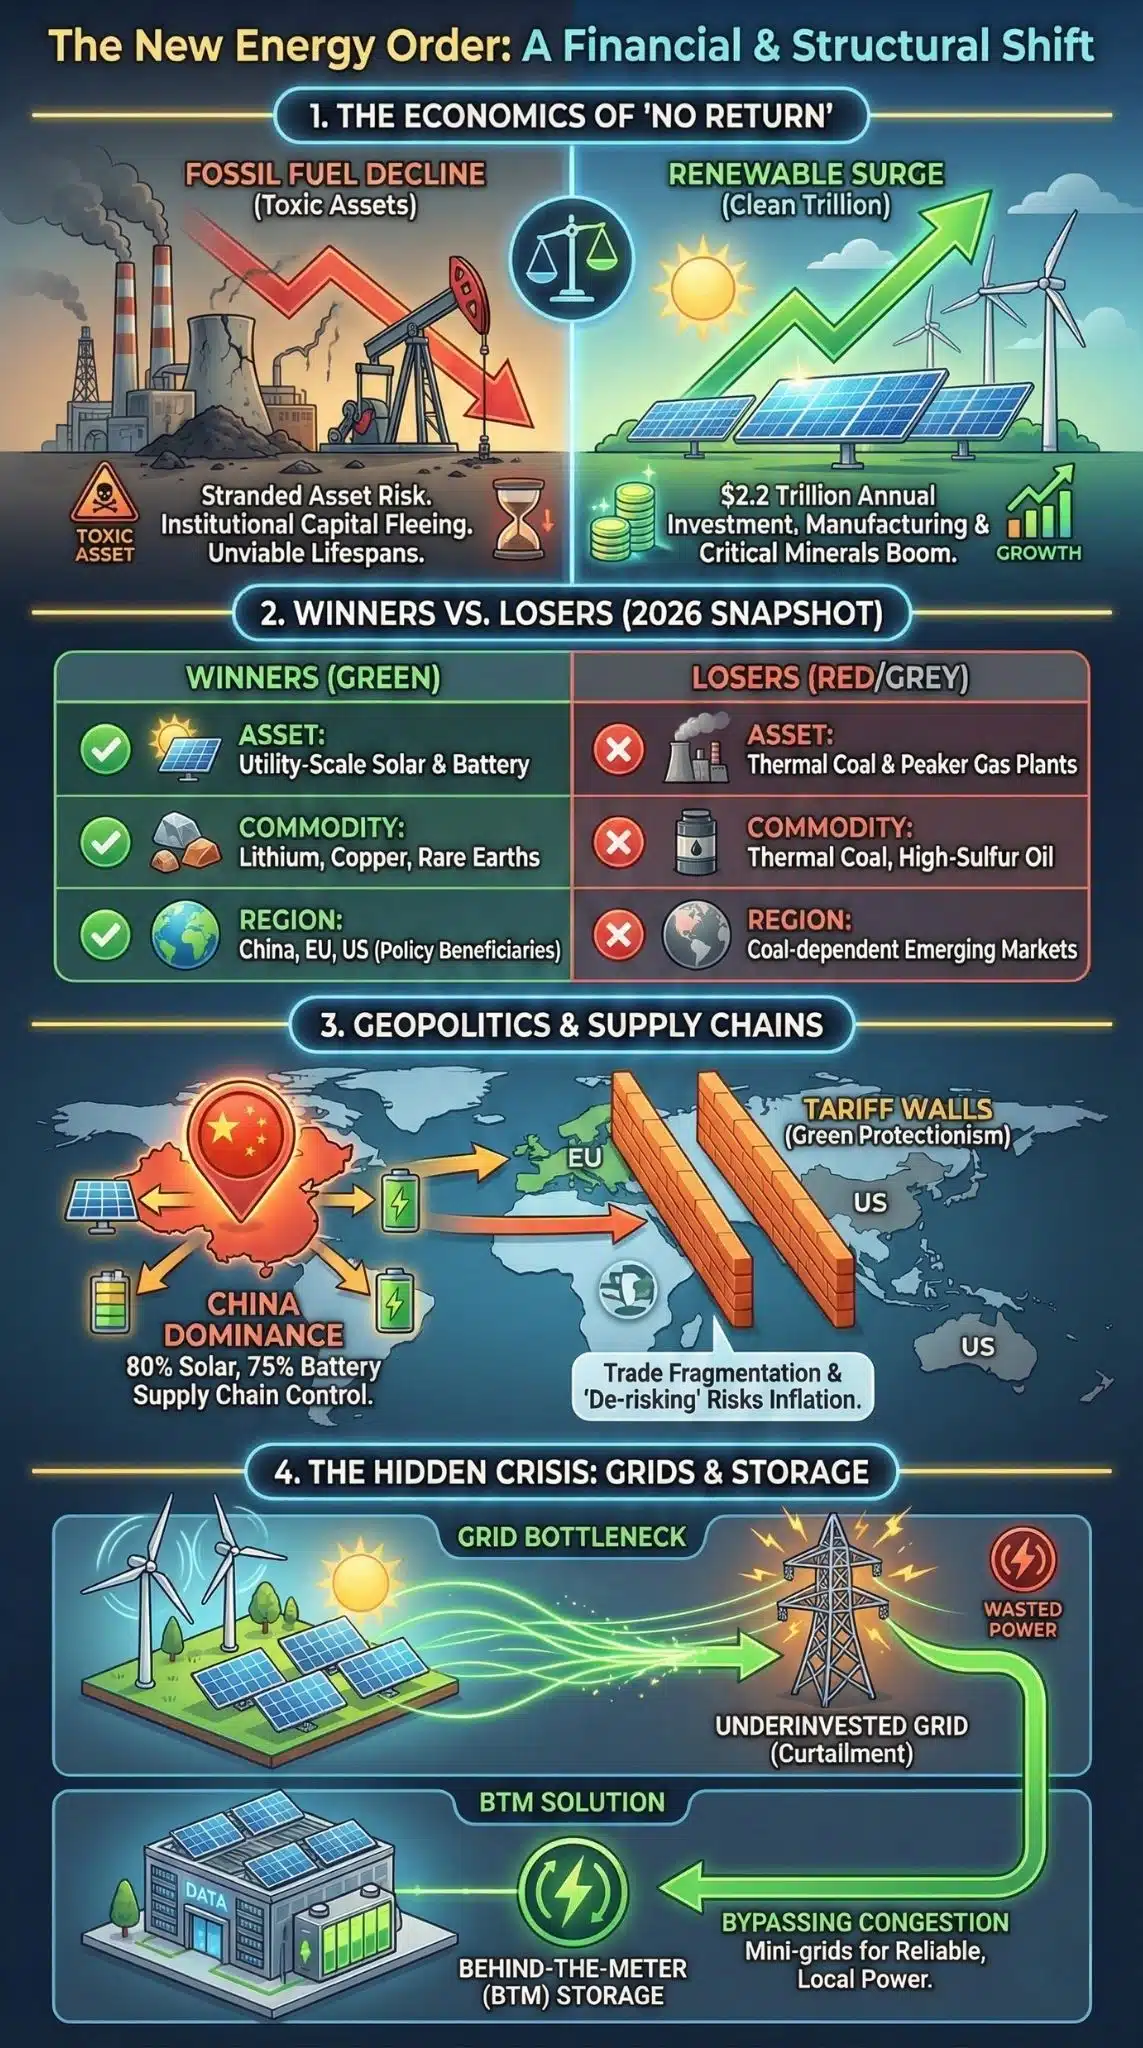
The financial markets have effectively priced in the death of thermal coal. In 2026, capital is fleeing fossil fuel generation not strictly due to environmental altruism, but due to stranded asset risk. Institutional investors now view new coal projects as toxic assets that will likely never pay off their 40-year lifespans.
Conversely, the “Clean Trillion” has become the “Clean Two Trillion.” Investment in solar, wind, and batteries hit $2.2 trillion this year. The winners are clear: clean tech manufacturing and critical minerals. The losers are traditional thermal utilities that failed to diversify.
Winners vs. Losers in the 2026 Energy Economy
| Category | The Winners (2026) | The Losers (2026) |
| Asset Class | Utility-Scale Solar & Battery Storage | Thermal Coal & Peaker Gas Plants |
| Commodity | Lithium, Copper, Rare Earths | Thermal Coal, High-Sulfur Oil |
| Region | China, EU, US (Inflation Reduction Act beneficiaries) | Coal-dependent emerging markets w/o transition aid |
| Investment Driver | Energy Security & Low LCOE | Subsidies & Artificial Life-Support |
2. The Geopolitics of Supply Chains
While the West celebrates the decline of carbon, it frets over the rise of Beijing. In 2026, China controls over 80% of the solar manufacturing supply chain and nearly 75% of battery cell production. The transition has swapped dependence on Russian gas for dependence on Chinese clean tech.
This has triggered a wave of “Green Protectionism.” The EU and US have erected tariff walls to protect domestic manufacturers, accepting slightly higher energy costs in exchange for supply chain sovereignty. This trade fragmentation is the single biggest risk to the speed of the transition; “de-risking” from China is proving inflationary.
3. The “Hidden” Crisis: Grids and Storage
We have built the engines (solar/wind farms), but we forgot to build the roads (transmission lines). Investment in grids has remained stagnant at around $400 billion annually, far short of the $700 billion required to integrate this surge of renewables.
In 2026, “curtailment” is the industry buzzword. In markets like California, Germany, and parts of China, cheap solar power is frequently wasted because the grid cannot transport it to demand centers. This disconnection has birthed a booming secondary market for Behind-the-Meter (BTM) storage, where factories and data centers build their own mini-grids to bypass the congested national infrastructure.
The Investment Mismatch (2026 Snapshot)
| Sector | 2026 Investment (Approx.) | Status vs. 2030 Net Zero Goals |
| Renewable Generation | $2.2 Trillion | On Track (Exceeding targets) |
| Fossil Fuel Supply | $1.1 Trillion | Too High (Needs to drop 50%) |
| Grid Infrastructure | $0.4 Trillion | Critical Lag (Needs to double) |
| End-Use Efficiency | $0.6 Trillion | Moderate Lag (Slow progress) |
4. The “Global South” Divergence
The headline numbers mask a cruel inequality. While the OECD and China race ahead, many developing nations are stuck in the starting blocks. The Cost of Capital (CoC) for a solar project in Europe is roughly 4-5%; in parts of Africa or Southeast Asia, it remains 12-15%.
This risk premium effectively doubles the cost of clean energy for the countries that need it most. Without a reform of the global financial architecture—specifically de-risking mechanisms from the World Bank and IMF—the world risks a “two-speed” transition where the rich get clean and cheap energy, while the poor remain tethered to expensive and dirty fossil fuels.
Expert Perspectives: The Reality Check
To understand the nuance of this shift, we must look beyond the triumphalist headlines.
The Optimist View: Dr. Elena Sorel, Senior Analyst at Global Green Insights: “We are witnessing an S-curve adoption rate that defies all conservative models. Solar is not just replacing coal; it’s eating into gas demand faster than anticipated. By 2030, we expect renewables to generate 50% of global electricity.”
The Realist View: Markus Weber, Energy Strategist at PetroCore: “Let’s not write the obituary for fossil fuels just yet. While investment has shifted, consumption has a long tail. We still need gas for grid stability when the sun isn’t shining. The transition isn’t a switch; it’s a dial, and we are turning it slower than the investment dollars suggest.”
This friction between future investment and present reliability is where the tension lies in 2026. The world is investing in the future system while still heavily relying on the old one for baseload power.
Future Outlook: What to Watch in 2027
As we look toward the latter half of the decade, three indicators will determine the trajectory:
- Battery Breakthroughs: Will solid-state batteries move from labs to mass production? If energy storage costs drop another 30%, gas peaker plants will face the same extinction event that coal faces today.
- Grid Permitting Reform: Can Western democracies slash the red tape that delays transmission lines by 5-10 years? The technology is ready; the bureaucracy is not.
- The “Coal Exit” Strategy: Will China and India set hard dates for retiring their massive coal fleets, or will they keep them in strategic reserve, creating a “zombie” capacity overhang?
The money has moved. The technology has won. The question for the remainder of the 2020s is whether our politics and infrastructure can catch up to our capital.
Final Thoughts
The 2026 investment data offers an undeniable verdict: the global market has irreversibly decoupled from fossil fuels. Yet, capital dominance does not guarantee a smooth transition. The battleground has now shifted from generation to transmission; without a massive surge in grid modernization and equitable financing for the Global South, we risk a volatile, two-tiered energy reality. The engine of the future is built, but we must now urgently construct the roads—and the rules—to run it effectively.