

Build an SEO dashboard by deciding which decisions it must support, then choosing the data and charts that make those decisions possible. A useful first version should tell you whether search performance changed, where the change happened, what visitors did afterward, and what someone should investigate next.
A row of green scorecards cannot do that on its own. More impressions may come from queries that rarely produce clicks. More sessions may arrive on pages that do little for the business. A rising technical-issue count may include URLs that were never intended to appear in search.
If you are working out how to build seo dashboard to answer questions, start with a question-to-data map. The walkthrough below uses Google Search Console, Google Analytics 4, and Google Data Studio, the reporting product formerly called Looker Studio. Google restored the Data Studio name in April 2026. The documentation and interface guidance here were checked on November 4, 2026; no private account or live dashboard was accessed for this article.
Write the questions before choosing charts
Choose a primary audience. An editor needs to identify pages worth updating. A marketing lead needs to understand qualified demand. A developer needs a reproducible issue affecting an important set of URLs. They may share a dashboard, but they should not have to interpret the same chart in three different ways.
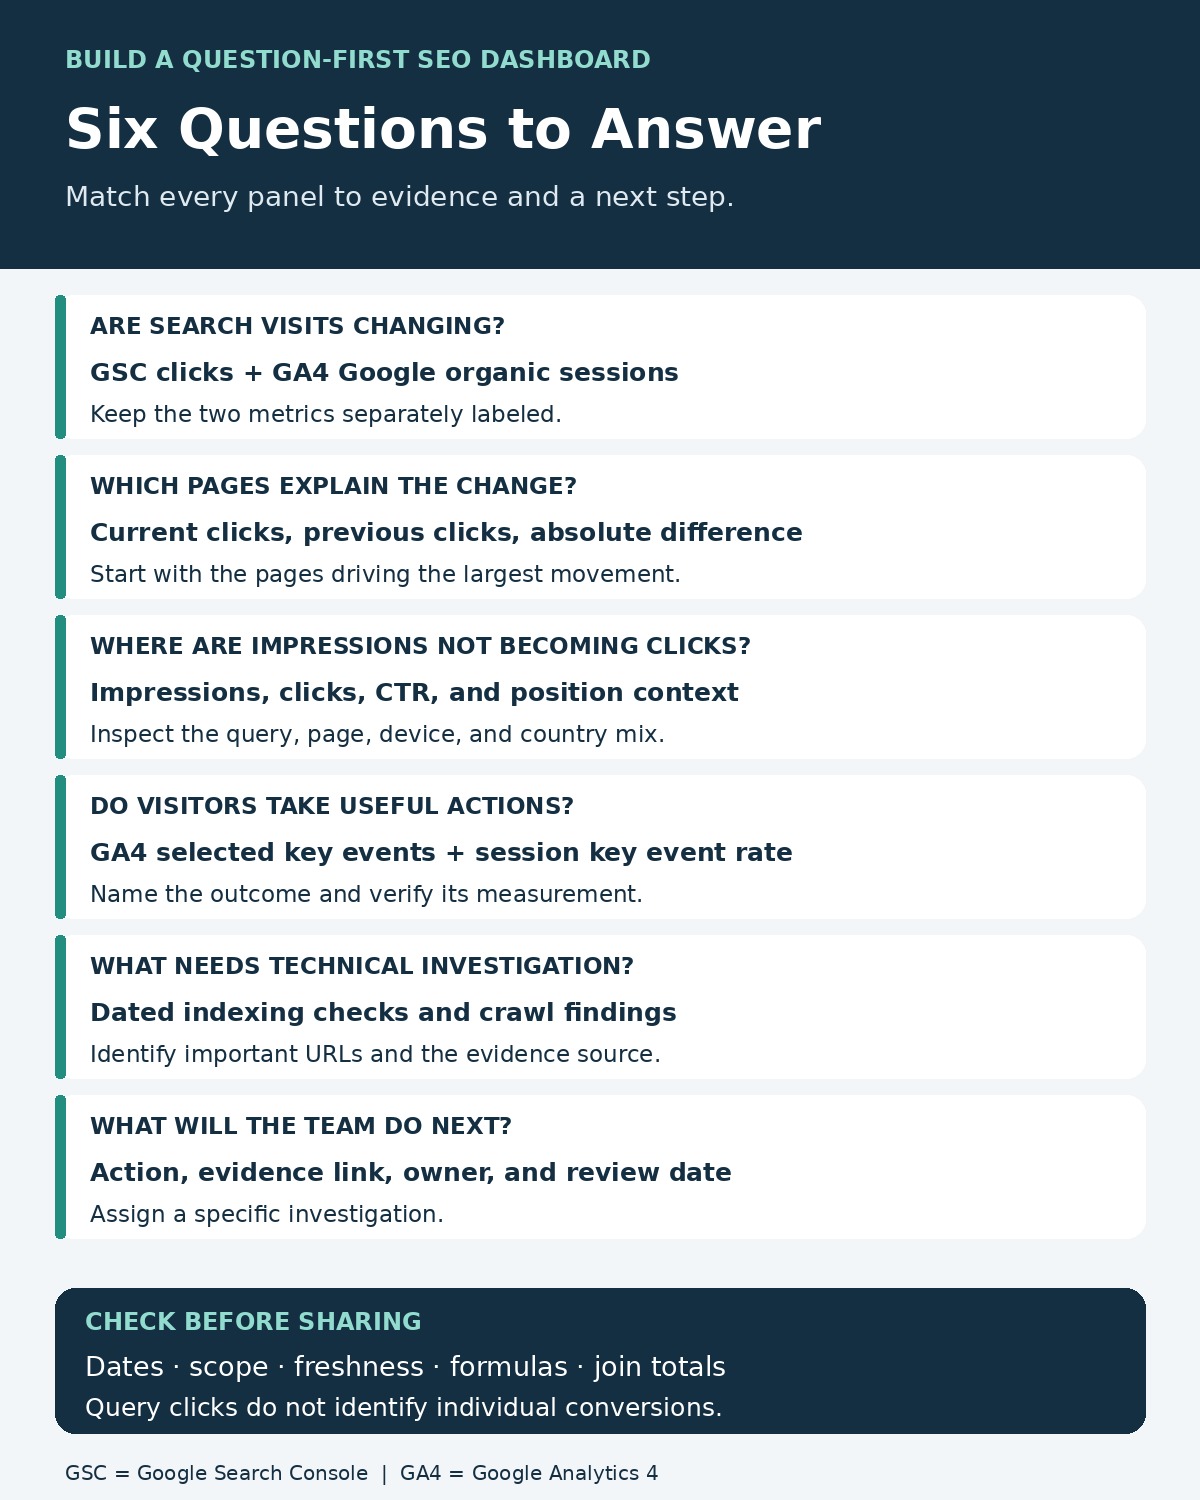
For each question, specify the evidence, the first useful breakdown, and the action it might lead to.
| Question | Evidence to show | First breakdown | Decision it supports |
|---|---|---|---|
| Are we getting more visits from Google Search? | Search Console clicks; GA4 Google organic sessions shown separately | Date and device | Decide whether to investigate a sustained change |
| Which pages explain the change? | Current and previous clicks, plus absolute difference | Landing page and content group | Identify the pages responsible for most of the movement |
| Where are we visible but receiving fewer clicks? | Impressions, clicks, CTR, and position context | Page, query, country, device | Inspect relevance and search-result presentation |
| Do search visitors complete useful actions? | Sessions, selected key events, session key event rate | Landing page or page group | Investigate traffic quality and the next step on the page |
| Are important pages facing a technical obstacle? | Dated indexing checks, crawl findings, or a maintained issue export | Template and affected URL | Assign a specific investigation to the right owner |
| What will the team do next? | Action, evidence link, owner, review date | Priority and status | Turn the report into a working queue |
This map also tells you what to leave out. A chart that answers no current question belongs in a separate exploration, if it is needed at all.
How to build seo dashboard to answer questions: Connect the sources
Use Search Console for Google Search visibility and clicks. Use GA4 for measured activity after people arrive. Add technical findings only when the question requires them, and keep the source and check date visible.
| Source | Useful contribution | Boundary to preserve |
|---|---|---|
| Google Search Console | Clicks, impressions, CTR, average position, pages and available queries | Does not provide a complete list of every search query or a user-level conversion journey |
| GA4 | Sessions, landing pages, key events and measured revenue where configured | Coverage depends on measurement setup; figures are not a second copy of Search Console clicks |
| Crawl or indexing review | URL-level findings such as unexpected noindex, redirects, or server responses | A crawl observation and Google’s indexing state are different kinds of evidence |
| CMS or content inventory | Category, author, template, publication and meaningful update dates | These attributes need a maintained mapping; they should not be guessed from every URL |
| Action log | What changed, who owns it, and when to review it | An annotation records timing; it does not prove causation |
If property selection and access are still unclear, read Google Search Console setup guide before connecting reports.
For this build, begin with a Google web-search view. Keep Discover, Google News, and other search types in clearly labeled separate views when you need them. Combining unlike surfaces into one unlabeled trend makes a change harder to interpret.
Build a small first version in Data Studio
Google’s current Data Studio documentation confirms the product name and report-building environment. You can start with native data sources and separate charts; a warehouse or custom API pipeline is not a prerequisite for a useful first report.
1. Add the correct Search Console data sources
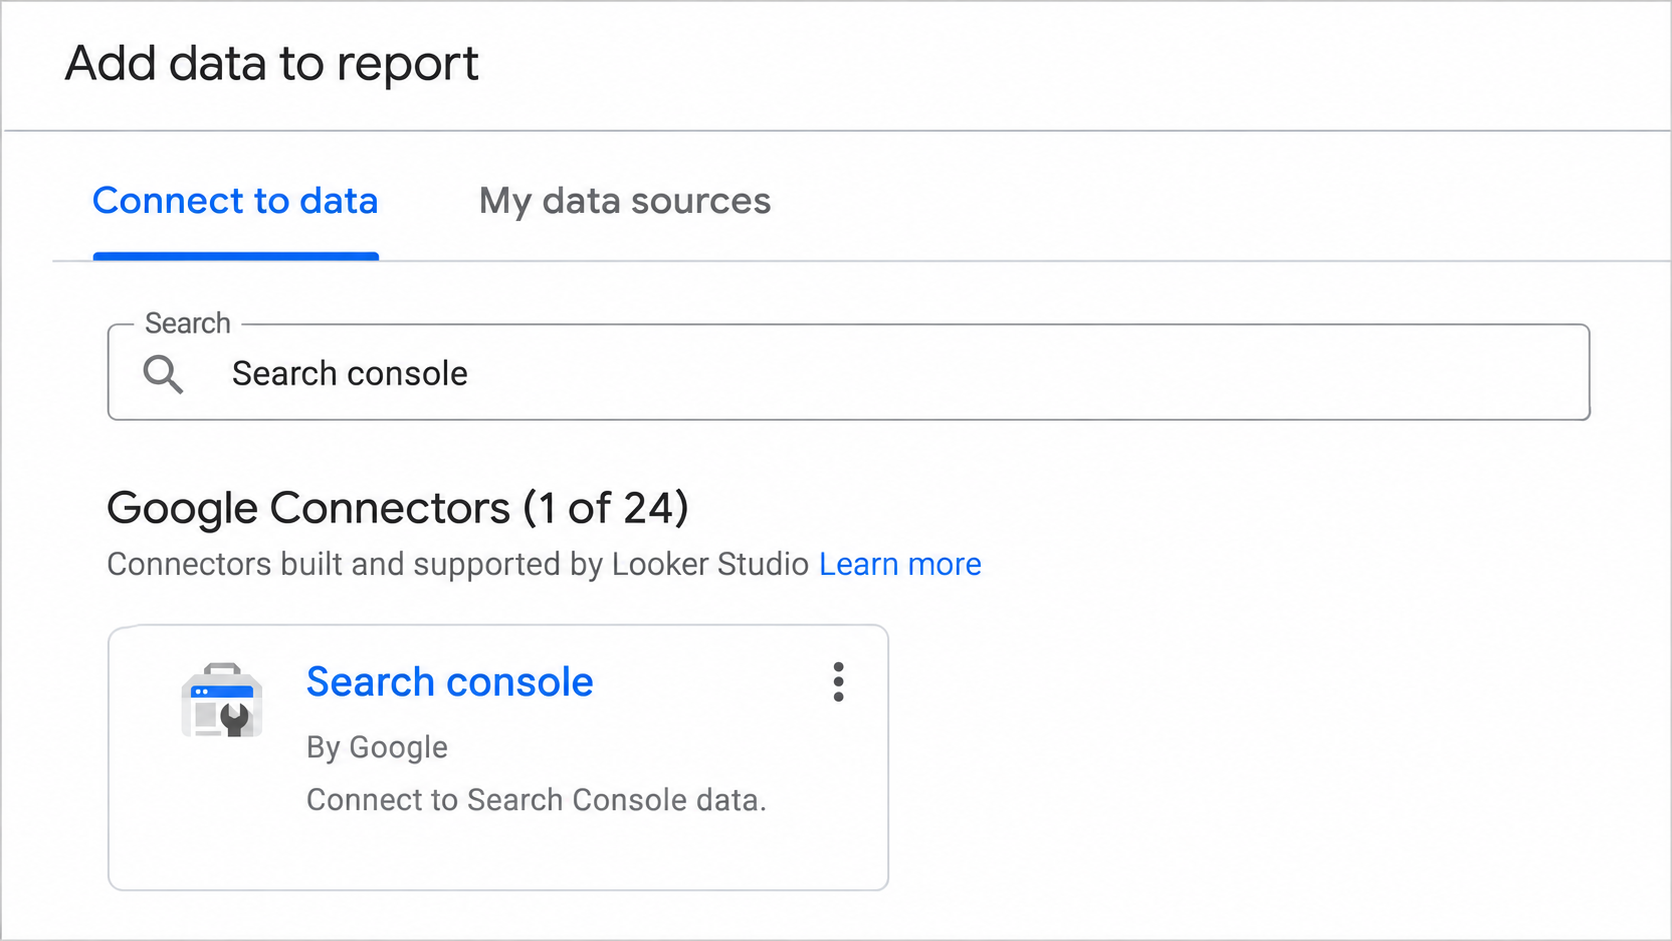
In Data Studio, choose Create → Data Source, select Search Console, authorize access if prompted, and select the intended property. Check that the property covers the hostnames and directories you mean to report on.
Choose Site Impression for a property-level view and URL Impression for page-level analysis. A Search Console data source uses one of these aggregation methods; create two sources if you need both. Label them clearly, such as “GSC — site — web” and “GSC — URL — web.”
The site and URL views count impressions differently. Their totals are not interchangeable, and a page-level chart should not be presented as though it has the same aggregation as a site-level scorecard.
2. Add GA4 and define the traffic scope
Add a second source using the Google Analytics connector, then select the correct account and GA4 property. Google’s GA4 connector documentation describes that flow.
For comparison with Google Search clicks, filter the relevant GA4 charts using Session source = google and Session medium = organic. For a wider all-search-engine view, use the appropriate Organic Search channel selection and label it accordingly. Do not switch between those scopes while retaining the same chart title.
Search Console clicks and GA4 sessions will not match exactly. They measure different things, and tracking, time zones, canonical URLs, and other reporting differences can affect the comparison. Keep the two series separately labeled rather than forcing one to reconcile to the other.
3. Choose comparable dates and visible filters
A useful default is the latest 28 completed days, compared with the previous 28 days. That gives both periods the same weekday mix. It is a reporting choice, not a Google requirement, and it should not be labeled “month over month.”
Show the exact start and end dates. Add a prior-year comparison when seasonality matters, and usable history exists. For breaking news or seasonal events, a shorter comparison may answer a different question more effectively.
Keep the selected property, country, device, search type, and data-through date visible. Search Console daily dates use Pacific Time, while GA4 uses the property’s reporting time zone. If those differ, disclose the mismatch instead of calling daily cross-source totals perfectly aligned.
A date control is only useful if it affects the intended charts. Test it, especially when one report contains several sources.
4. Put the answer above the detail
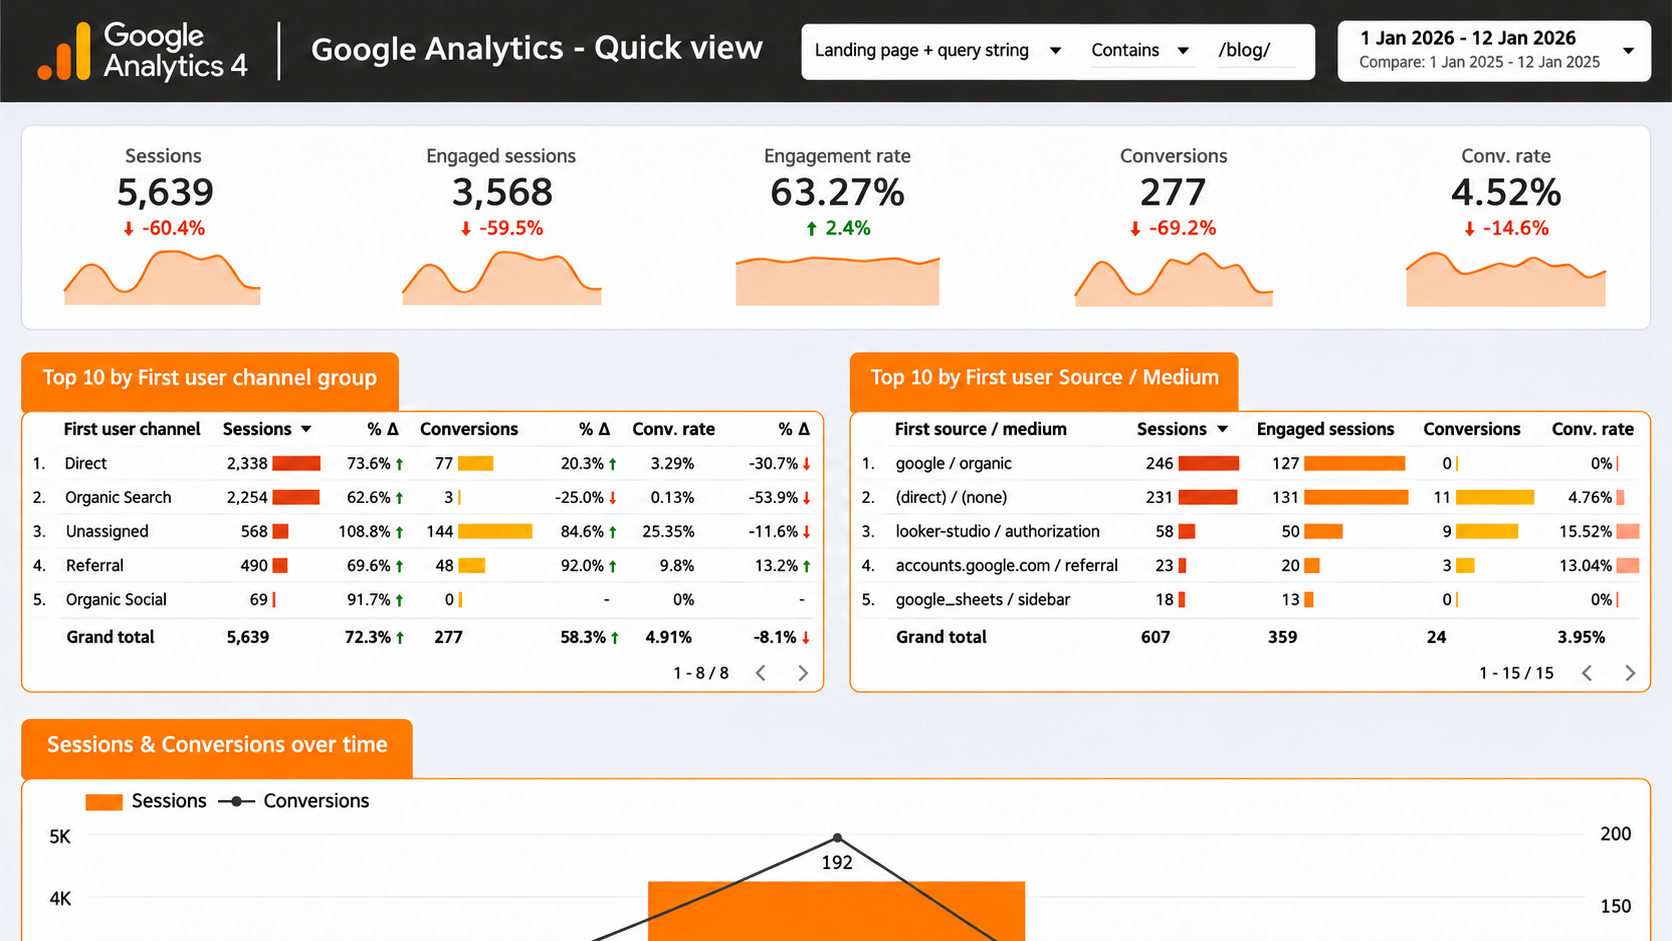
Use a compact summary with clicks, impressions, CTR, Google organic sessions, and one meaningful outcome metric. Show each source beside its metric. Put “data through” and last refresh information where a viewer can see it without opening settings.
Under the summary, add a short interpretation field written by the report owner. For example: “Most of the click decline is concentrated in three older guides; the rest of the section is broadly stable.” That sentence is an example of the form, not a finding about any real website.
The supporting page table should let the viewer verify that interpretation. Sort by absolute click change before percentage change, and include both periods. A page dropping from two clicks to one lost 50%, but another dropping from 2,000 to 1,600 accounts for far more lost visits.
Use the right calculation for each question
CTR is clicks divided by impressions. When combining compatible rows, calculate it from the totals rather than taking a simple average of row CTRs.
- CTR = SUM(clicks) / SUM(impressions)
- Click change = current clicks – previous clicks
- Click change % = (current clicks – previous clicks) / previous clicks
These are metric definitions, not guaranteed connector-specific formula syntax. Protect against a zero denominator: show “new” or “no comparison” when the previous value is zero, and “not applicable” when impressions are zero.
Use the source’s appropriate aggregate for average position. A simple average of the positions in a visible query table can produce a misleading sitewide number, particularly when the rows do not represent the complete dataset. Position also changes with the mix of searches, devices, and locations; it is not a single fixed rank for a page.
Google documents clicks, impressions, CTR, and position, including their interpretation limits.
For outcomes, distinguish an event count from a rate. GA4’s session key event rate describes the share of sessions in which a key event occurred. If you care about one specific outcome, use the appropriate event-specific metric where available and label the selected event. Dividing total event occurrences by sessions is not the same calculation when a session can trigger the event several times.
Read a change without jumping to a cause
Consider this illustrative Search Console example, using the same page group, filters, search type, and aggregation in each period:
| Metric | Previous 28 days | Current 28 days | Change |
|---|---|---|---|
| Clicks | 1,000 | 800 | −200; −20% |
| Impressions | 20,000 | 25,000 | +5,000; +25% |
| CTR | 5.0% | 3.2% | −1.8 percentage points |
The group appeared more often but received fewer clicks. That is enough to justify investigation. It does not establish that a title change, a competitor, or a particular Google feature caused the decline.
Start by asking whether the group gained low-CTR queries, changed its country or device mix, or lost clicks on a few previously strong pages. Then inspect the relevant results and page content. A blended average position can hide those differences.
Avoid turning the CTR gap into a promised traffic recovery. Applying an old CTR to today’s impressions assumes the search mix and result presentation are comparable, which may be exactly what changed.
Keep query reporting separate from conversion reporting
A query table can show which available search terms bring visibility and clicks. A landing-page report can show measured outcomes associated with sessions beginning on those pages. Placing the two together does not reveal which individual query produced a sale.
There is also a straightforward way to inflate a dashboard accidentally. Suppose a page has 100 GA4 sessions and appears in ten Search Console query rows. Joining the page-level session total to each query row and then summing it can produce 1,000 reported sessions. The example is arithmetic, not an observed account error.
For an initial dashboard, keep query charts and GA4 outcome charts separate. If a page-level blend becomes necessary, aggregate each source to a compatible shared row definition first—for example, date, normalized page, country, and device — and verify that the join keys are unique on each side. Align filters and handle unmatched records explicitly.
Do not assume every date can be aligned exactly in a native blend. Different source time zones may require a documented compromise or a more deliberate pipeline. URL normalization also needs care: remove tracking parameters only where they do not change page identity, and do not collapse different language versions or meaningful paths.
Google warns that multiple join matches can expand blended data. Compare totals before and after every new blend.
Show coverage limits instead of hiding them
Search Console protects query privacy and limits the data exposed through different reporting routes. A total built from visible query rows can therefore differ from an unfiltered property total. Keep an “unclassified or unavailable” category where needed rather than pretending that named queries explain every click.
A branded/non-branded split needs the same care. Maintain the brand names, product names, and spelling variants used by the filter, and label it as a classification of available queries. A broad match can include unrelated words; hidden queries cannot be confidently assigned to either group.
For a custom Search Analytics API pipeline, rowLimit can be set up to 25,000 per request, with startRow for pagination. The API documentation explicitly says it does not guarantee every data row. Pagination is not permission to call an extract complete.
If native reporting no longer meets the team’s scale or history requirements, evaluate Search Console’s daily BigQuery bulk export. Google documents it as a broader export route with query-privacy limits. It requires a configured Cloud project with billing; storage and query costs can apply. Historical data from before setup is not automatically backfilled by the new export.
Give technical findings their own evidence trail
A technical panel should name the affected page group, the finding, the source, and the check date. “Important product pages returning 5xx in the latest crawl” is a more useful starting point than an unexplained health score.
Keep performance data, indexing observations, and crawler findings separate. A crawler seeing a page today does not establish Google’s current indexing decision. An excluded URL is not automatically an error: a redirect or duplicate may be expected.
Use a maintained list of URLs intended to be indexed when evaluating coverage. Explore the guide to reading the Page Indexing report, which explains why the total “Not indexed” count needs context.
A first dashboard can use a manually maintained issue sheet if the owner records the source and review date. It is better to show a dated finding honestly than to present an old audit as live monitoring.
Finish with an action queue and a validation check
Add a small action table: question, affected page group, evidence link, next step, owner, status, and review date. Keep the next step specific enough to complete. “Inspect whether the decline is concentrated in mobile queries” is actionable; “improve SEO” is not.
Before sharing, check the following:
- Match several headline figures to the source report using the same property, dates, filters, search type, and aggregation.
- Confirm that changing a country, device, or date control affects every chart it is supposed to affect.
- Check zero denominators, missing data, stale imports, and incomplete recent periods.
- Compare source totals with joined totals and inspect unmatched URLs.
- Trigger the intended key event in an authorized test and verify the measurement separately from dashboard formatting.
- Review sharing and data credentials. A report viewer may be able to see data through an owner’s credentials without having separate access to the source.
The final access check matters because presentation and permission are different settings. Google explains those credential options in its data-source documentation.
During the first review meeting, ask someone who did not build the report to identify the largest meaningful change and the next investigation. If they cannot find both, revise the labels, breakdowns, or layout before adding another chart.