

A SaaS company can report 102% net revenue retention and still lose 16% of its opening revenue through cancellations and downgrades. Both numbers can be accurate. One shows how much revenue leaked out; the other shows whether expansion from remaining customers covered the damage.
This is why SaaS churn benchmarks become misleading so easily. A monthly customer-churn rate for a $20 self-service product cannot be compared fairly with annual revenue retention for enterprise software. They measure different losses across different periods and customer relationships.
I do not call a churn rate “good” until I know what is being measured, who the company sells to, how much those customers pay, and whether expansion revenue is hiding weaker underlying retention.
The benchmarks below use the latest reliable private-software data available, including full-year 2025 results published in 2026. Older ChartMogul figures are clearly identified as monthly customer-churn benchmarks so they are not mistaken for annual revenue retention.
Three Churn Metrics That Should Not Be Confused
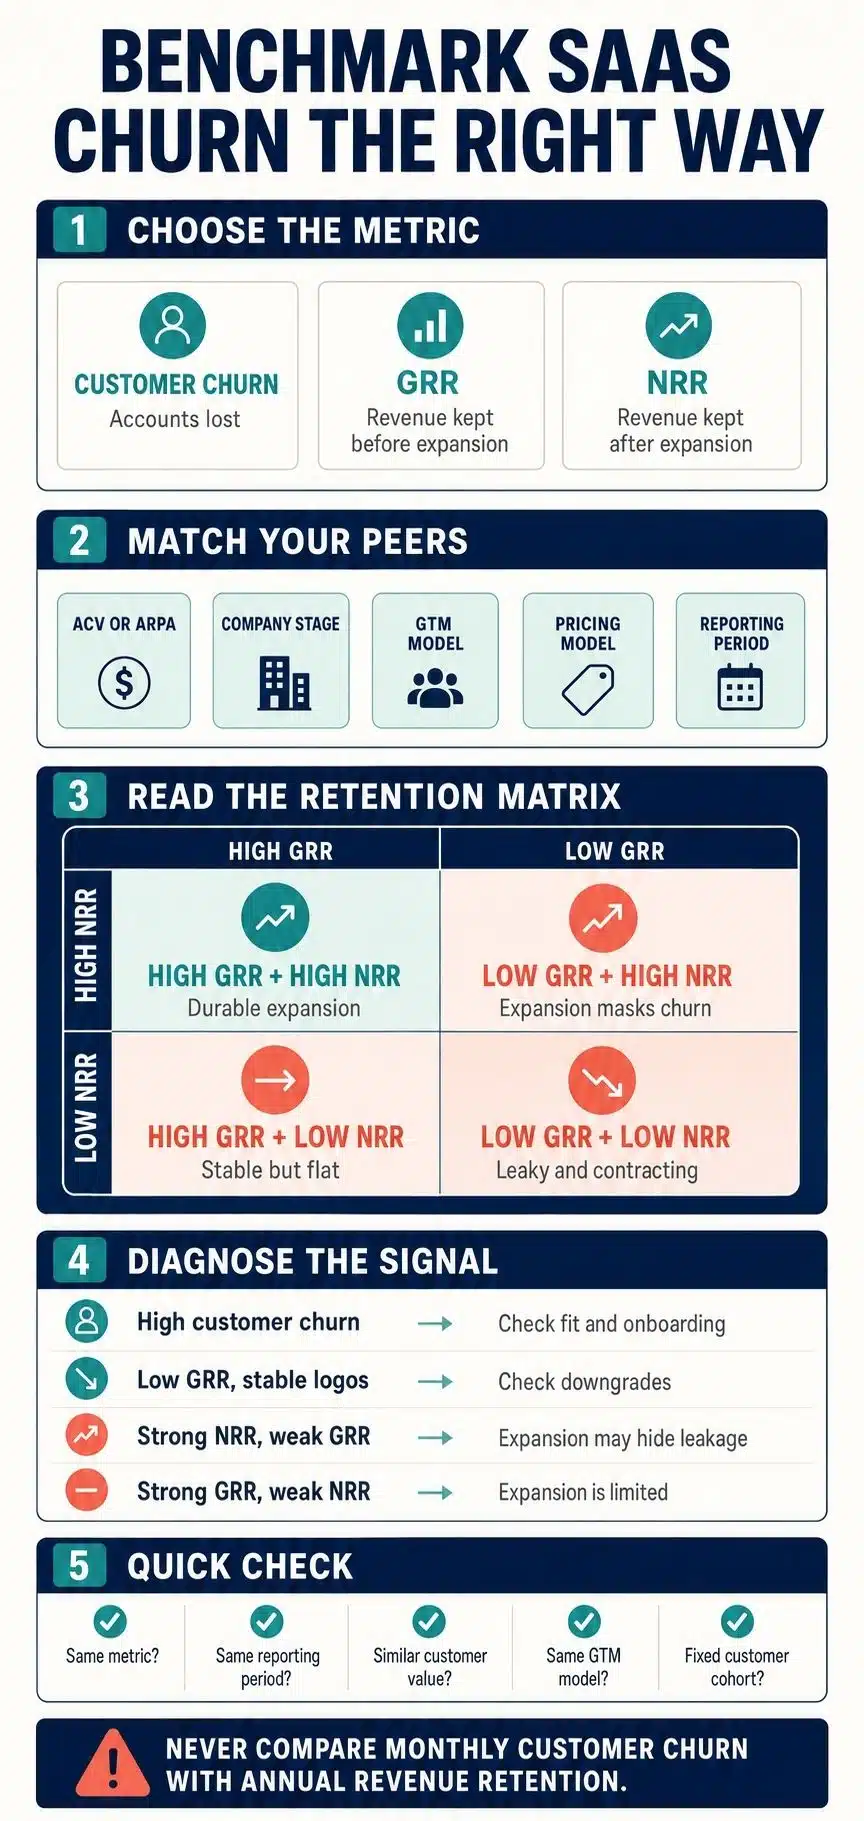
Before looking at the numbers, it helps to separate the three measurements used throughout this article.If gross revenue retention, or GRR, is 84%, gross revenue churn is 16%.
- Customer churn: Percentage of customer accounts lost
- Gross revenue retention: Revenue retained after cancellations and downgrades, excluding expansion
- Net revenue retention: Revenue retained after cancellations, downgrades, upgrades, and expansion
Net revenue retention, or NRR, can exceed 100% because it includes expansion. An NRR of 103% means the opening customer cohort produces 3% more revenue after accounting for lost and contracted revenue.
NRR above 100% does not mean nobody churned. It only means the customers who stayed generated enough additional revenue to outweigh the losses.
12 SaaS Churn Benchmarks That Actually Mean Something
A churn percentage means very little without the right context. These 12 SaaS churn benchmarks show how retention changes with contract value, pricing, company size, and go-to-market model, while revealing when strong expansion is masking a weaker customer base.
1. Median Annual GRR Fell to 84%
A 2026 Aleph and Benchmarkit study examined 342 B2B SaaS and AI-native software companies using full-year 2025 results. Among the 226 companies that reported GRR, the median was 84%.
In practical terms, the median company lost 16% of its opening recurring revenue through cancellations and contractions before counting upgrades, expansion, or new customers.
For a business beginning the year with $10 million in recurring revenue, that creates a $1.6 million hole. The company must replace it before producing any actual growth.
The figure is useful, but its mixed sample matters. It combines conventional B2B SaaS with AI-native companies, some of which have unusually volatile retention. I would treat 84% as a broad market reference, not a universal target for every SaaS category.
2. Top-Quartile Companies Retain 91% of Their Revenue
The same study shows how wide the retention gap has become.
| Performance level | Annual GRR | Gross revenue lost |
| Top quartile | 91% | 9% |
| Median | 84% | 16% |
| Bottom quartile | 76% | 24% |
A top-quartile company starts the year needing to replace 9% of its recurring revenue. A bottom-quartile company must replace almost one-quarter.
That difference changes the entire growth model. Higher churn raises the acquisition burden, makes forecasts less dependable, shortens customer lifetime value, and consumes resources that could have been used to expand the business.
This is why “we are near the industry median” is not always reassuring. The median describes where the market sits. It does not tell a company where it should aim.
3. Retention Deteriorated Across Every Quartile
GRR weakened throughout the market between 2024 and 2025:
- Median GRR declined from 88% to 84%.
- Top-quartile GRR declined from 95% to 91%.
- Bottom-quartile GRR declined from 81% to 76%.
The decline affected strong and weak performers, which suggests a wider market shift rather than a problem isolated to badly managed companies.
Buyers are scrutinizing software returns more closely, consolidating overlapping tools, cutting unused licenses, and comparing established products with emerging AI alternatives. Those conditions offer plausible explanations, although the data does not establish how much each one contributed.
External pressure still should not become an excuse. If churn rises, the company must determine whether the loss came from poor customer fit, weak onboarding, low adoption, pricing friction, product substitution, budget cuts, or customers simply no longer needing the product. Each cause requires a different response.
4. Sales-Led SaaS Retains More Revenue Than Product-Led SaaS
Median GRR differs sharply by go-to-market motion.
| Go-to-market model | Median annual GRR |
| Sales-led | 88% |
| Hybrid | 80% |
| Product-led | 79% |
Sales-led companies retain eight to nine percentage points more revenue than product-led and hybrid businesses.
This does not prove that adding a sales team automatically improves retention. Sales-led products usually have larger contracts, more detailed evaluation, structured implementation, dedicated account relationships, and multiple internal stakeholders. Those characteristics make the product harder to abandon.
Product-led software is easier to discover and purchase, but the convenience works both ways. Customers can often leave without disrupting an important workflow or explaining the decision to an account manager.
A PLG company with 82% GRR may therefore be outperforming its direct peers. A sales-led enterprise company with the same result may have a serious retention problem.
5. Larger Contracts Produce Stronger Gross Retention
Companies selling contracts worth $50,000 to $100,000 annually recorded a median GRR of 91%. Those with ACVs below $5,000 reported approximately 80%.
Higher-priced products usually involve more evaluation, integration, onboarding, training, support, and internal approval. Once software becomes embedded in an important workflow, replacing it requires time and carries operational risk.
Smaller customers are also more vulnerable to budget cuts, shifting priorities, business closures, and impulsive purchasing. A good product can still experience high churn if much of its customer base consists of young or unstable businesses.
Annual contract value is therefore one of the first filters I would use when benchmarking retention. A $25-per-month self-service tool and a $75,000 enterprise platform may both be SaaS, but their churn economics have very little in common.
6. Usage-Based Pricing Reached 108% NRR
The latest pricing-model comparison found a median NRR of 108% for usage-based products and 98% for seat-based products.
Usage-based revenue can expand naturally as customers process more transactions, make more API calls, store more data, or consume more computing resources. Seat-based expansion depends on customers adding employees or licenses, which becomes difficult when companies are controlling headcount and eliminating unused seats.
Usage pricing is not automatically safer. Revenue can contract just as naturally when customer activity falls. Poorly designed usage pricing may also make bills unpredictable and encourage customers to restrict adoption.
The real lesson is that pricing architecture affects whether customer growth becomes revenue expansion. A strong pricing model connects increased customer value with increased spending without making the bill feel punitive or surprising.
7. Median NRR Reached 102% While GRR Sat at 84%
The latest broad dataset reported median NRR of 102% alongside median GRR of 84%.
Because these are separate population medians, the 18-point difference should not be treated as the exact expansion rate of one imaginary average company. It still shows how dramatically expansion can change the appearance of retention.
The same research found that expansion generated 40% of net-new ARR at the median company. Among low-growth businesses, its contribution increased to 44%.
Expansion has clearly become a major growth engine. The danger appears when it is used to hide an unstable revenue base. A company may lose several customers and suffer downgrades while a smaller group of large accounts expands enough to keep NRR above 100%.
That business may still grow, but it carries concentration risk and a heavy dependence on continued upselling. NRR deserves attention, but it should always appear beside GRR.
8. Bootstrapped Scale-Stage SaaS Companies Reported 91% GRR
SaaS Capital’s 2026 research surveyed more than 1,000 private B2B SaaS companies. Among bootstrapped businesses with $3 million to $20 million in ARR, the reported benchmarks were:
- Median GRR: 91%
- Median NRR: 103%
- 90th-percentile GRR: 100%
- 90th-percentile NRR: 117.9%
The median business in this group lost 9% of its opening revenue before expansion. Growth within retained accounts then lifted the cohort to 103% NRR.
This is a healthier pattern than producing strong NRR on top of weak GRR. The existing revenue base is relatively stable, and expansion adds to it instead of merely repairing a large hole.
A 100% GRR result is possible, as the 90th-percentile figure shows, but it is not a sensible universal expectation. Customers close, merge, change strategy, complete temporary projects, or outgrow a product. Some churn is unavoidable even when the product and customer relationship are strong.
9. Monthly Customer Churn Generally Falls as SaaS Companies Scale
ChartMogul’s private SaaS data shows how median monthly customer churn changes by ARR.
| ARR | Median monthly customer churn |
| Below $300,000 | 6.5% |
| $300,000 to $1 million | 4.1% |
| $1 million to $3 million | 3.7% |
| $3 million to $8 million | 3.8% |
| $8 million to $15 million | 3.1% |
| $15 million to $30 million | 4.1% |
Retention usually improves as companies find product-market fit, strengthen onboarding, and become more disciplined about their ideal customer profile.
The improvement is not perfectly linear. Median churn rises again in the $15 million to $30 million band. Larger companies often enter new markets, introduce additional products, move upmarket, or build sales teams that target customers beyond the original ideal profile. Growth can weaken retention when expansion happens faster than the company learns how to serve those customers.
ARR maturity helps explain churn, but it does not eliminate the need for customer-fit discipline.
10. Customers Paying Less Than $25 Churn Much More Frequently
Average revenue per account, or ARPA, produces an even clearer pattern.
| Monthly ARPA | Median monthly customer churn |
| Below $25 | 6.1% |
| $25 to $100 | 4.2% |
| $100 to $250 | 3.1% |
| $250 to $500 | 3.0% |
| $500 to $1,000 | 2.2% |
| Above $1,000 | 1.8% |
If 6.1% monthly churn continued at the same rate, approximately 53% of the opening customer cohort would be gone after a year. The annual result is not 73.2% because monthly churn compounds against a shrinking cohort.
Higher-paying customers usually purchase more deliberately, receive more support, and integrate the software more deeply into their operations. They also face greater switching costs.
Raising prices alone will not reproduce those benefits. A higher price without better value, stronger onboarding, and appropriate support may increase churn. ARPA is useful because it reflects the type of customer relationship, not because price itself makes customers loyal.
11. Companies Below 60% NRR Have Roughly Double the Customer Churn
ChartMogul found that companies with NRR below 60% experienced a median monthly customer churn of approximately 7%. That was around twice the rate recorded by companies with NRR of at least 100%.
Some low-retention companies were still growing quickly. They acquired enough new customers to replace those leaving, at least for a while.
This is where topline growth can create false confidence. A company may celebrate a record sales quarter while repeatedly replacing customers who never remained long enough to become profitable. If acquisition costs increase or the available market begins to run out, that growth can reverse quickly.
Strong acquisition is valuable, but it is not a substitute for retention. A company that must constantly refill the same revenue hole does not have the same durability as one whose existing customer base stays and expands.
12. AI-Native Software Has a Distinct Retention Problem
A 2025 ChartMogul analysis examined approximately 3,500 software companies, including around 200 AI-native businesses. Among AI-native companies with at least $250,000 in ARR, the results were:
- Median GRR: 40%
- Median NRR: 48%
- Products below $50 per month: 23% GRR and 32% NRR
- Products priced from $50 to $249: 45% GRR and 61% NRR
- Products above $250 per month: 70% GRR and 85% NRR
Low-priced AI subscriptions currently behave very differently from established B2B SaaS. Many users subscribe out of curiosity, test the product, and leave when it fails to become part of a lasting workflow. The subscription may be paid, but the spending is still experimental.
Higher-priced AI products retain considerably more revenue. They are more likely to solve defined business problems, require implementation, and become embedded in serious workflows.
The AI-native sample is smaller than the general SaaS datasets, so these figures should be treated as directional rather than permanent industry standards. Even with that limitation, the price-level difference is too large to ignore. Rapid AI revenue should not automatically be valued as durable recurring revenue.
How to Benchmark Your Churn Without Fooling Yourself
I would use a simple process before deciding whether a churn rate is healthy.
- Match the metric: Monthly customer churn, annual GRR, and annual NRR cannot be used interchangeably.
- Compare the right customer group: Segment retention by ACV, ARPA, product, pricing model, industry, company size, and go-to-market motion. A blended company-wide figure can hide one healthy segment and one serious problem.
- Read customer churn, GRR, and NRR together: Customer churn shows how many accounts left. GRR shows how much revenue disappeared before expansion. NRR shows whether the retained base compensated for those losses.
- Separate cancellations from contractions: A complete cancellation may point to poor fit, failed adoption, or business closure. A downgrade may reveal weak value realization, excessive seat commitments, or pricing that no longer matches usage.
- Compare the company with itself: External benchmarks provide context, but a deteriorating retention trend deserves attention even when the current number still appears better than the industry median.
The most useful SaaS churn benchmarks do not hand every company the same target. They help explain where revenue is leaking, whether expansion is hiding the damage, and how much new business is required merely to stand still.
Frequently Asked Questions on SaaS Churn Benchmarks
1. What is a good SaaS churn rate?
There is no universal good rate. Established B2B SaaS companies can generally view 90% or higher annual GRR as a strong target, while low-priced product-led tools may retain less. The most useful comparison is with companies sharing a similar ACV, pricing model, and customer segment.
2. Is 5% monthly SaaS churn too high?
For most B2B SaaS companies, 5% monthly customer churn is substantial. If it continued consistently, approximately 46% of the opening customer cohort would be gone after one year. It may be more common among early-stage or inexpensive self-service products, but it still deserves investigation.
3. What is the difference between customer churn and revenue churn?
Customer churn measures the percentage of accounts lost. Revenue churn measures the recurring revenue lost through cancellations and, in gross calculations, downgrades. Losing one large enterprise account may barely change customer churn while causing serious revenue damage.
4. Can a SaaS company lose customers and still have NRR above 100%?
Yes. Upgrades, additional usage, cross-sells, or price increases from remaining customers can outweigh the revenue lost from cancellations and downgrades. This is why NRR above 100% does not prove that customer churn is under control.
5. Should a SaaS company prioritize GRR or NRR?
Both matter, but GRR provides the cleaner view of underlying revenue durability because expansion cannot improve it. NRR then shows whether retained customers are generating additional revenue. The healthiest pattern is strong NRR built on strong GRR, not expansion being used to disguise a leaky customer base.