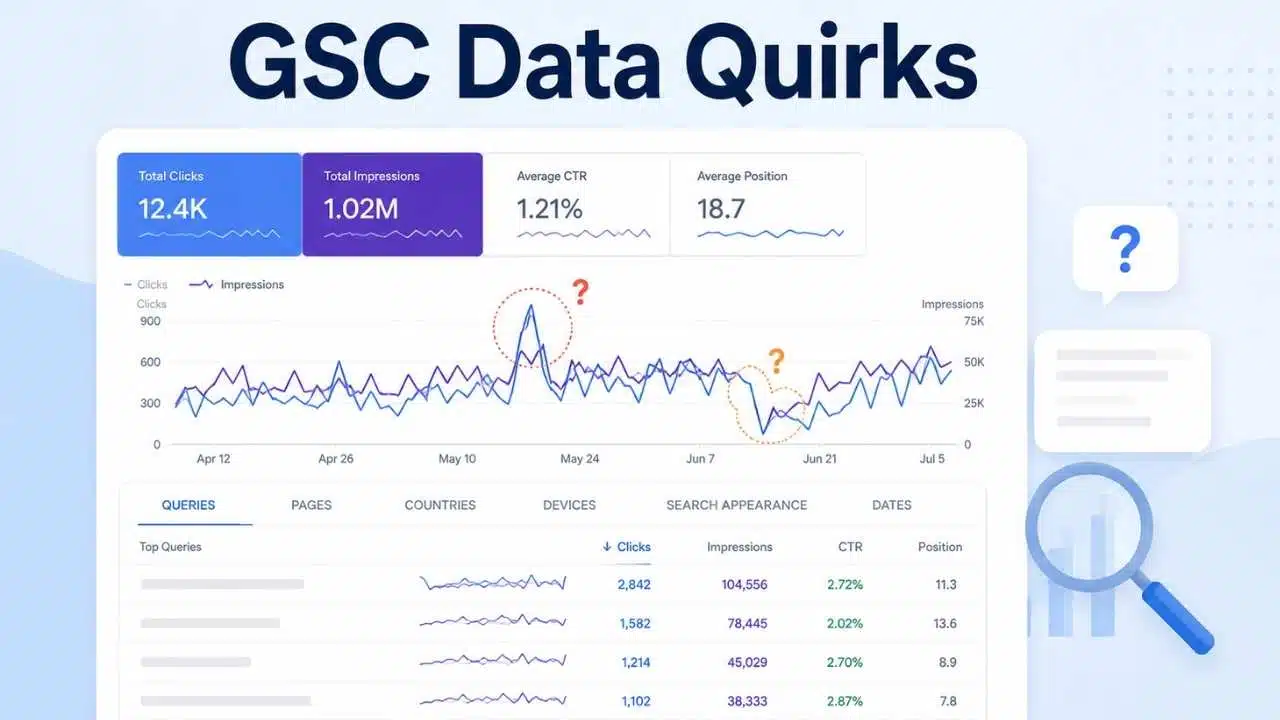
GSC data quirks prevents SEOs from mistaking normal reporting anomalies for indexing or ranking problems. Discrepancies like query click totals mismatching overall charts, average positions shifting without rank changes, or data vanishing after canonical shifts stem directly from Google’s reporting architecture.
Google Search Console relies on privacy thresholds, anonymized queries, canonical URL aggregation, and non-standard SERP feature tracking rather than real-time server log analytics. Consequently, metrics often reflect data filtering rather than site performance issues. Recognizing these underlying data quirks allows search strategists to accurately isolate genuine algorithm updates and technical errors from harmless system aggregation behaviors.
The Boring Check That Prevents Bad SEO Diagnoses
Before investigating a discrepancy, make sure both reports are actually measuring the same thing.
Check the:
- Search Console property;
- date range;
- search type;
- country;
- device;
- page and query filters;
- aggregation level;
- time zone;
- data source: interface, API, or BigQuery.
Property scope deserves particular attention. A Domain property can include multiple protocols and subdomains, while a URL-prefix property covers a narrower set of URLs.
A report for https://www.example.com/ should not be expected to match a Domain property containing http, https, www, non-www, and relevant subdomains.
Fix these basic mismatches first. They explain more “data anomalies” than many technical SEO investigations.
1. Recent Data Can Be Late, Preliminary, or on a Different Clock
Search Console does not use one freshness rule for every view. Standard Performance data normally arrives after roughly two to three days. The newest data may still be preliminary while Google finishes processing it.
The 24-hour view is deliberately faster. It exposes hourly performance with only a few hours of delay, and incomplete periods appear with a dotted line.
That makes it useful during launches, major news events, migrations, or sudden traffic changes. It also makes it easier to overreact. There is a second detail that causes quieter discrepancies: time zones. The 24-hour view follows the browser’s local time. Standard daily, weekly, and monthly Performance reporting uses Pacific Time.
An SEO team in London comparing GSC with a UTC warehouse can therefore see clicks move between calendar days even when nothing is missing. The same issue becomes more obvious for teams in Asia or Australia.
For normal monthly reporting, the difference is usually minor. For hour-by-hour analysis, it matters. Avoid treating an incomplete dotted-line period as a final daily result.
2. The Query Table Is Not Your Full Keyword Universe
One of the first Search Console surprises comes from adding the visible query rows and getting fewer clicks than the total above them.
Google withholds some low-frequency queries to protect user privacy. Those anonymized searches can still contribute to the overall chart while remaining absent from the identifiable query table.
The interface also displays only up to 1,000 table rows, and Google’s processing limits mean Search Console does not expose every possible long-tail row.
Filtering makes the gap more obvious. Imagine an unfiltered report with 50,000 clicks. You create one query filter for searches containing the brand and another for searches that do not contain it.
Those totals may not add back to 50,000. Once a manual query filter is applied, anonymized queries cannot be classified against that condition, so they disappear from the filtered totals. This matters for branded-versus-non-branded reporting, especially on sites with large amounts of long-tail demand.
Search Console now provides its own branded/non-branded query classification for eligible properties. Even there, Google warns that classifications can be imperfect, and the feature may not be available on properties with insufficient impression volume.
The practical rule is simple: the query report is not a census of every keyword that generated search visibility. Do not present it as one.
3. Changing From Queries to Pages Changes How GSC Counts
This is one of the most important quirks for technical reporting. The Performance chart is aggregated at the property level. When the table is grouped by dimensions such as Queries, Countries, Devices, or Dates, the table also uses property aggregation.
Switch to Pages or Search appearance, however, and the table uses page aggregation while the chart remains property-aggregated. That change can produce different totals without any underlying traffic change.
Suppose several URLs from the same property appear within one Google search element. At property level, the property may receive one impression for that element. At page level, several URLs can each receive an impression. Now sum the page rows and compare them with the property chart. The page total may be higher.
This can look like duplicate reporting if the aggregation rule is not understood. Page or Search appearance filters can also make totals rise or fall because applying them can change the grain of the report.
Before diagnosing cannibalization, duplicate indexing, or corrupted data, check whether you simply moved from property-level counting to page-level counting. That should be one of the first questions in any GSC discrepancy audit.
4. The URL That Ranked May Not Be the URL Holding the Data
Search Console generally assigns Performance data to the canonical URL Google selects. That means the URL shown to a searcher and the URL holding the performance metrics in GSC can differ.
Suppose Google treats:
/product?colour=blue
as a duplicate of:
/product
If the parameterized version appears in search and receives a click, the performance can still be attributed to the canonical /product URL.
This is especially relevant during:
- canonical changes;
- HTTP-to-HTTPS migrations;
- hostname consolidation;
- duplicate parameter cleanup;
- alternate mobile implementations;
- large migrations;
- international setups with related pages.
A page-level traffic decline can therefore be an attribution change rather than a ranking loss. When performance unexpectedly moves between URLs, check the Google-selected canonical in URL Inspection before assuming visibility disappeared. Post-click redirects are different.
If Google sends the user to URL A and the site then redirects that person to URL B, Search Console does not simply transfer the original search impression and click to B. GSC is reporting the interaction with Google Search, not the visitor’s entire journey after leaving Google. That distinction becomes important when reconciling migrations with analytics or server logs.
5. Average Position Is Not a Literal Rank
Average position is probably the most overinterpreted number in Search Console. If it moves from 4.3 to 6.1, it is tempting to say rankings dropped by roughly two positions.
That may be directionally true. The metric itself is more complicated. For each qualifying impression, Search Console records the topmost position occupied by the relevant property or page. Those recorded positions are then averaged across the selected data. If a property appears at positions 2, 4, and 6 in one search, the property-level position for that impression is 2.
Modern SERPs make interpretation harder. Carousels, rich results, AI features, and other compound search elements can occupy a position while containing several links. Their visual prominence is not always comparable with a traditional blue link sitting at the same numerical position. Google itself cautions against treating position too literally.
The best use of the metric is comparative:
- one query over time;
- one page before and after a change;
- desktop versus mobile;
- one country against another;
- branded versus non-branded segments where available.
A sitewide average position can move because the mix of queries receiving impressions changed, even if important rankings stayed stable.
As of June 2026, Google has also begun providing dedicated Generative AI Performance reporting to a subset of sites, offering additional visibility into impressions from features such as AI Overviews and AI Mode. That data still contributes to broader Search Performance reporting. Average position is useful context. It is not a replacement for understanding the actual SERP.
6. A Search Console Click Is Not a Google Analytics Session
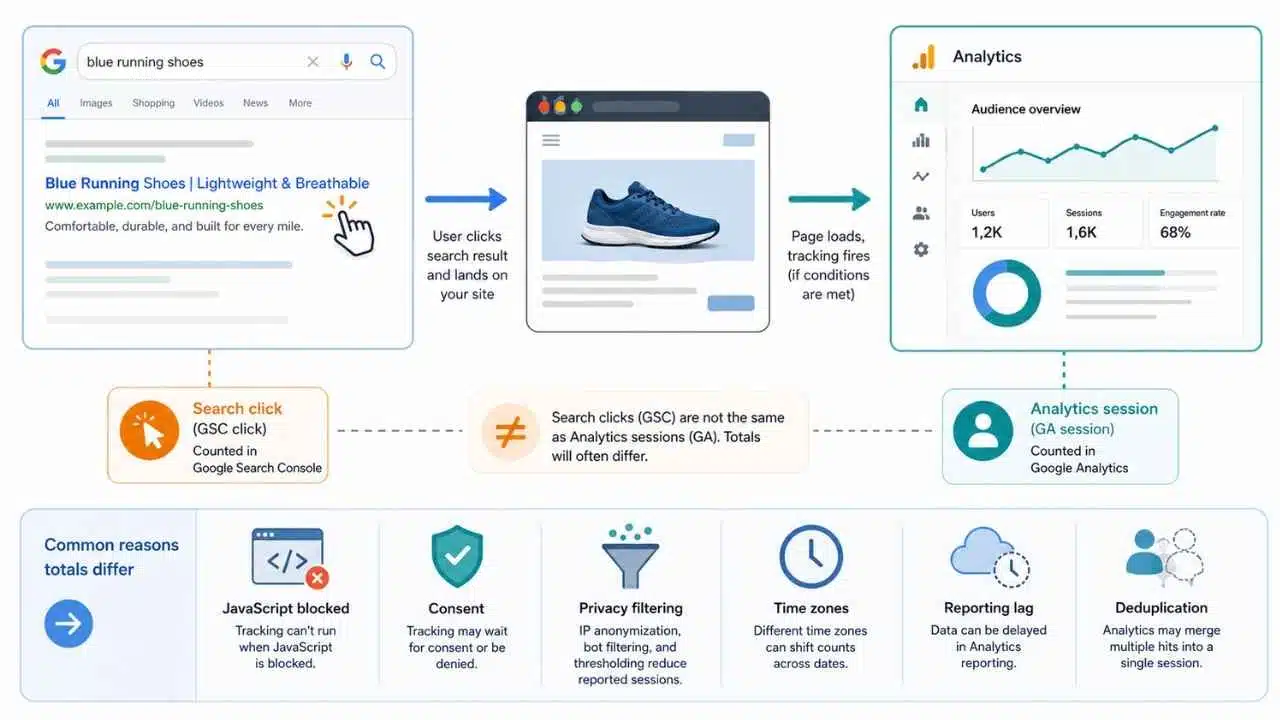
GSC and Google Analytics measure different parts of the journey. Search Console records qualifying interactions with Google Search. Analytics measures activity once its own collection system operates on the site.
Those two events do not have to match one-for-one.
Differences can arise from:
- JavaScript failing or being blocked;
- analytics implementation problems;
- consent behavior;
- privacy filtering;
- processing and deduplication;
- reporting lag;
- different time zones.
Search Console also has its own click rules.
A click that sends someone from Google to an external page generally counts. An interaction that merely changes or refines the Google search experience may not. Repeated interactions can also be counted differently from analytics sessions.
AI search experiences add another reporting layer, but the same basic distinction holds: Search Console describes visibility and interaction within Google Search, while site analytics describes what happened after arrival. Expect the two systems to tell a broadly compatible story.
Do not expect the totals to be identical. If GSC clicks collapse while organic landing sessions remain stable, investigate. A normal percentage difference between the two is not, by itself, evidence of broken tracking.
7. The UI, API, and BigQuery Are Not the Same Dataset in Different Wrappers
Small sites can often work comfortably inside the Search Console interface. Large sites eventually hit its limits. The interface shows up to 1,000 table rows. The Search Analytics API can return up to 25,000 rows in an individual response and supports pagination. Google currently documents a ceiling of 50,000 rows per day per search type through the Search Analytics method, ordered by clicks.
For a publisher or marketplace producing hundreds of thousands of query combinations every day, that matters. Moving to the API does not magically expose every hidden row.
BigQuery bulk export is the more appropriate option once normal Search Analytics limits materially affect analysis. It exports daily performance into site-level and URL-level tables without the normal 50,000-row daily Search Analytics ceiling.
But warehouse access creates a new source of mistakes. BigQuery rows are not necessarily pre-aggregated final totals. Google’s export can contain repeated keys because data accumulates incrementally.
The analyst needs to group the correct dimensions and sum the metrics. Anonymized query rows are also present in the current schema, identified separately while the actual query text remains withheld.
Average position requires similar care. Do not average averages. Use the exported position totals and impression counts according to the schema.
BigQuery gives an SEO more complete data and more responsibility. A technically sophisticated dashboard can still be wrong if the SQL misunderstands the GSC data model.
8. Search Appearance Is Not Perfect Click Attribution
Search appearance is useful for separating features such as product results, video treatments, discussion results, and other enhanced search experiences. It is easy to read too much into it.
One page can qualify for multiple Search appearance types within the same search context. That means adding every Search appearance row together is not necessarily a valid way to reconstruct total impressions.
Click attribution has another subtle limitation. If a report is filtered by a Search appearance type, Google does not always guarantee that the click happened directly on that visual feature.
The stronger supported statement is that the URL appeared with that feature in the same result set in which the user clicked a link for the URL. Those are not identical claims.
A dashboard saying:
“Product rich results generated 4,200 clicks”
may therefore be more precise than the underlying GSC data allows. Search appearance also brings the aggregation issue from item 3 back into play because the table becomes page-aggregated while the chart remains property-aggregated. Use the dimension to understand how URLs appeared in search. Do not treat it as perfect event tracking for individual SERP components.
Final Thoughts
Understanding GSC data quirks is less about memorizing exceptions than recognizing that Search Console is a processed reporting system, not a raw search-event database.
Google applies privacy protection, canonical consolidation, aggregation rules, search-feature-specific counting, time-zone conventions, data delays, and export limits before the numbers reach an SEO dashboard. When something looks wrong, work through the reporting model before searching for an SEO explanation.
Confirm the property, dates, search type, filters, and time zone. Check whether aggregation changed. Look for anonymized-query effects. Verify the canonical. Be suspicious of overly literal interpretations of average position and Search appearance.
On large sites, also ask whether the interface is still adequate. The API may expose more rows, and BigQuery can provide a much stronger analytical foundation, but neither protects analysts from bad grouping or incorrect assumptions. Good SEO analysis explains a change in performance. Better analysis first establishes exactly what the metric was measuring.