
Your website goes down at the worst times, and you lose customers, rankings, and trust. Many site owners face slow pages, failed http requests, and expired SSL certificates. They miss sales, and they fall in search results.
Continuous website monitoring, via real user monitoring and synthetic transaction monitoring, stops many of these problems. 67% of websites lose revenue because of poor user experience.
This post shows seven AI tools that watch your site, and act before users notice downtime. I cover Datadog, Site24x7, New Relic, UptimeRobot, Pingdom, Better Stack, and Uptrends, with notes on uptime monitoring, anomaly detection, predictive analytics, and incident timelines.
You will see how machine learning and large language models help find root causes, cut recovery time, and keep page load speed steady. I will help you pick a tool for your budget, cloud providers, and team skills.
Keep reading.
Key Takeaways
- 67% of websites lose revenue from poor UX, so tools like Datadog, New Relic, Site24x7, UptimeRobot, Pingdom, Better Stack, and Uptrends stop outages.
- Better Stack’s AI reaches up to 90% anomaly accuracy and cuts incident resolution by over 7 minutes, while generative AI can cut monitoring costs 60–80%.
- Affordable tiers exist: UptimeRobot free 50 sites (5‑min), Pro $7/mo; Better Stack free 10 monitors, Pro $21/mo; Datadog starts $6/host.
- Combine synthetic monitoring, RUM, API, DNS and server checks with LLMs for root‑cause analysis and incident timelines to cut downtime and protect core web vitals.
- Verify integrations, SLA, compliance (SOC 2, HIPAA), model access, and data‑leakage safeguards to avoid prompt injection and protect customer telemetry.
UptimeRobot
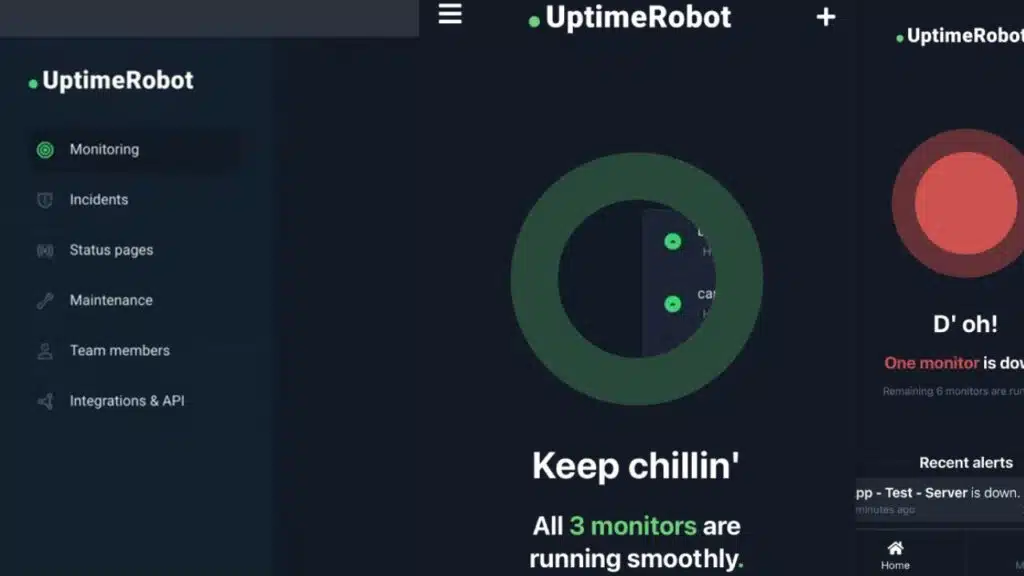
UptimeRobot watches your site like a night guard, it runs synthetic monitoring with heartbeat checks, DNS lookups, API checks, and scheduled task checks every minute.
It fires push alerts to the Telegram app or via SMTP, tracks uptime monitoring and page load speed, and flags anomalies so site reliability engineers can act fast to protect core web vitals.
Key Features and Benefits
The free plan covers 50 sites, with 5-minute check intervals. Paid tiers add 1-minute checks for faster detection. It monitors HTTP and HTTPS, TCP, DNS, SSL/TLS, and synthetic browser checks.
Synthetic monitoring simulates browsers, and it helps track page load speed, core web vitals, and website performance.
Pro plans start at $7 per month, and they include instant alerts and public status pages. Alerts go out via email, SMS, Slack, PagerDuty, and webhooks for real-time alerts. A built-in SLA downtime calculator shows that 99.9% uptime allows about 43 minutes of downtime per month.
Public status pages cut support tickets, and they boost user confidence for uptime monitoring; solo users and small businesses get strong value, thanks to low cost and ease of use.
AI Capabilities for Downtime Prevention
UptimeRobot still focuses on traditional uptime monitoring in 2025. Its smart thresholds cut down on alert fatigue, they only fire after multiple failures. Multi-location checks drop false positives and sharpen detection across networks and cloud platforms.
Teams often pair UptimeRobot with internal or self-hosted tools for redundancy, forming hybrid setups that back up website monitoring. Use synthetic monitoring and real user monitoring (RUM), to compare lab tests with live traffic, and catch issues that hurt page load speed or core web vitals.
AI features in UptimeRobot stay minimal, other monitoring tools push stronger machine learning for proactive fixes. Forward logs to Datadog, New Relic, or Splunk, for AI-powered anomaly detection and root cause analysis.
Attach real-time alerts and push notifications to incident management systems, and log incident timelines for faster recovery. Teams may run large language models (LLMs) or openai tools to parse error stacks and suggest remediation steps.
A site that links UptimeRobot checks to Splunk often spots subtle DNS flaps before users see downtimes.
Better Stack
Better Stack catches outages fast, using synthetic monitoring and api monitoring to watch your web application and web services. It runs scheduled task checks, tracks uptime monitoring, and spots anomalies with ai-powered anomaly detection, so teams fix problems before users complain.
Real-Time Monitoring and Alerts
The free plan from Better Stack covers 10 monitors with 3-minute intervals. The Pro plan starts at $21 per month, and it offers 30-second checks. Global location testing verifies uptime across regions for accurate uptime monitoring of web services and cloud-based sites.
Setup takes minutes, so SaaS teams and startup ops get quick deployment and fast value.
Choose Slack, SMS, or email for real-time alerts, to get instant notices and shrink incident timelines. Customizable public status pages come included, they cut support tickets and improve transparency for customers.
Run synthetic monitoring for cron job monitoring, API monitoring, DNS monitoring and server monitoring, and pair it with RUM to watch page load speed and spot faults before users do.
This mix makes Better Stack a practical monitoring tool for website monitoring, uptime monitoring, and incident management.
AI-Driven Insights for Issue Resolution
AI spots anomalies fast, it flags odd spikes in page load speed, uptime monitoring and endpoint checks. Better Stack’s anomaly detection reaches up to 90% accuracy, and it cuts incident detection and resolution by more than 7 minutes.
AI filters duplicate alerts, so teams chase real outages, not noise. Generative AI powered observability can slash monitoring costs 60 to 80 percent, since up to 70 percent of raw data proves unnecessary.
Automated root cause analysis and proactive issue identification shrink troubleshooting time, they work with synthetic monitoring and real user monitoring, RUM, for richer context.
Context aware notifications suppress non critical alerts, they cut alert fatigue and keep incident timelines clear for incident management. Platforms like Datadog, site24x7 and New Relic add AI powered anomaly detection and use large language models, LLMs, to summarize incidents.
This mix helps meet recovery time objective and recovery point objective targets, and it reduces mean time to recovery.
Datadog
Datadog links log data, trace data, application performance monitoring, and infrastructure monitoring into one clean dashboard. Its ai-powered anomaly detection and machine learning models flag problems fast, protecting page load speed, core web vitals, and search engine visibility, like a smoke alarm for your site.
Comprehensive Performance Monitoring
This platform delivers real-time infrastructure and application monitoring, with core web vitals tracking and real user monitoring (RUM). The Datadog Agent v7.47+ adds GPU metrics, and the system links to Google Vertex AI, SageMaker, and Ray for richer analytics and AI-powered anomaly detection.
Pre-built dashboards show synthetic monitoring, performance monitoring, latency, and page load speed, and GPU monitoring ties into DCGM Exporter and TorchServe. Customers include CA Dept.
of Health Care Services, Flatiron Health, Neto, MercadoLibre, ORDERBIRD, Playstation Network, and TRAVELSUPERMARKET, and Gartner named the service in the 2024 Magic Quadrant for Observability.
You will not find a free uptime-only plan; paid plans start at $6 per host per month for real-time monitoring. Real-time user monitoring begins at $1.50 per 1,000 sessions per month, and session replay costs $1.80.
A Sensitive Data Scanner supports PCI-DSS and HIPAA compliance, while synthetic transaction monitoring, API monitoring, and server monitoring shorten incident timelines and aid root cause analysis.
AI Tools for Predictive Analytics
AI forecasting models use two to six weeks of historical data to spot trends. Linear and seasonal algorithms power performance forecasting, giving insights up to a week ahead. Watchdog AI detects abnormal error and latency, and it streamlines root cause analysis for faster incident timelines.
AI-powered log analysis groups logs, highlights patterns, and cuts mean time to resolution for website monitoring and uptime monitoring.
Datadog users report avoiding a $2,000,000 loss for an online retailer during Black Friday. Teams cut cloud costs and trim troubleshooting time by up to 60 percent, and they add AI-powered anomaly detection to performance monitoring to reduce noisy alerts.
Large language models (llms), synthetic monitoring, and real user monitoring (rum) feed predictive rules, trigger real-time alerts, and link into infrastructure as code workflows. Enterprises move to hybrid cloud, with adoption forecast at 90 percent by 2027, and predictive analytics helps plan disaster recovery and RPO.
Site24x7
Site24x7 monitors real user monitoring (RUM), simulated checks, application and infrastructure monitoring, and cloud hosting, so you can watch website performance and page load speed.
Its AI-based root cause analysis and incident management spot anomalies and DDoS attacks fast, and cut downtime to protect visitor experience.
Multi-Platform Monitoring Support
It tracks uptime from 130 global locations, giving a clear view of regional availability. Teams get synthetic monitoring and real user monitoring (RUM), so they see lab checks and live traffic.
You can monitor load times, SSL/TLS status, domain expiry, and brand reputation, from one dashboard. On site24x7, unified monitoring covers websites, xml web services, servers, and critical services, keeping dns monitoring and infrastructure monitoring aligned.
Linking with Slack delivers real-time alerts, and ops staff jump on incidents faster. Plans start at $9 per month for Web Uptime, Pro runs $35, Classic costs $89, and Enterprise begins at $225 per month.
A free plan gives 5 monitors, at 10 minute intervals, a simple option for basic uptime monitoring. Global testing makes this a good fit for distributed or multi region setups, and it supports synthetic transaction monitoring, core web vitals checks, and cron job monitoring.
AI-Based Root Cause Analysis
Site24x7 uses AI to find the root cause of incidents fast. AI automates analysis and reporting, and it speeds triage and resolution for website performance and uptime monitoring. AI-powered anomaly detection spots performance regressions and security threats, and it links real user monitoring (rum), synthetic transaction monitoring and synthetic monitoring data to incident timelines.
Alerting that uses AI ranks incidents to cut alert fatigue, it feeds real-time alerts into incident management and logs for audit trails. AI-driven insights tune infrastructure, boost ROI, and help compliance-focused teams meet SOC 2 and HIPAA requirements.
Pingdom
Pingdom runs synthetic monitoring and RUM to spot page load slowdowns and uptime drops before users notice. Its AI-powered anomaly detection links real-time alerts to incident timelines, and speeds up fixes.
Historical Data Analysis
You can analyze 400 days of performance data to spot slow trends. The platform runs uptime, page speed, transaction, and real user monitoring (RUM) from over 100 global test locations.
Tools like Better Stack and Datadog pair synthetic monitoring and synthetic transaction monitoring with RUM to reveal repeat failures. That adds context to page load speed, core web vitals, and website performance.
Historic charts help with website monitoring and infrastructure monitoring, and they show when five nines slips occur.
site24x7 stores those 400 days, and teams use its reports and dashboards to visualize long-term performance. Plans start at $10/month, no free plan exists, and enterprise plans are custom priced.
Flexible alerting options provide timely notifications and feed real-time alerts into incident management and incident timelines. Enterprises rely on this data for SLA reporting and compliance documentation.
Artificial intelligence, including ai-powered anomaly detection and large language models (llms), speeds root cause analysis and flags potential data leakage. Teams can link historical logs to api monitoring, dns monitoring, server monitoring, ddos protection, and web application firewall events, to speed recovery and test a disaster recovery plan.
AI-Enhanced Uptime Tracking
Pingdom blends synthetic monitoring, real user monitoring (RUM), and AI-powered anomaly detection to track uptime, page load speed, and site performance. The system uses machine learning to detect anomalies.
It cuts false positives, it filters out noise, and it sends alerts that point to actionable incidents, no crying wolf. This mix gives a holistic view across uptime monitoring, synthetic transaction monitoring, and core web vitals.
AI-driven insights find patterns that cause recurring downtime, and they link repeat failures across server, DNS, and API checks. Advanced alerting reduces mean time to detection and resolution, and it feeds incident timelines into incident management tools.
Teams use large language models to parse logs, spot prompt injection attempts, and guard against data leakage risks. A real example lets synthetic tests trigger targeted runs when asynchronous call errors spike, ops get a clean alert, and fixes roll out faster.
New Relic

New Relic gives full-stack visibility, with real user monitoring and synthetic monitoring to track page load speed and core web vitals. Its AI-powered anomaly detection feeds incident management, tracing, large language models (LLMs) for playbooks, and alarms for data leakage or malicious code.
Full-Stack Visibility
This platform monitors your entire tech stack, covering web browser and backend servers, plus APIs and critical services. Customizable dashboards offer granular visibility into application health, showing real user monitoring (RUM), synthetic monitoring, synthetic transaction monitoring, and core web vitals.
Free plans include 100 GB/month of data; paid plans start at $25/month, so teams can test website performance without big spend.
OpenTelemetry hooks feed traces into New Relic AI, which delivers system health insights, proactive recommendations, and AI-powered anomaly detection. Enterprises use it for full-stack observability and compliance, and it ties into incident management and incident timelines to speed root cause analysis, helping with uptime monitoring, infrastructure monitoring, and page load speed fixes.
AI-Powered Anomaly Detection
AI-powered anomaly detection spots odd behavior in site traffic, app metrics, and performance monitoring signals. Models analyze real user monitoring (rum), synthetic monitoring, and infrastructure monitoring, to flag abnormal patterns in application performance.
They cut detection and resolution times by using machine learning on historical data, and they reduce noise by suppressing non critical incidents that cause alert fatigue. Alerts use AI for smart, context-aware notifications, so teams get relevant, real-time alerts that speed response.
Predictive analytics forecast system health and potential failures, and they inform uptime monitoring and page load speed work that protects core web vitals. Engineers get faster root cause analysis, with AI that builds incident timelines for incident management and highlights probable causes.
New Relic and similar monitoring tools apply explainable ai, large language models (llms), and data lineage checks to limit data leakage and keep the web secure. Real-time alerts tie into synthetic transaction monitoring and performance monitoring, to protect user experience and boost uptime.
Uptrends
Uptrends runs synthetic transaction monitoring, real user monitoring (RUM), API probes, DNS tests, and infrastructure checks, to track page load speed, core web vitals, and uptime.
Its AI-powered anomaly detection aids root cause analysis and builds incident timelines, so you act fast, stop outages before customers notice, read on.
Customizable Monitoring Preferences
Teams use Uptrends to set monitoring preferences based on business priorities. Paid plans start at $5.10 per credit/month, and the platform runs checks from 233 global monitoring locations.
You can pick synthetic monitoring or real user monitoring (RUM), and set check intervals to match peak traffic or slow nights.
Custom dashboards highlight KPIs like page load speed, uptime monitoring, and core web vitals. Multiple alert channels send real-time alerts to ops, SMS, email, or team chat, so staff can act fast.
The platform covers api monitoring, cron job monitoring, dns monitoring, and server monitoring for e-commerce and global websites that need fine-tuned oversight. AI spots anomalies in synthetic transactions and real sessions, it trims incident timelines, and helps stop downtime before customers notice.
AI for Proactive Issue Prevention
AI-driven monitoring spots performance drops before users notice, and it flags trends that can lead to outages, so teams can catch issues before they snowball. It uses machine learning to analyze synthetic monitoring and traffic trends.
Platforms like New Relic, Datadog, site24x7, Pingdom, Uptrends, Better Stack and Uptime Robot apply ai-powered anomaly detection to uptime monitoring, synthetic transaction monitoring, real user monitoring (rum), page load speed tests and core web vitals.
Automated root cause analysis takes corrective actions or notifies relevant teams, and AI features reduce mean time to detection. That drop in detection time trims downtime, and it helps keep SLA compliance high.
Tools send real-time alerts, create incident timelines, and link to incident management, across infrastructure monitoring, server monitoring, api monitoring, cron job monitoring and dns monitoring.
Large language models (llms) add explainability and smarter alerts, but operators must guard against prompt injections, adversarial ML and data leakage to protect a secure website.
How to Select the Best AI Tool for Your Needs
Match monitoring coverage to your service needs and budget. Check team expertise, integrations, data privacy, and SLA needs before you buy.
- Assess current coverage, list gaps in uptime monitoring, RUM, synthetic monitoring, and infrastructure monitoring, map missing cron job monitoring, api monitoring, dns monitoring, and server monitoring to priorities and costs.
- Verify integrations with alerting platforms, incident management, and cloud services like AWS or GCP, check webhook, Slack, and Google Analytics hooks for real-time alerts and incident timelines.
- Ask about generative AI features, model access, and large language models (llms); demand safeguards, data leakage policies, and logging controls to protect customer data and internal telemetry.
- Compare monitoring types, use synthetic transaction monitoring for flows, RUM for user insights, and core web vitals for page load speed; balance historical data and live metrics.
- Weigh deployment choices, prefer SaaS for convenience, choose self-hosting like Uptime Kuma when you need data control, factor in team skill, maintenance, and potential data privacy tradeoffs.
- Inspect SLA reporting and compliance features for contracts, check vendor SLAs, request incident timelines, and confirm exportable reports for audits and customer disputes.
- Publish status pages publicly to reduce support requests, give clear incident timelines, and speed communication, verify tools can auto-update pages and integrate with real-time alerts and incident management.
- Try free plans and trials, test with real traffic and synthetic checks, use VWO Insights Web free plan up to 10,000 MTU to validate limits, measure operational efficiency, and watch for data leakage on cloud services.
Takeaways
Pick an observability platform that fits your stack, like Datadog, New Relic, Site24x7, Pingdom, UptimeRobot, Better Stack, or Uptrends. These services run synthetic monitoring, real user monitoring, and uptime monitoring, to keep page load speed and core web vitals in check, like a seatbelt for your site.
AI powered anomaly detection and root cause analysis cut false alerts, and they speed incident management. Try synthetic transaction monitoring, API monitoring, and server monitoring, then tune alerts to match your team.
Small sites and big hosts gain value, especially with large language models (llms) helping triage, and with performance monitoring to protect revenue.
FAQs
1. What do AI tools that monitor websites do?
AI monitoring tools watch website performance, and check uptime monitoring. They send real-time alerts when things go wrong. They use ai-powered anomaly detection to spot odd patterns, and they help with root cause analysis.
2. Which monitoring tools should I try?
Try site24x7 monitoring, New Relic APM, and better stack incident management. Use tools that mix real user monitoring (rum) with synthetic monitoring and synthetic transaction monitoring. Good monitoring tools cover website monitoring and performance monitoring together.
3. How do these tools help page speed and user metrics?
They track page load speed and core web vitals, they watch ajax calls, and they map website performance across pages. Synthetic monitoring simulates visits, rum shows real user data. Together they paint a clear picture, like a road map for speed fixes.
4. Can they catch server and network faults?
Yes. They offer infrastructure monitoring, server monitoring, and dns monitoring. They also cover api monitoring and cron job monitoring. If a web host fails, the tools flag it fast, so you can act.
5. Do they help with security and data risks?
They can spot signs of data leakage and data breaches, and they can link to malware scanner reports. They watch scraping and web scraper activity, and they scan social media signals, even posts on twitter, for threats. They do not replace security teams, but they speed detection.
6. How do large language models fit into site monitoring?
Large language models (llms) parse logs and write clear incident timelines for incident management. They summarize alerts, suggest fixes, and help with root cause analysis. Think of them as a calm teammate, who reads the room, and writes the after-action note.